Here at Datalab, we never tire of thinking about Key Stage 5 subject choice. I’ve already written about how it varies by gender, geographical area, disadvantage status and prior attainment.
And we’re not done yet. Today I’m going to look at how KS5 subject choice varies by ethnicity. I’ll be using data from the National Pupil Database, focusing on students who completed KS5 in 2022.
Setting the scene
First of all, a note on how I’ll be defining ethnicity. I’ll use the DfE’s ‘ethnic group minor’ categories. These are shown in the table below along with the total number of KS4 pupils who fell into each category in 2020.
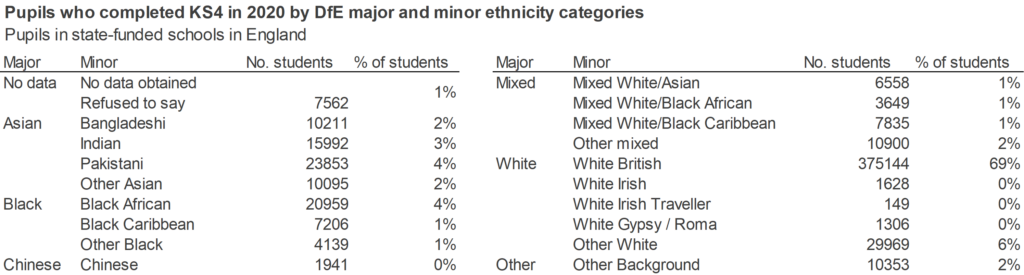
I have amalgamated the ‘no data obtained’ and ‘refused to say’ categories into ‘no data available’.
White British students made up just under 70% of the KS4 population. The next largest groups were other White and Pakistani.
There are some large differences in how likely pupils were to go on to complete a Level 3 qualification at Key Stage 5 by ethnicity. The chart below shows the proportion of KS4 pupils in each group who went on to enter a Level 3 qualification in 2022.
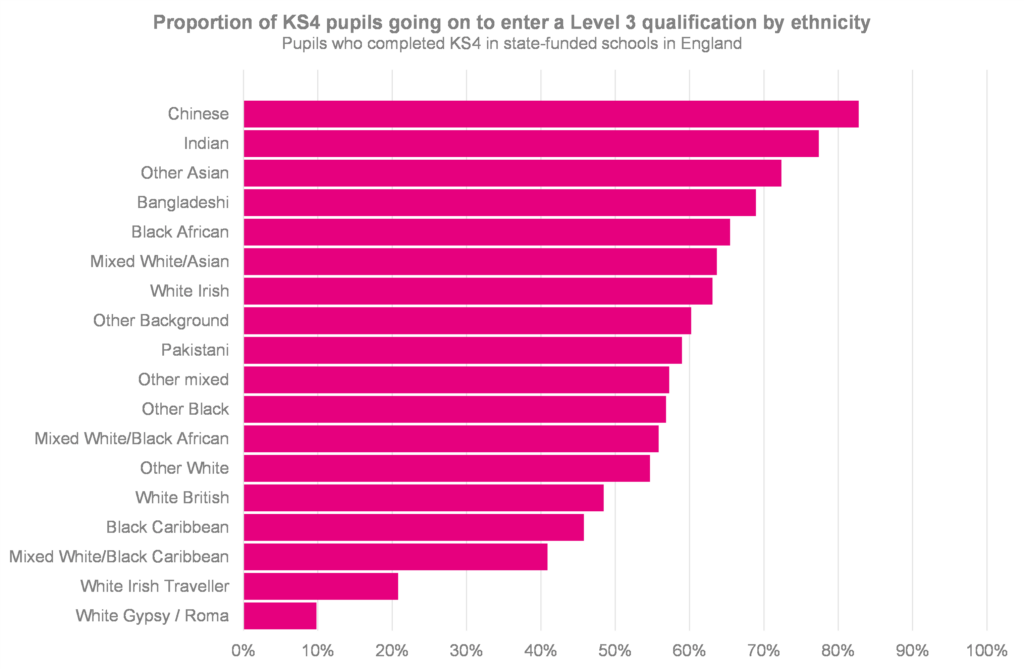
83% of pupils from a Chinese background and 76% of those from an Indian background went on to enter a L3 qualification. But just 21% of those from a White Irish Traveller background and 10% of those from a White Gypsy/Roma background did so.
In fact, the number of KS5 students from White Irish Traveller and White Gypsy/Roma backgrounds was so low that I won’t be able to provide information on the subject choices of students in these groups for data protection reasons.
Other groups with relatively low progression rates include mixed White/Black Caribbean, Black Caribbean and White British; in all of these groups, less than half of pupils went on to enter a Level 3 qualification.
It’s worth bearing in mind that differences in progression rates, and in subject choice at KS5, may be linked to differences in attainment.
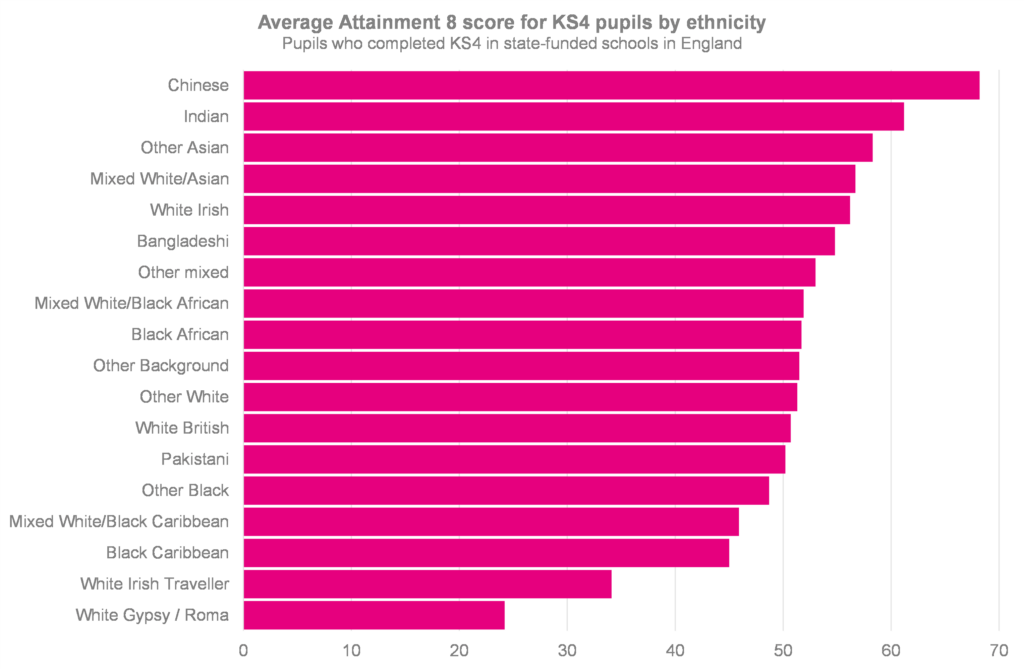
The groups with higher rates of progression also tend to have higher than average attainment, and vice versa.
Now let’s look at the choices made by those who did go on to complete a Level 3 qualification at KS5.
Number and type of qualification
Most Key Stage 5 students study A-Levels, but a substantial group take other Level 3 options, including BTECs, OCR Cambridge Technicals, T-levels and other applied general and technical qualifications..
The chart below allows you to select a qualification category and see the proportion of KS5 students who choose this option, by ethnicity.
KS5 students from a Chinese background were most likely to choose to study A-Levels – 88% did so last year, compared to just 54% Black Caribbean KS5 students, who were the group least likely to choose to study A-Levels.
There were also differences in the number of subjects studied. Chinese students were far more likely than any other group to take 4 or more A-Levels; 14% did so, while just 7% of the next most likely group (other White) did so. The group least likely to take four or more A-Levels were Black Caribbean students; less than 1% did so.
Most popular subjects by ethnic group
Let’s get down to subject level now. The chart below allows you to select an ethnic group and see a chart showing their ten most popular Key Stage 5 subjects in 2022. Note that all of the qualifications shown here are A-Levels – no single subject in another qualification was in the top ten for any group.
In many ways, the top tens are similar for all of the groups.
For the majority of ethnic groups, A-Level maths was the most popular subject. This was particularly true for students from a Chinese background – nearly twice as many studied this subject as the next most popular choice, chemistry.
The groups in which maths was not the most popular choice were Pakistani, Black Caribbean, other Black, mixed White and Black Caribbean, mixed White and Black African, and White British. The top choice for students from a Pakistani background was biology, and for the other groups it was psychology.
As well as maths, A-Levels in biology, chemistry and psychology made the top ten for every group.
By subject
Now let’s look at the same thing in a slightly different way, which should help us to tease out some of the differences between groups.
The chart below shows the proportion of KS5 students who studied each subject by ethnicity. I’ve limited the subjects to those with more than 5,000 entries in 2022.
Subjects in which there were particularly large differences between pupils from different ethnic groups include A-Level maths and A-Levels in the three main science subjects: biology, chemistry and physics.
As already noted above, maths was hugely popular among students from a Chinese background: 60% of KS5 students from this background studied the subject, as did 45% of those from an Indian or other Asian background. But just 11% of the group with which it was least popular: Black Caribbean KS5 students.
The large differences in the STEM subjects are partly driven by the fact that they tend to be particularly popular with students from Chinese, Indian and other Asian backgrounds. But they’re also driven by the fact that these subjects tend to be less popular with students from other backgrounds, particularly those from Black Caribbean backgrounds.
Some final thoughts
It’s always interesting to look at how subject choice breaks down by different characteristics. We’ve seen some big differences here, particularly in the STEM subjects. And it does raise the question of why these differences persist.
It’s tempting to speculate. But it’s perhaps particularly tricky to do so in this case. Because, interesting as it is to look at breakdowns like this, we should remember that there’s also a wider context to consider.
As I mentioned at the start of this post, we’ve written posts looking at how subject choice breaks down by all sorts of characteristics in the past, but all of these characteristics will likely interact with and relate to one another in different ways. So looking at them in isolation always gives us only part of the picture.
Want to stay up-to-date with the latest research from FFT Education Datalab? Sign up to Datalab’s mailing list to get notifications about new blogposts, or to receive the team’s half-termly newsletter.


Apologies for being pedantic, but the final graph isn’t as helpful as it could be.
It would seem that all the figures have been rounded to the nearest percent. In subjects with very low entries, such as Film Studies, all ethnicities are therefore either shown as being at 1% or 2%. In fact, those on 1% could be anywhere between 0.5% and 1.5% — so there’s quite a wide ‘error bar’ associated with each ethnicity, and actually the true reading is uniformly distributed across that error bar (the actual value is as likely to be at the extremes of the error bar as it is to be in the middle).
If accurate (not rounded) figures were used, a clearer (less ‘pixelated’) picture would emerge.
No need to apologise, we like a pedant here at Datalab! And this is a very fair point, I was a bit overenthusiastic with the rounding here. I’ve updated the final chart so that figures are rounded to 2dp instead. Hopefully that’s more useful.
Thanks for this Natasha, interesting analysis as always. At Mime we looked into the link between ethnicity and academic/vocational split at key stage 5 in our Post-16 Trajectories report for the GLA and London Councils. While we didn’t look at individual subject choice, we did control for KS4 prior attainment. On page 44 of the report (you can download from https://www.mimeconsulting.co.uk/london-post-16-trajectories), you can see that, when focussing on students with an average of a C grade at GCSE, there is a wide variation between ethnic groups in the choice of academic or vocational programme post-16. For example, Indian and Chinese students on a Level 3 course were far more likely (both at 61%) to be on an academic programme at age 16 compared to Black Caribbean students (44%).
Hi, great work, thank you, just to note in the paragraph “Most Key Stage 5 students study A-Levels, but a substantial group take other Level 3 options, including BTECs, OCR Nationals, T-levels and other applied general and technical qualifications.” – There isn’t a group of qualifications called OCR Nationals (They ended in 2012). At KS5 its OCR Cambridge Technicals. Hope that helps.
Thanks Toby, my mistake on the Nationals / Technicals – I’ll correct that now.