Schools Week recently had a very interesting article about a shortage of places in the state-funded alternative provision (AP) sector[1].
This was somewhat surprising given the most recent figures for the number of pupils on roll in the sector.
In January 2023, published DfE statistics show that there were 13,191 pupils on roll in 335 AP schools. However, this was somewhat lower than the 16,134 on roll in January 2019.
So why are AP schools so full?
I’ll be honest: I can’t answer this. But what I do want to show is that the published statistics on pupil numbers in AP schools under-report the true number.
Data
For this blog I use termly School Census data for the years 2019/20 to 2021/22[2]. I did not have 2022/23 data available at the time of writing. This contains details of all enrolments at state-funded schools in England.
I link School Census to data from Get Information About Schools to identify which pupils are attending AP schools.
Enrolment status
Most pupils who go to schools in England go to one school. They will be recorded in schools’ management information systems as having an enrolment status of C, which stands for ‘current’ according to the definitions given in the Common Basic Dataset for Schools.
Some pupils who attend AP schools may be attending part-time and attending another (often mainstream) school the rest of the time. One school will hold the pupil’s main registration (enrolment status M) and the other (usually the AP school) will hold a subsidiary registration (enrolment status S).
In some cases, other enrolment statuses may apply. For instance, if a pupil is principally attending an FE College or other provider (e.g. an independent AP school).
The table below shows the enrolment statuses of all pupils on roll in AP schools in January 2022 according to School Census.

Published statistics for that year show that there were 11,684 pupils on roll in AP schools. This is the total of the current, main and other enrolments from the table above. (Thanks to Ruth Maisey for a comment below on an earlier version of this blog).
The published figures under-estimate (in the example above by a half) the number of pupils on the roll of AP schools at any one time.
Moreover, there may also be pupils attending AP schools who are not on roll but who may be attending on a trial or temporary basis. These figures cannot be calculated from School Census so the scale of this is unknown.
A breakdown of enrolments by school type for January 2022 is shown below.

Enrolments in AP schools
The second point to make is that AP schools tend to fill up as the year progresses.

In 2022, there were 46% more enrolments in AP schools in Summer than in Autumn.
Part of the reason that numbers fall between Summer and Autumn is that many pupils in AP are in Year 11 and most AP schools do not offer post-16 provision.
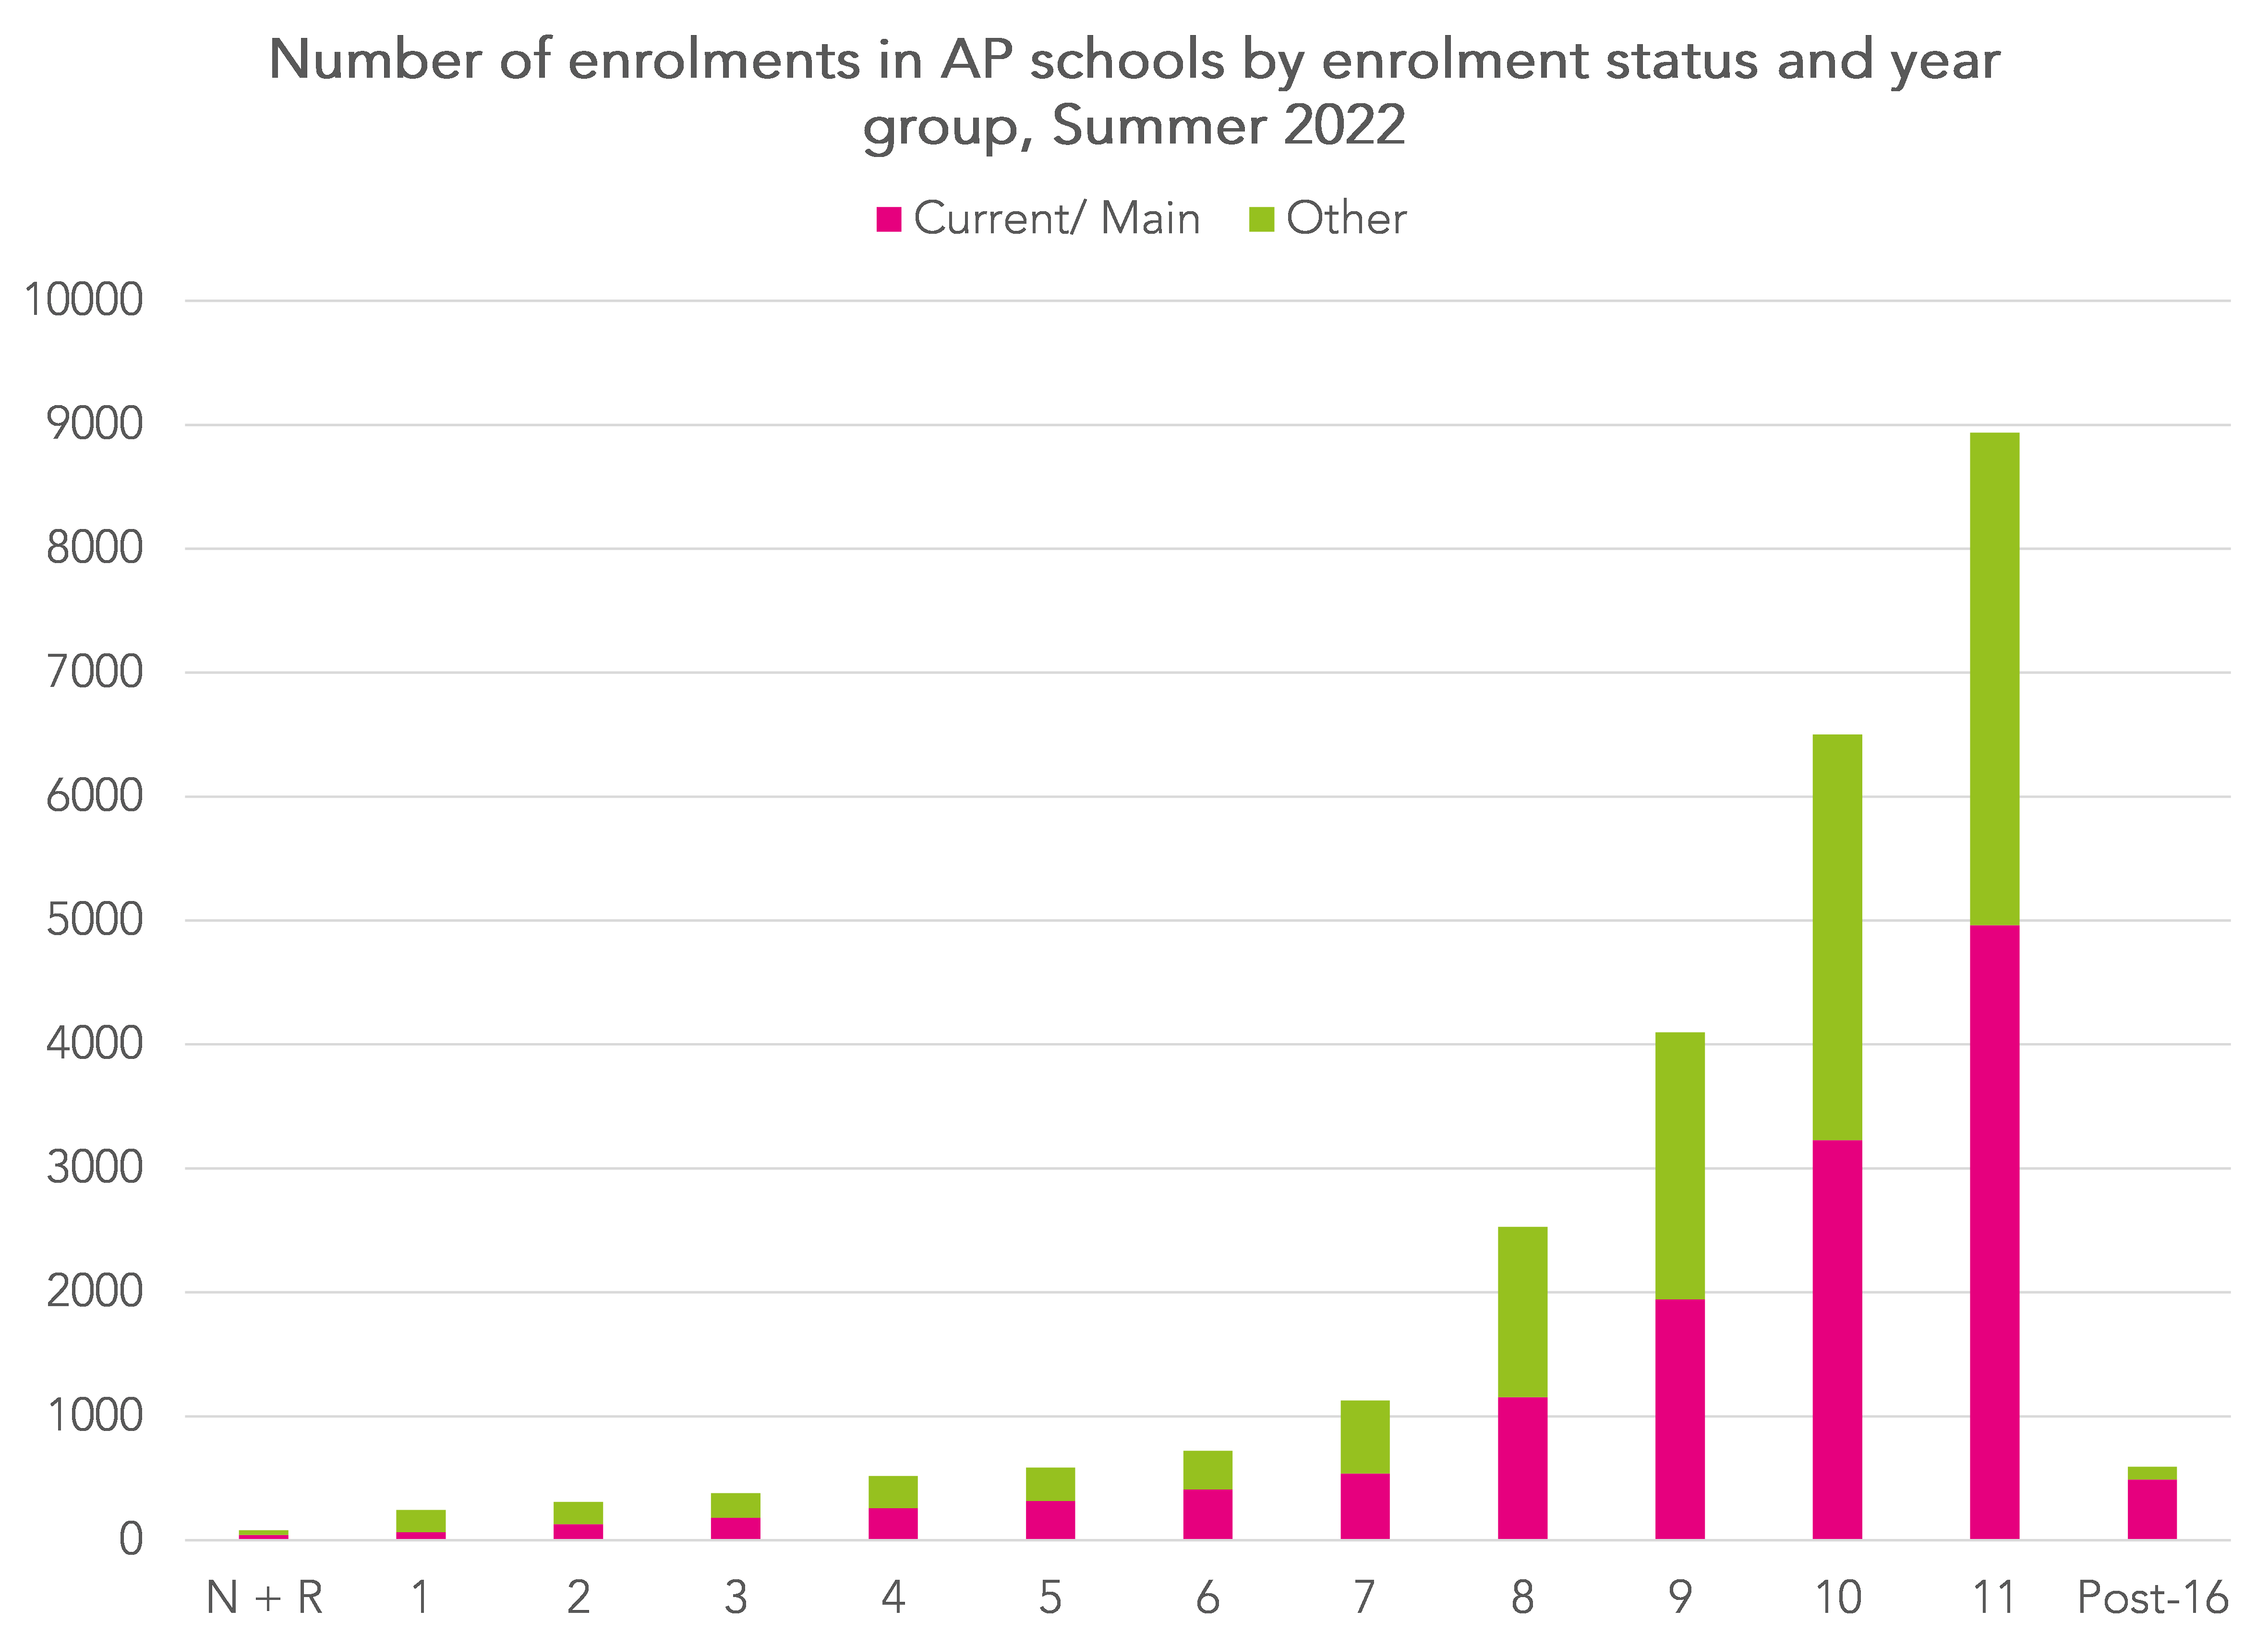
So it would seem unusual that there should be such demand for places in the AP sector at the start of a school year.
I should also point out that some pupils could be counted more than once in the charts above (e.g. if they held a main registration at one AP school and a subsidiary registration at the other). But only around 200 pupils appear to be affected each term.
Missing main enrolments
Around a thousand pupils with a subsidiary registration at an AP school appear to have no corresponding main enrolment at a state-funded school in England.
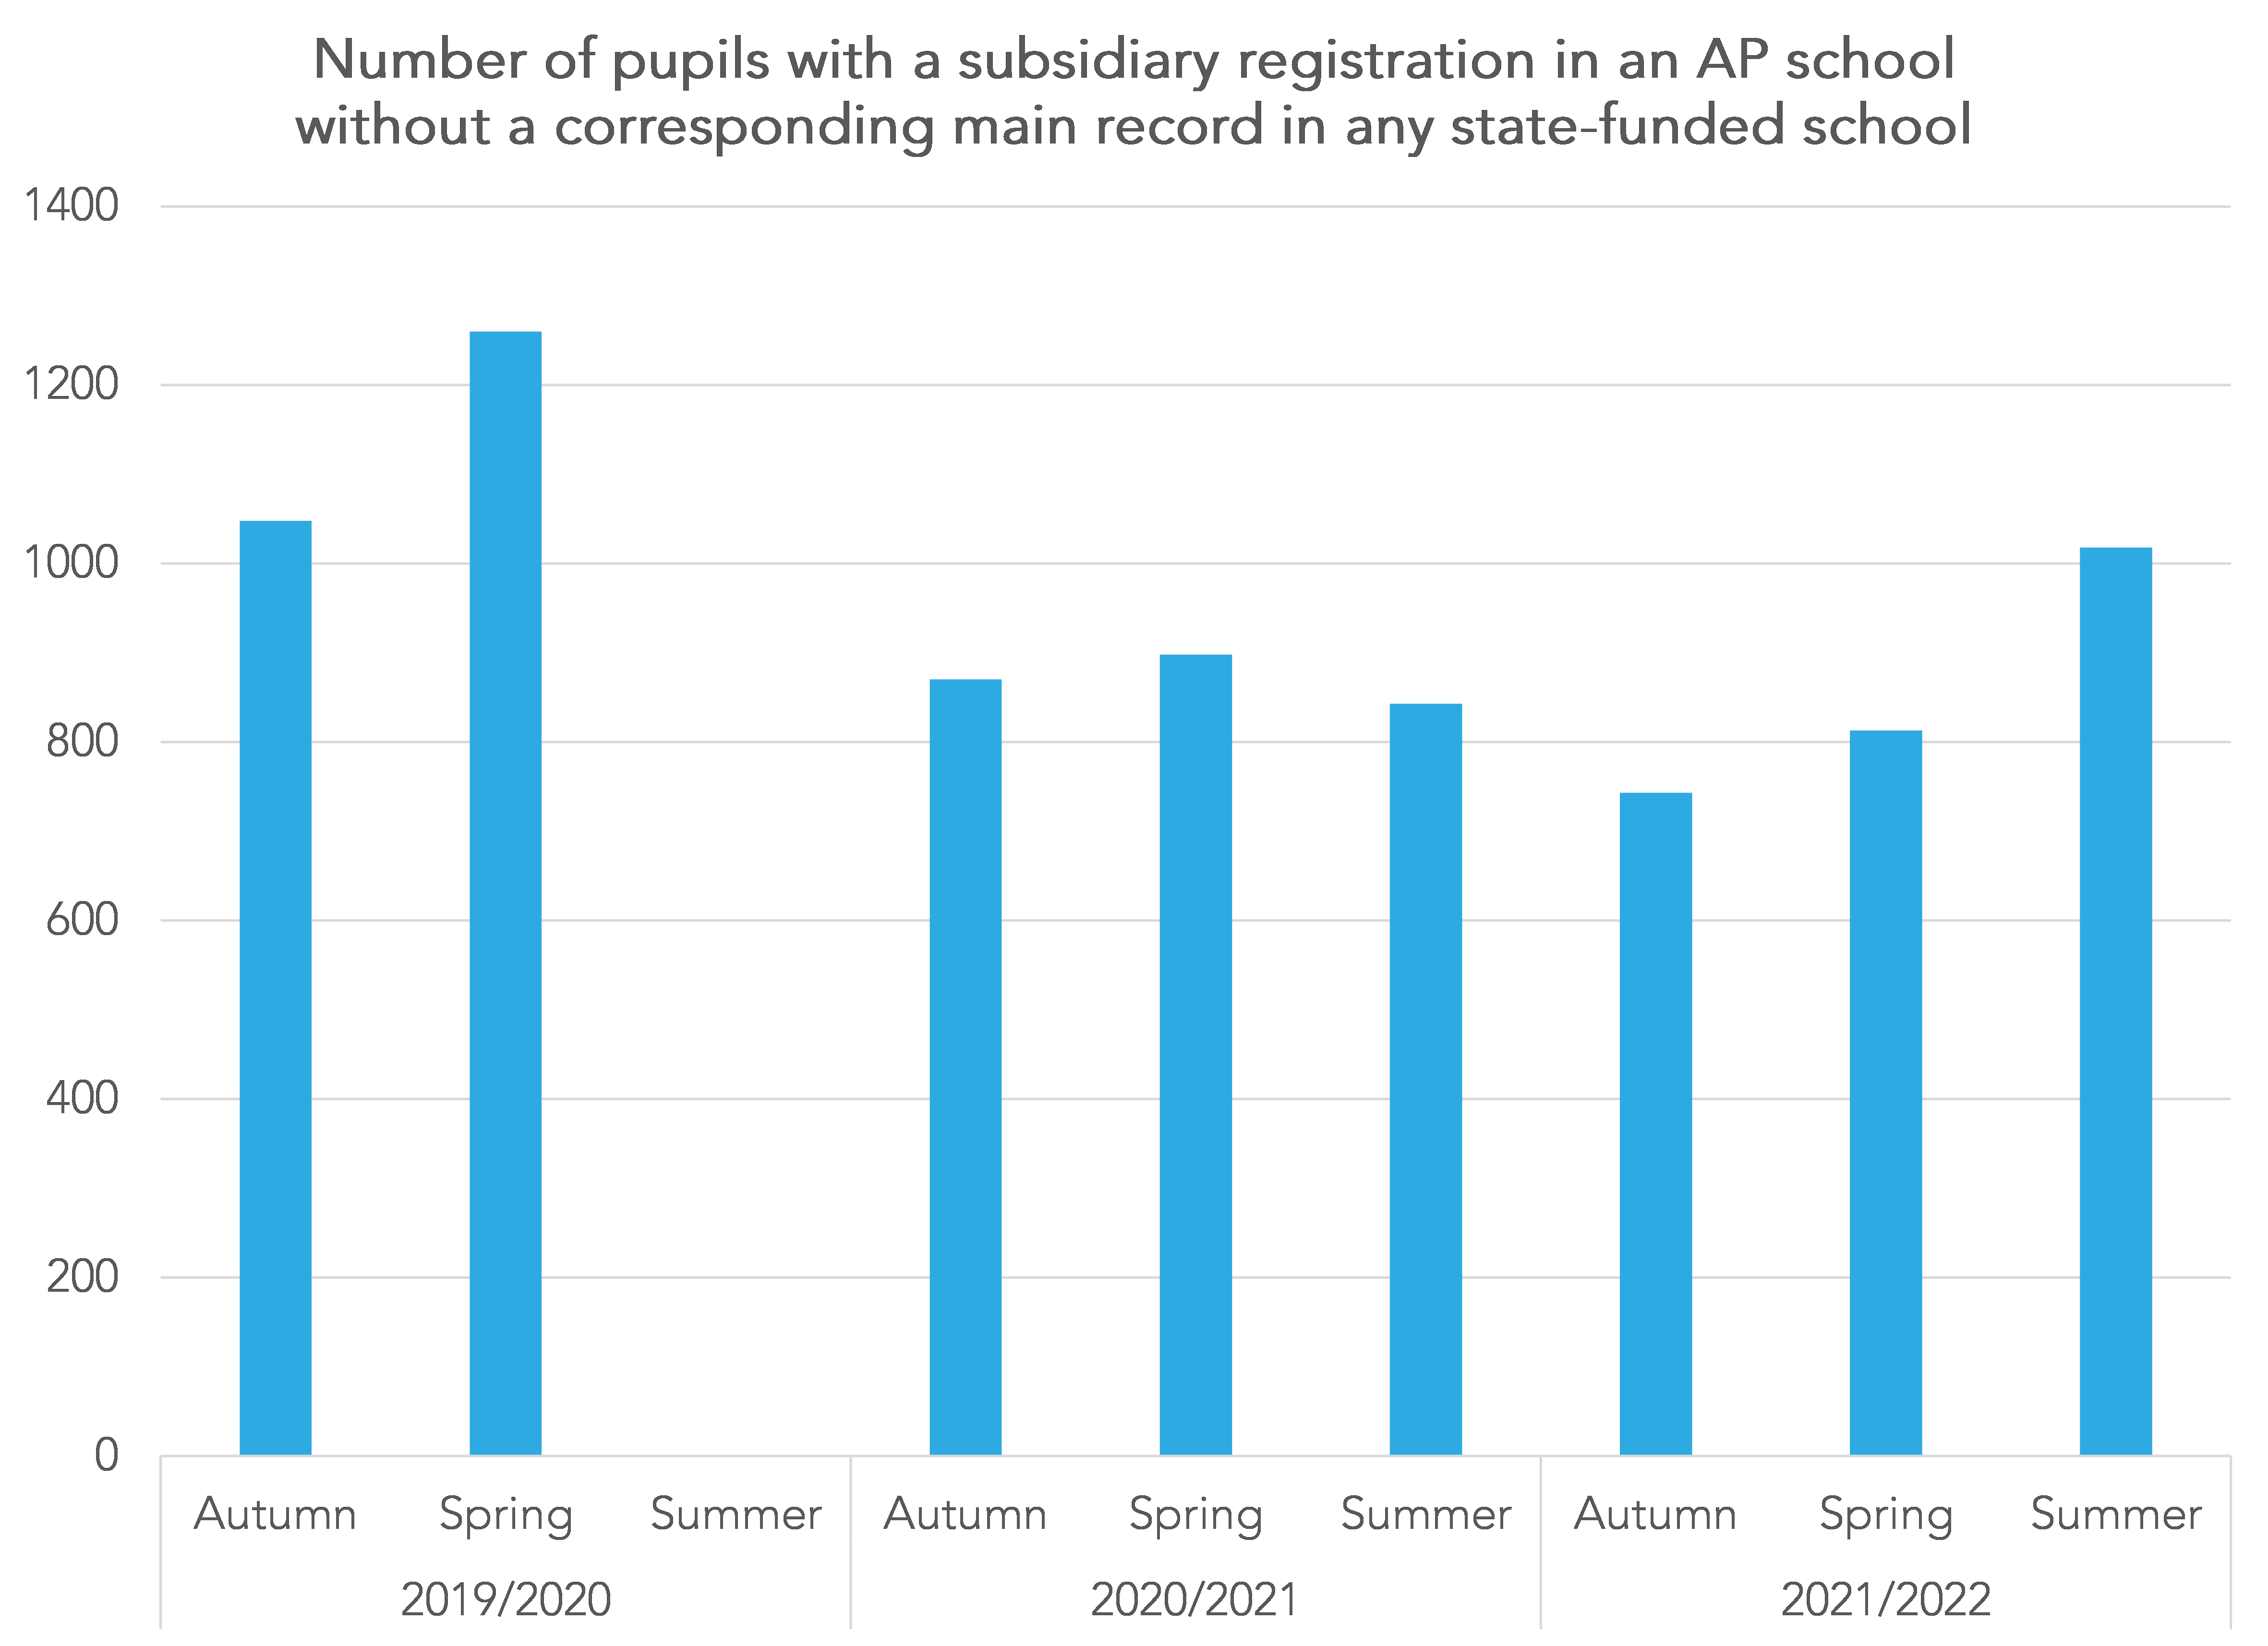
59% of these pupils in Summer 2022 were in Year 10 or 11, which is in line with the age profile of pupils in the sector as a whole.
Summing up
If you were to look at the official statistics on the numbers of pupils on roll in the AP sector, you will find a table that says there were 13,191 pupils on roll in January 2023. However, this only includes pupils with current and main registrations.
In the commentary in the statistical release the number of subsidiary registrations for 2023 is reported (11,900) giving a total number of 25,100 placements. However, this is only shown for the current year. It would be better if the time series of subsidiary registrations were added to the table.
The number of pupils on roll with current or main registrations in the AP sector in January 2023 was lower than in 2019. So it remains something of a mystery why there should be reports of the sector being full now.
One explanation may be that demand increased substantially after January. The AP sector tends to fill up as the year progresses so this could be feasible. Other explanations may be that capacity reduced when numbers fell during 2020/21.
It is also worth remembering two things with regard to AP schools.
Firstly, that not all pupils who end up in AP have been excluded.
Secondly, that not all AP schools have pupils with current or main enrolments. In fact, if you look at DfE’s published school-level statistics (csv), you will see that there are apparently some AP schools without any pupils at all.
However, if data on subsidiary and other registrations were published each term we would have a better idea of how many pupils are attending each school.
- This includes pupil referral units and AP academies and free schools.
- Data for the summer term 2019/20 was not collected due to national lockdown as a result of the COVID-19 pandemic.
Want to stay up-to-date with the latest research from FFT Education Datalab? Sign up to Datalab’s mailing list to get notifications about new blogposts, or to receive the team’s half-termly newsletter.


If the Education Department statisticians can easily get wrong how many pupils on role for funding purposes then one wonders how reliable any figures are! I think about number of home schooled children who used to arrive at 16 with nothing into local college (where I used to work). Also those who are supported with one to one (council) or who drop out and don’t appear anywhere.
You say that “Published statistics for that year show that there were 11,684 pupils on roll in AP schools. This is almost the total of the current and main enrolments from the table above (11,605). I can’t be sure what explains the shortfall …” However, if you add in the “other” enrolments (79) you get 11,684…
Hi Ruth. That’s an award-winning comment! Many thanks!
It is not always easy getting accurate data from schools, but giving schools better census advice would help. My bugbear is this: if 63% of pupils are White British and so very likely to have English as their first language to have English as their first languge and another 7-10% probaby do too or are unknown, why is the English as an additional language figure only 20%? It is probably really at least 25%
Hi Graham. I certainly think there is under-reporting of first language in secondary schools – see https://ffteducationdatalab.org.uk/2020/05/why-does-eal-status-change-between-primary-and-secondary-school-for-some-pupils/ for example. I do wonder if some parents prefer to select English as their child’s first language on admissions forms for whatever reason. You would probably know more than me about this.