Following the recommendations of the Timpson Review, the government response and some of the resulting debate, I think it is worth clarifying the following two points:
- Not all pupils who end up in state-funded alternative provision schools have been permanently excluded
- Not all pupils who have been permanently excluded end up in state-funded alternative provision schools
In this blogpost, I will look at pupils on roll in state-funded alternative provision, while in a second post, I will look at the Year 11 destinations of permanently excluded pupils.
How many pupils are enrolled at state-funded AP schools?
First of all, a look at the number of pupils on roll at pupil referral units and alternative provision academies and free schools. We’ll refer to these as state-funded alternative provision schools from this point on.
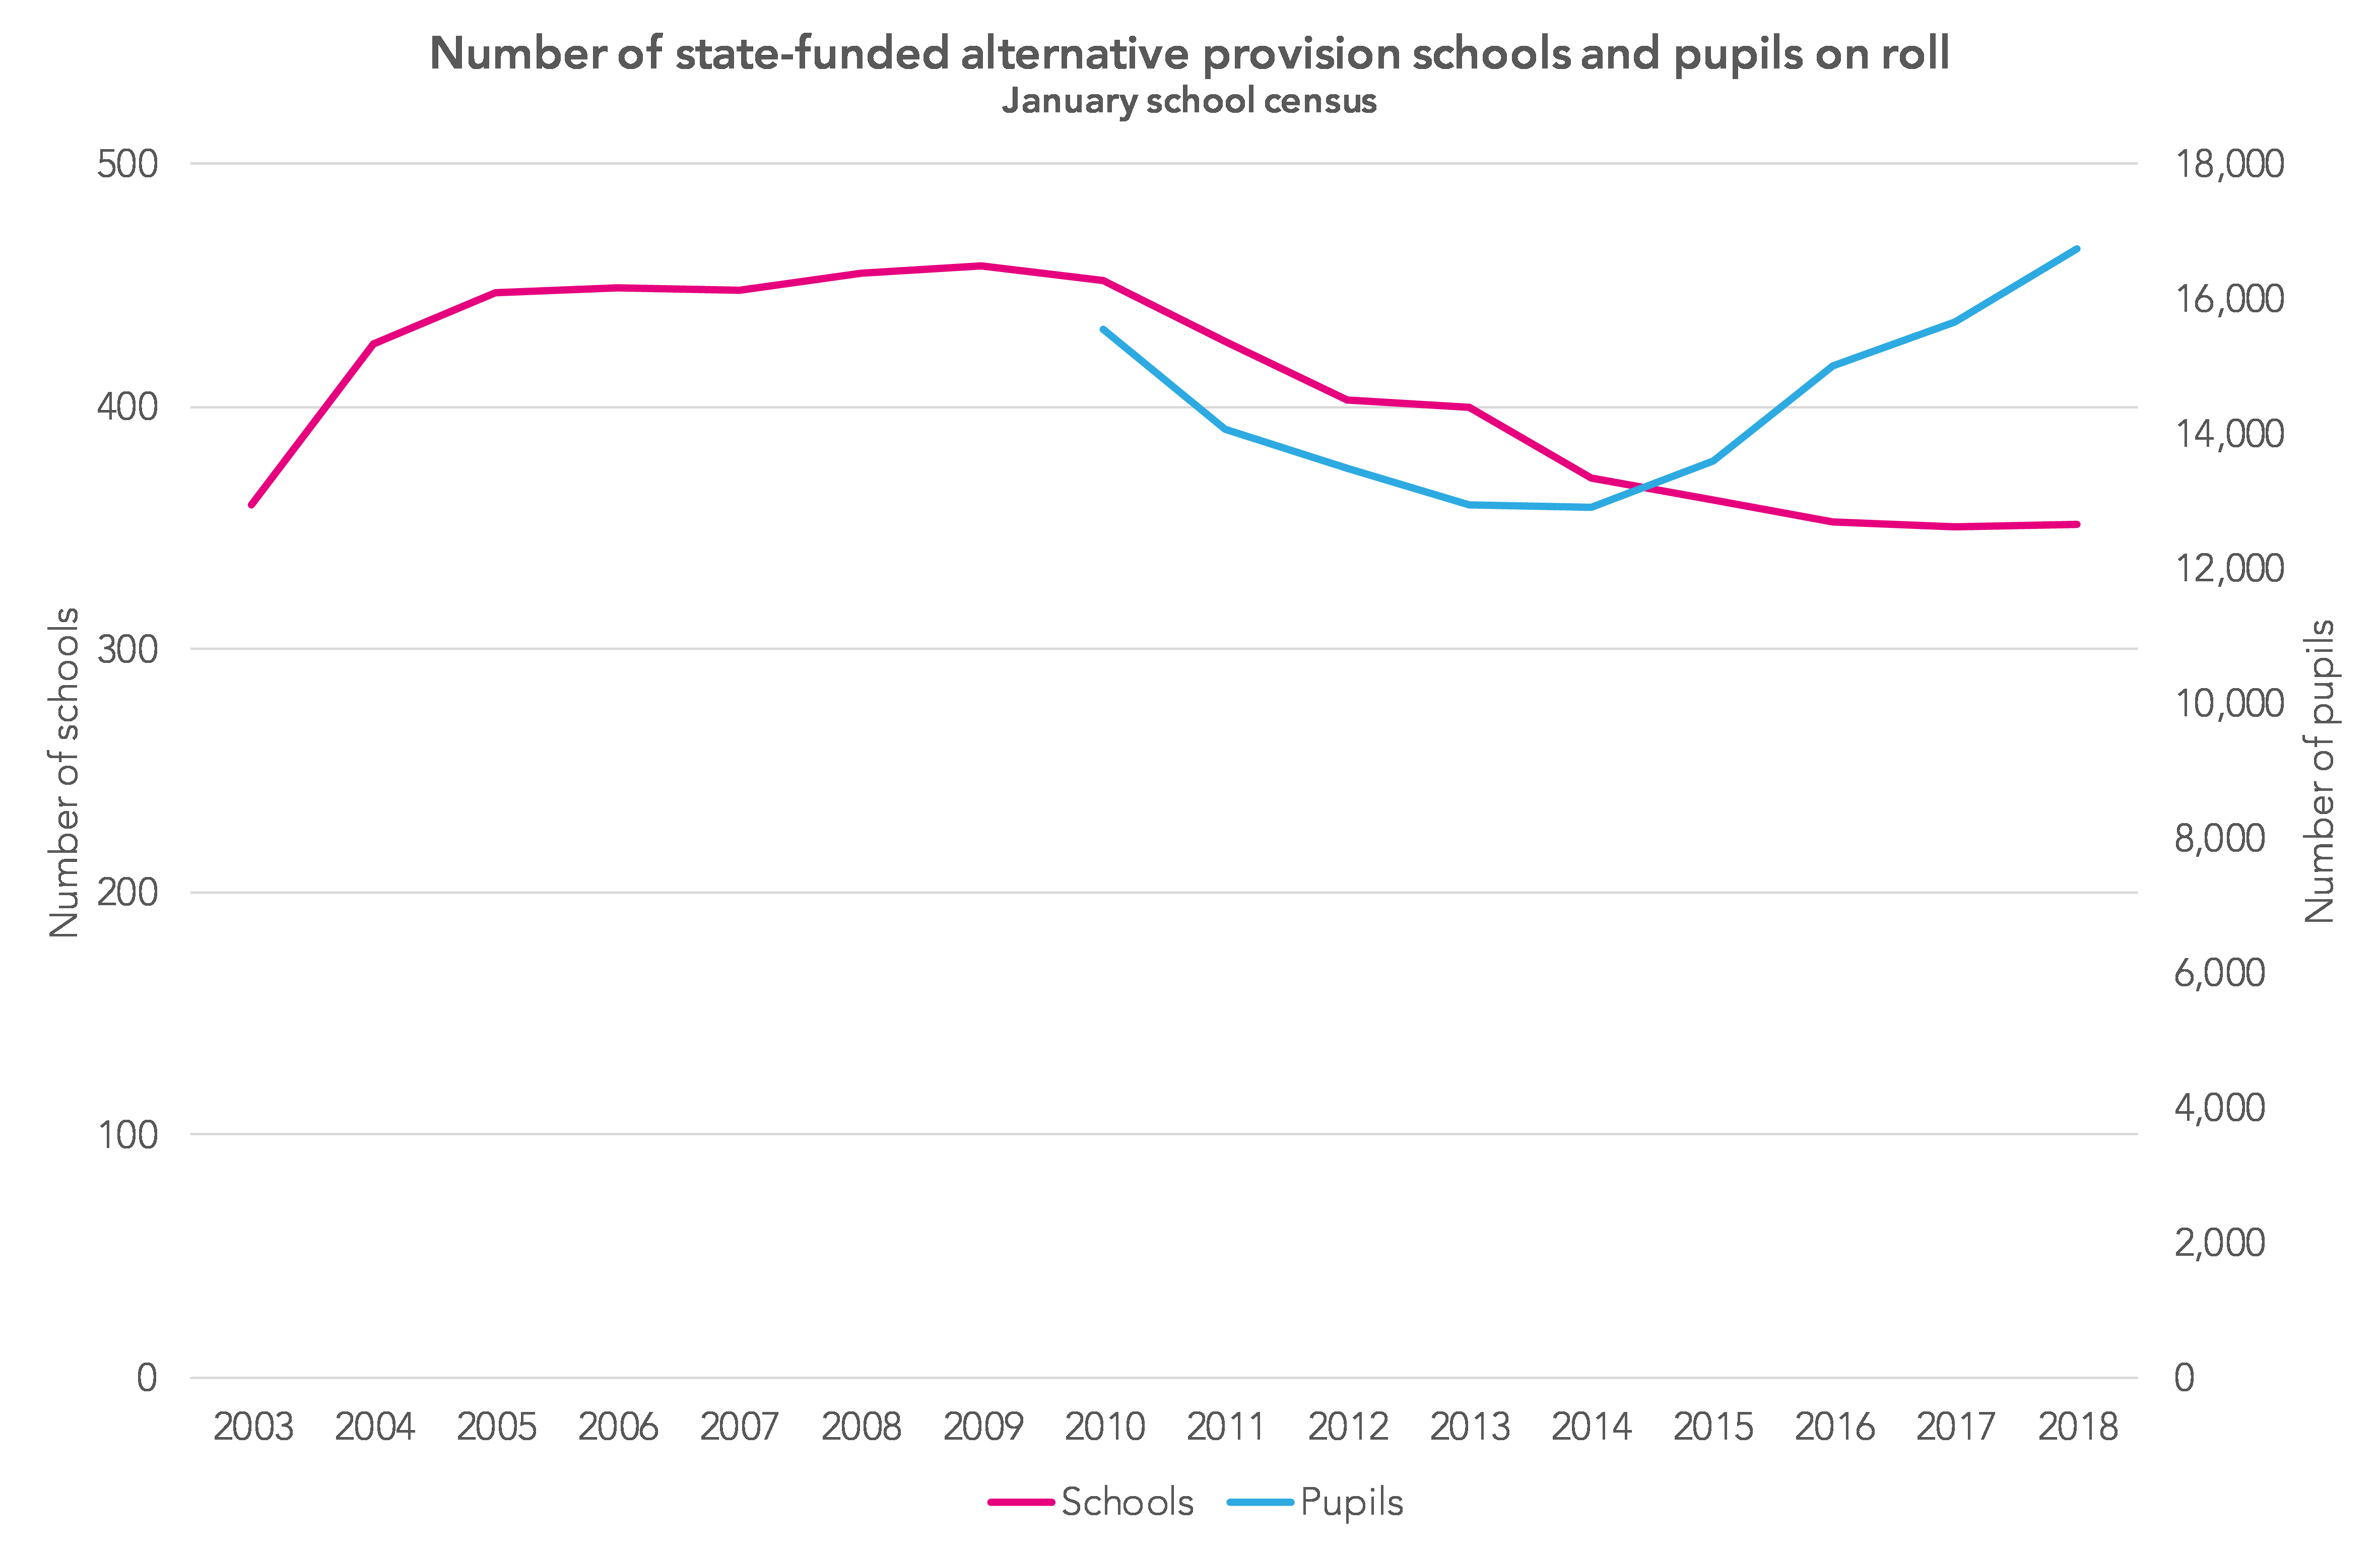
Published Department for Education statistics show that the number of these schools has been falling since 2010. Even though there are fewer of them, the number of pupils on roll at state-funded AP schools has been increasing since 2014, while the number of exclusions has been increasing.[1]
The published statistics are based on pupils with either a sole or main registration at a state-funded AP school in January of the given year. Other pupils may well be attending them on a subsidiary or temporary basis whilst being registered at another school.[2]
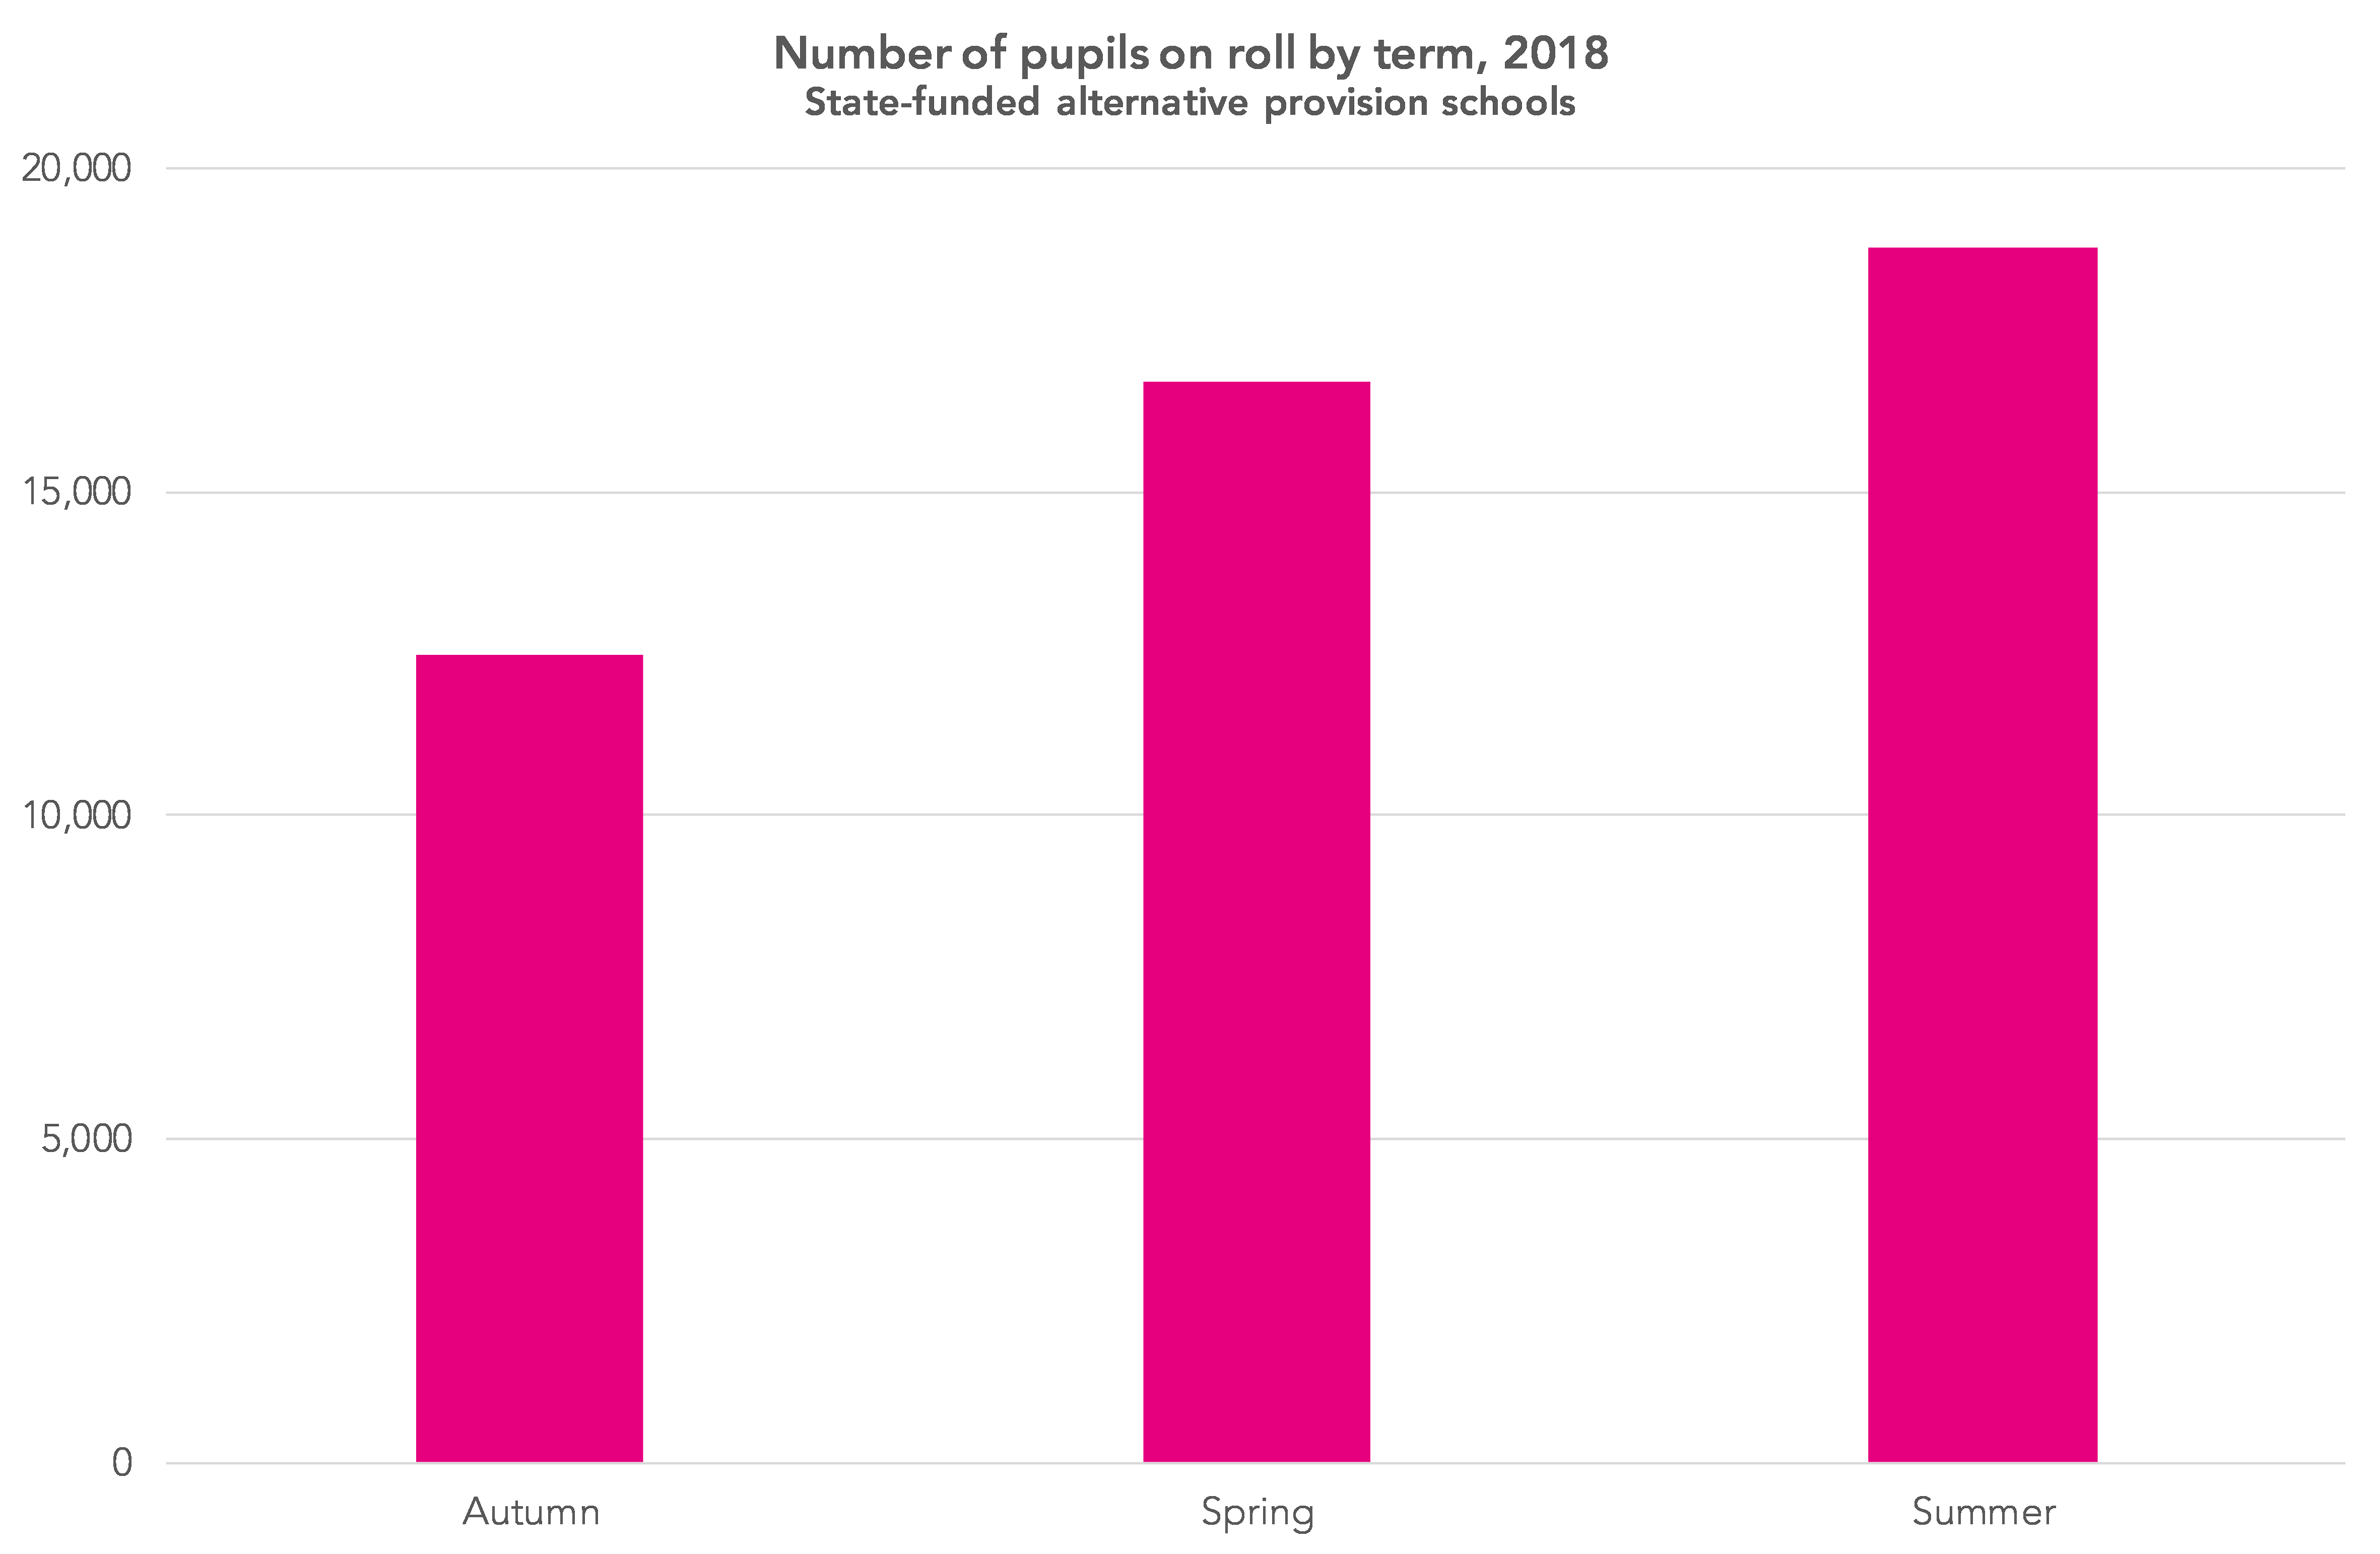
What the statistics don’t show is how state-funded AP schools fill up during the course of the academic year. Looking at 2017/18 data, and now working with National Pupil Database (NPD) data rather than published data, there was an almost 50% increase in enrolments between autumn and summer.
How many pupils enrolled in state-funded AP schools had been permanently excluded?
Data on exclusions up to the end of 2016/17 was available in the NPD at the time of writing.
That said, we know that not all exclusions are recorded in NPD (see section 10 of this [PDF]). Exclusions data is collected two terms in arrears, so when a school closes (e.g. to become a sponsored academy) exclusions data is not collected for the final two terms.
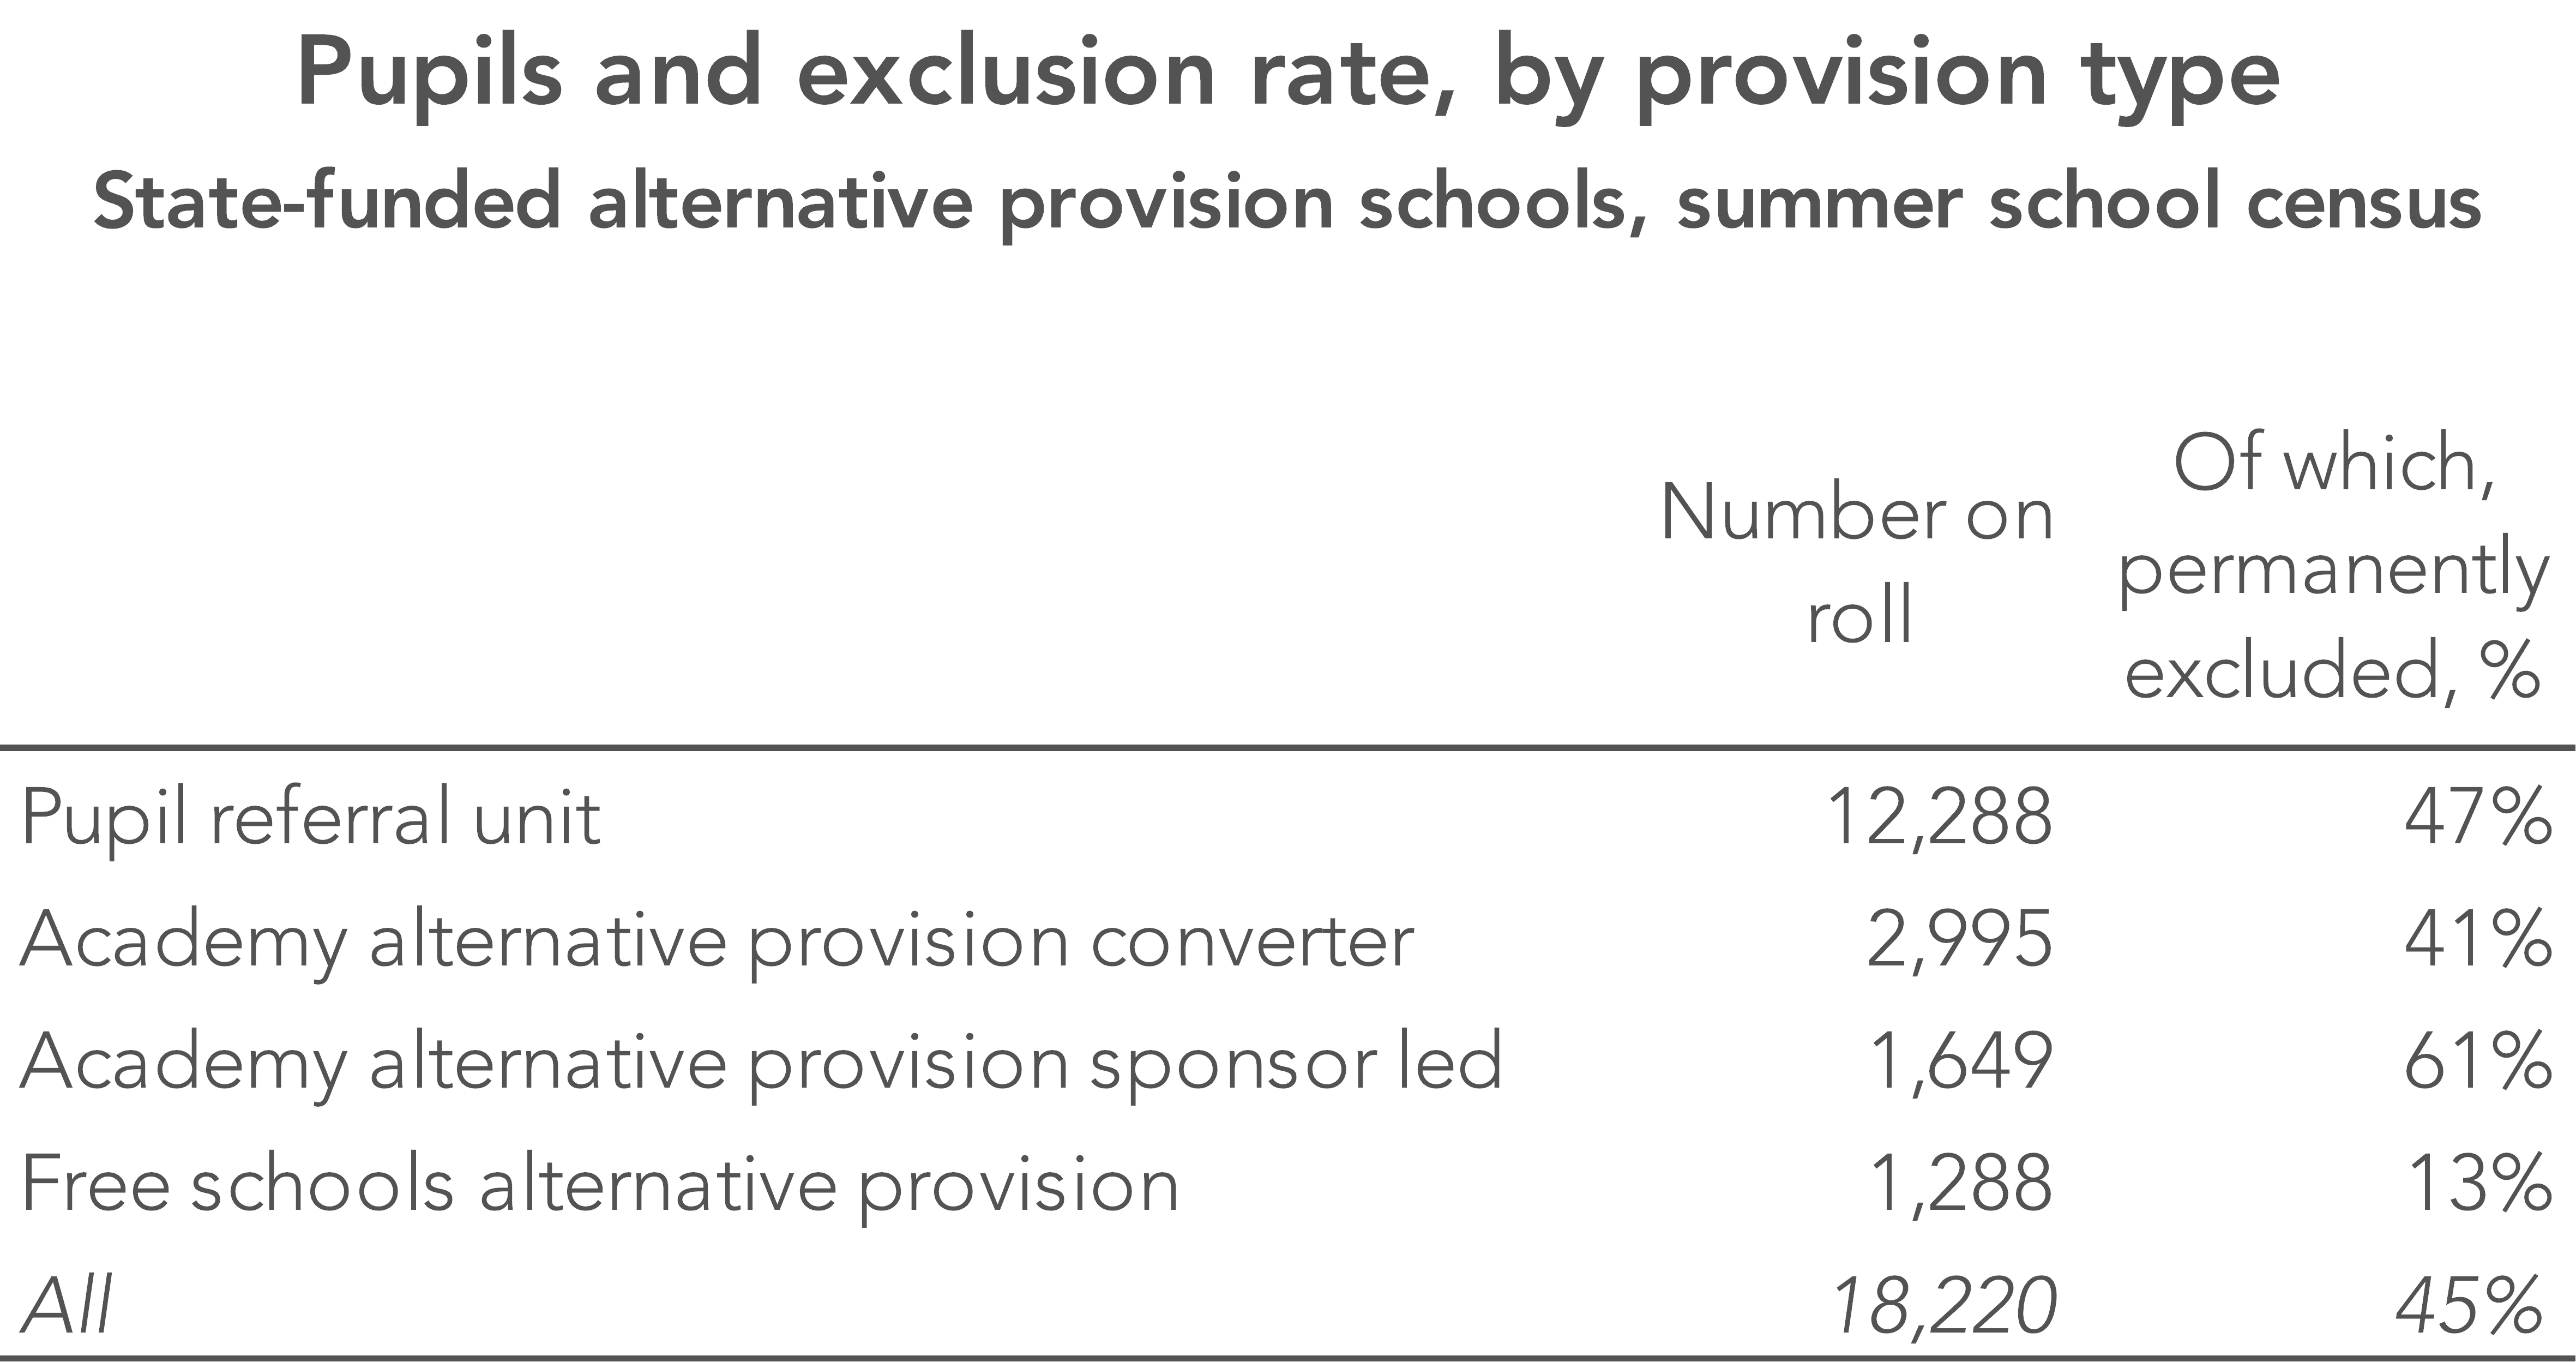
Leaving aside this small hole, the table below shows that 45% of pupils on roll in state-funded AP schools in summer 2017 were known to have previously been permanently excluded. However, the rate among AP free schools was much lower at just 13%.[3]
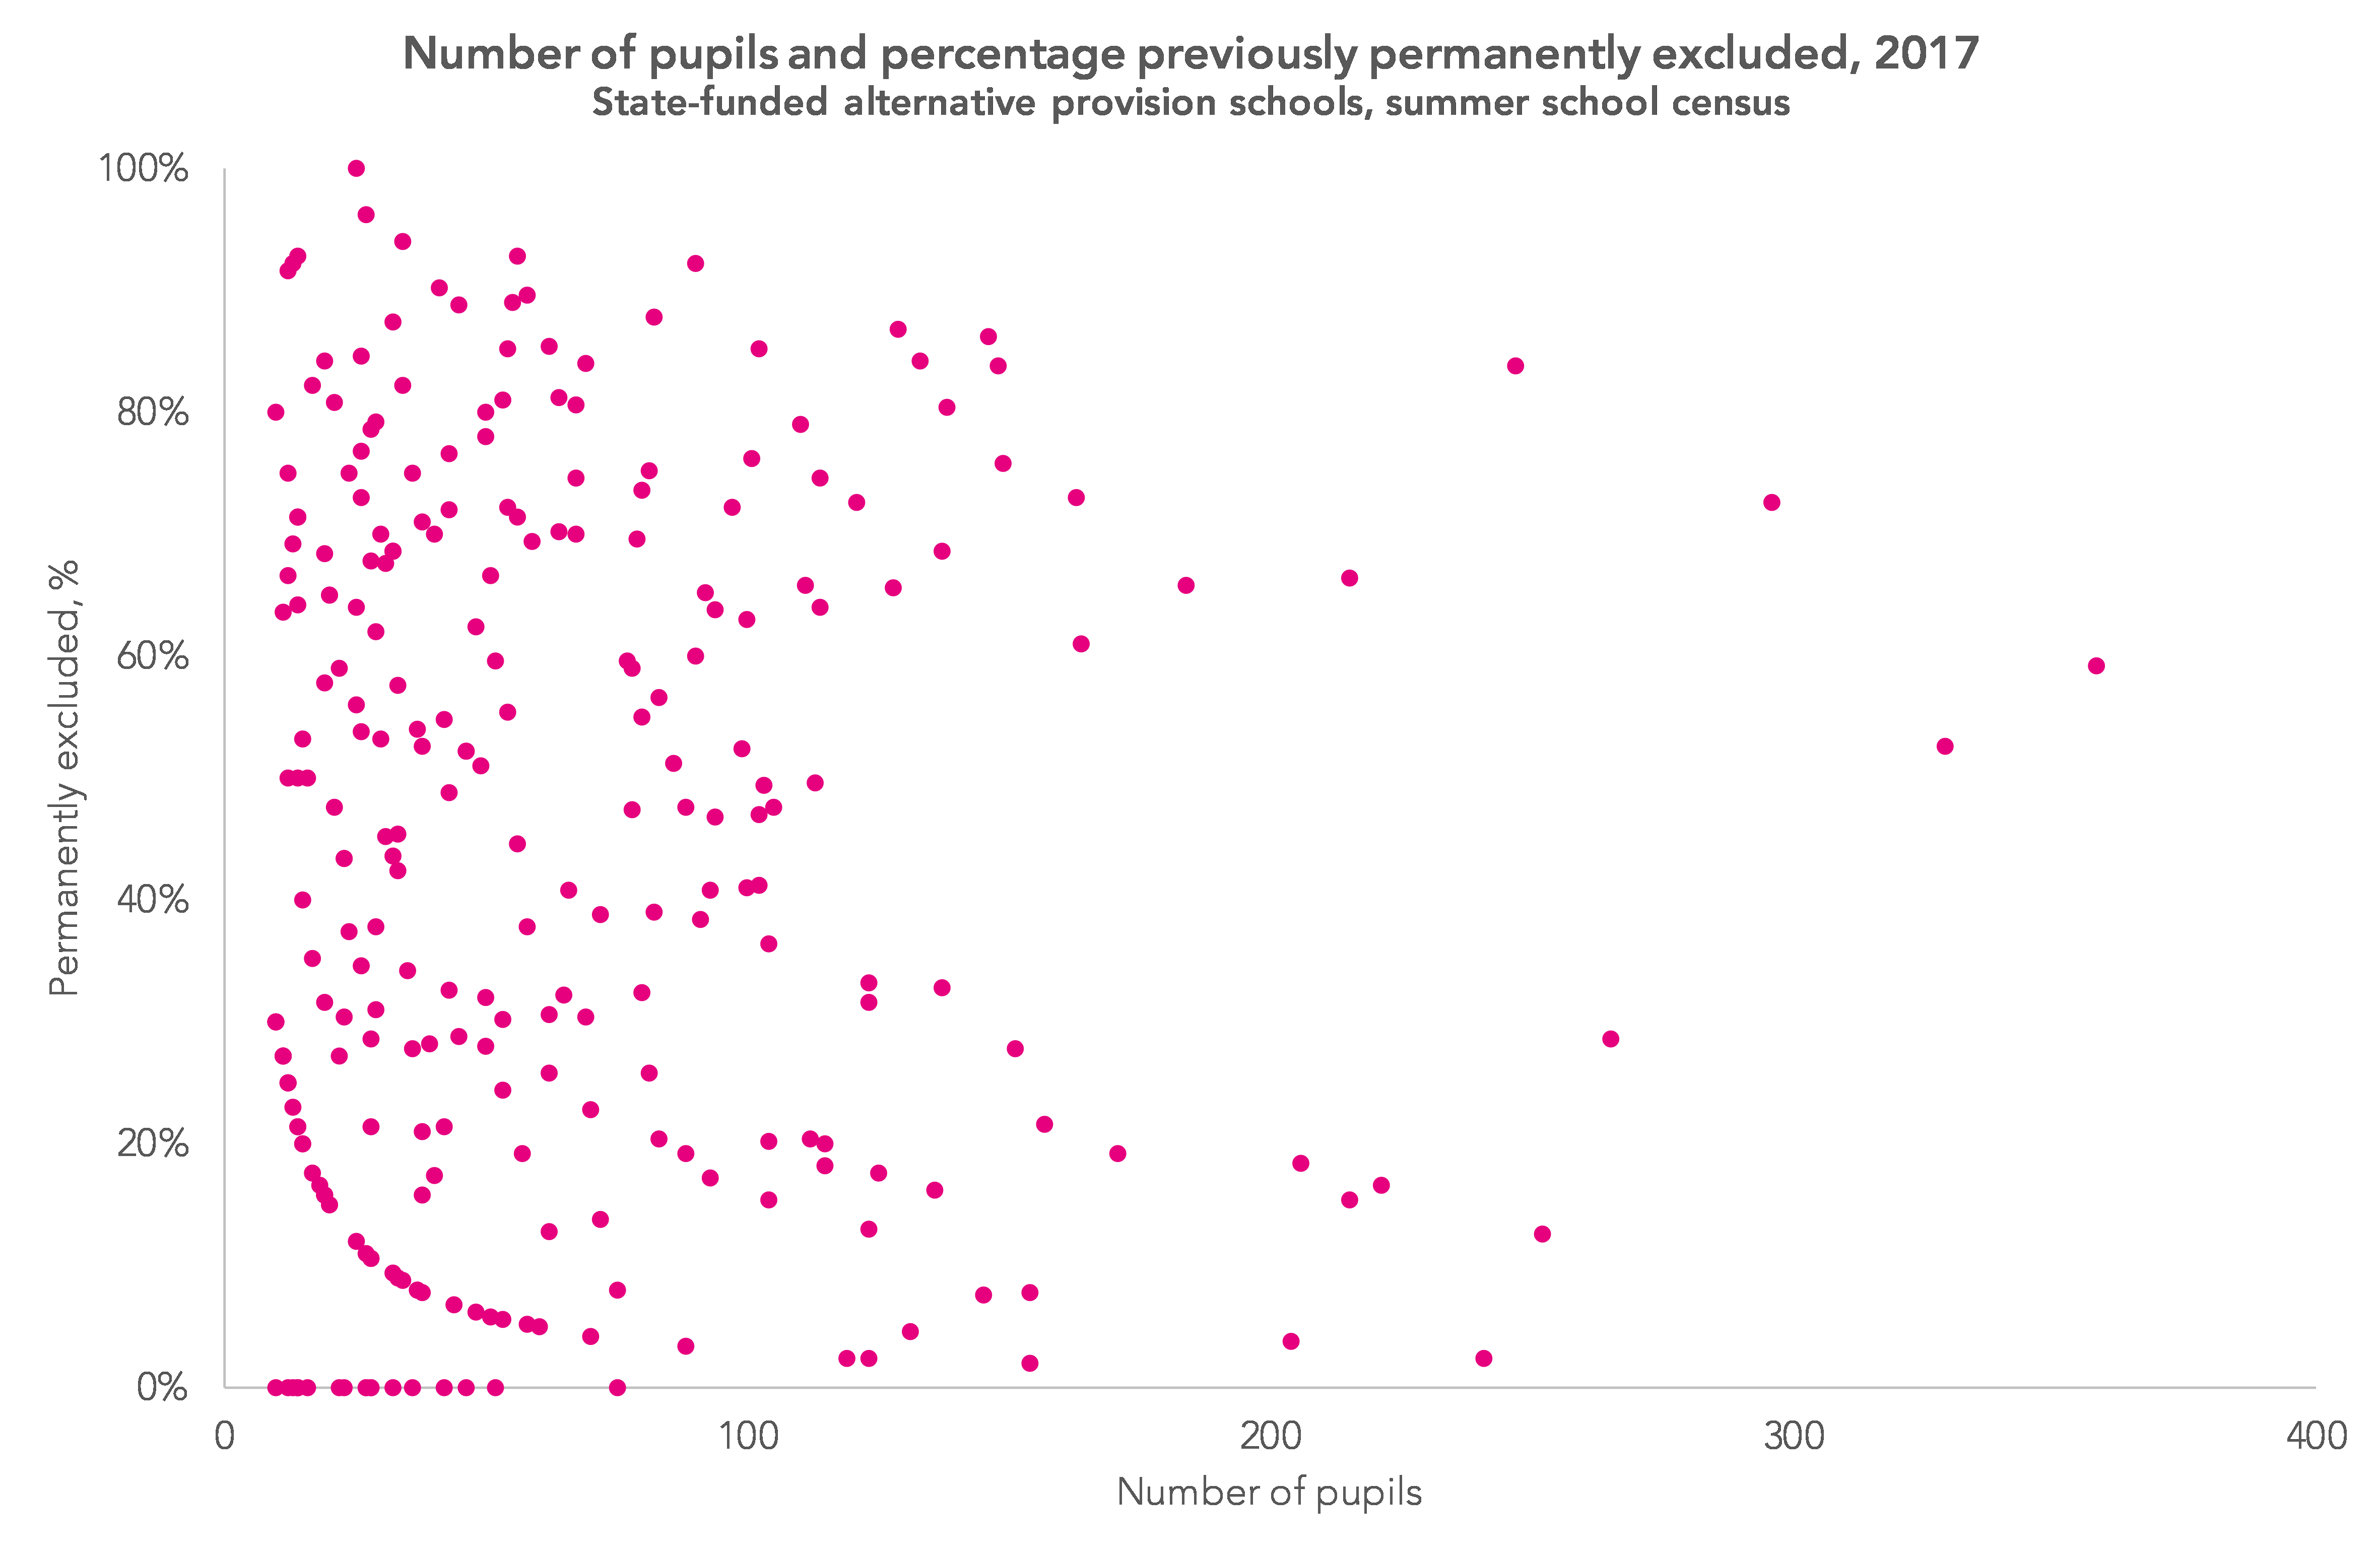
And at individual establishment level there is wide variation in the number of pupils who are enrolled and in the percentage who had been excluded, as the chart below shows.
Permanent exclusion is just one of many reasons why pupils attend state-funded AP schools. Other reasons include lack of a school place, school refusal and medical reasons (see here for a full list).
There is a lack of information at the national level about why pupils attend state-funded AP schools. Although the primary reason for placement is now collected in the alternative provision census [PDF], state-funded AP schools are not in its scope. They are required to submit school census returns instead.
If it is the intention of government to improve AP for different groups of pupils, such as those who have been permanently excluded, then better information is needed about the groups which different AP schools serve.
How do enrolment numbers in state-funded AP schools vary between regions?
We might also wonder how enrolment in state-funded AP schools varies nationally.
The chart below shows the number of pupils in Years 7 to 11 enrolled in state-funded AP schools per thousand Year 7 to Year 11 pupils enrolled in state-funded mainstream and special schools.
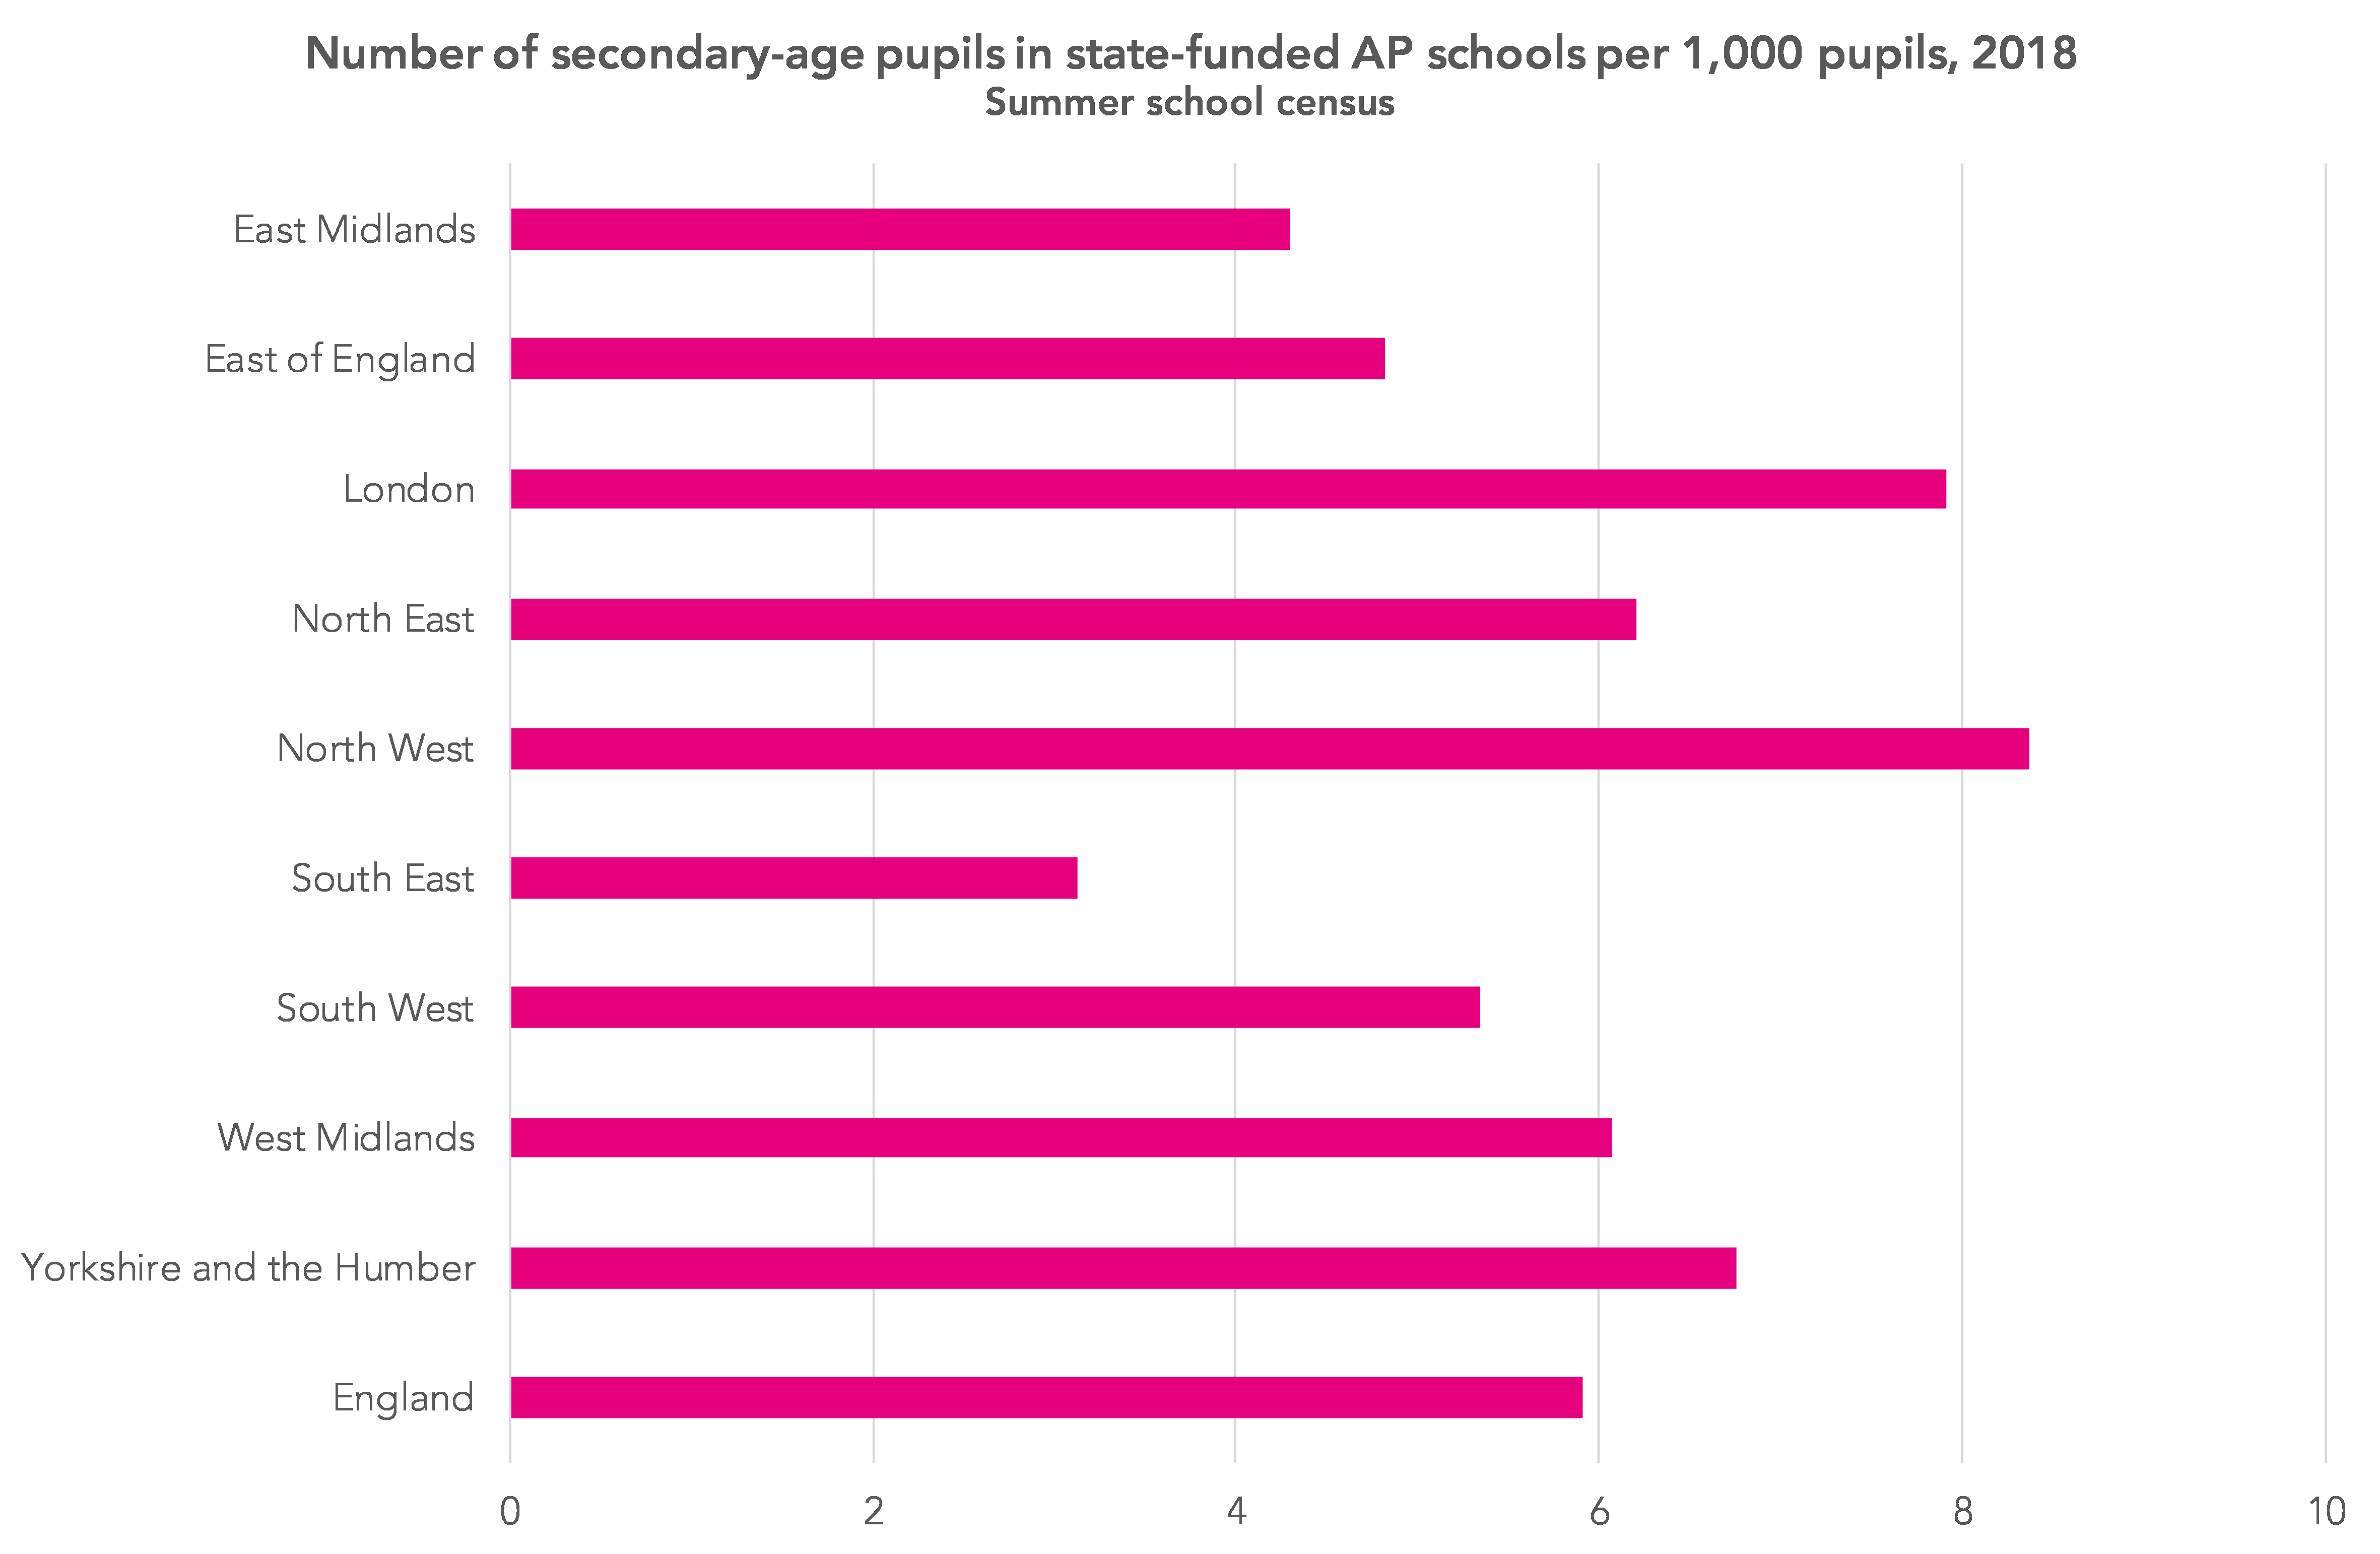
The rate of state-funded AP school enrolment in the north west and London is almost double that of the south east. The rate in the east Midlands is also relatively low. In part at least, this is explained by the mix of provision (state-funded and independent) seen locally – something that we will be returning to in later work.
Summarising this part then: state-funded AP schools vary in the percentage of permanently excluded pupils they have on roll and the number of pupils that are enrolled at any one time during an academic year. Rates of enrolment also vary in different parts of the country.
In the next part, I will look at the destinations of permanently excluded pupils.
Now read the second of this pair of blogposts – Timpson Review reflections, part two: Not all pupils who have been permanently excluded end up in alternative provision
Want to stay up-to-date with the latest research from FFT Education Datalab? Sign up to Datalab’s mailing list to get notifications about new blogposts, or to receive the team’s half-termly newsletter.
1. Pupil numbers are only shown from 2010, since this was the first year that pupil numbers were collected through the school census. Numbers for previous years are not comparable.
2. Indeed, DfE statistics show that there were 352 schools in 2018, although there was pupil enrolment data for just 329 in the school census. It is possible that the other 23 had no pupils with main registrations.
3. The higher pupil count shown here versus that in the first chart is explained by the numbers here being from the summer school census.


Leave A Comment