Following the recommendations of the Timpson Review, the government response and some of the resulting debate, I think it is worth clarifying the following two points:
- Not all pupils who end up in state-funded alternative provision schools have been permanently excluded
- Not all pupils who have been permanently excluded end up in state-funded alternative provision schools
In the first of this pair of blogposts, I looked at pupils on roll in state-funded alternative provision. In this part, I will look at the Year 11 destinations of permanently excluded pupils and the outcomes they achieve.
Year 11 destinations
To explore this, we’ll track five cohorts of pupils who enroll at state-funded schools in autumn of Year 7 all the way through to the end of Year 11 using the National Pupil Database (NPD). These pupils started Year 7 between 2009 and 2013 and reached the end of Year 11 in 2014 to 2018.
Over 21,000 pupils are observed to have been permanently excluded. We do not have any exclusions data for 2017/18 and so the numbers for the 2018 Year 11 cohort are under-reported. We also know that there is a small degree of under-reporting of exclusions in the NPD due to closed schools not submitting data for their final two terms, as mentioned in the first of these posts.
The table below shows where these excluded pupils were enrolled in the January of Year 11.[1]
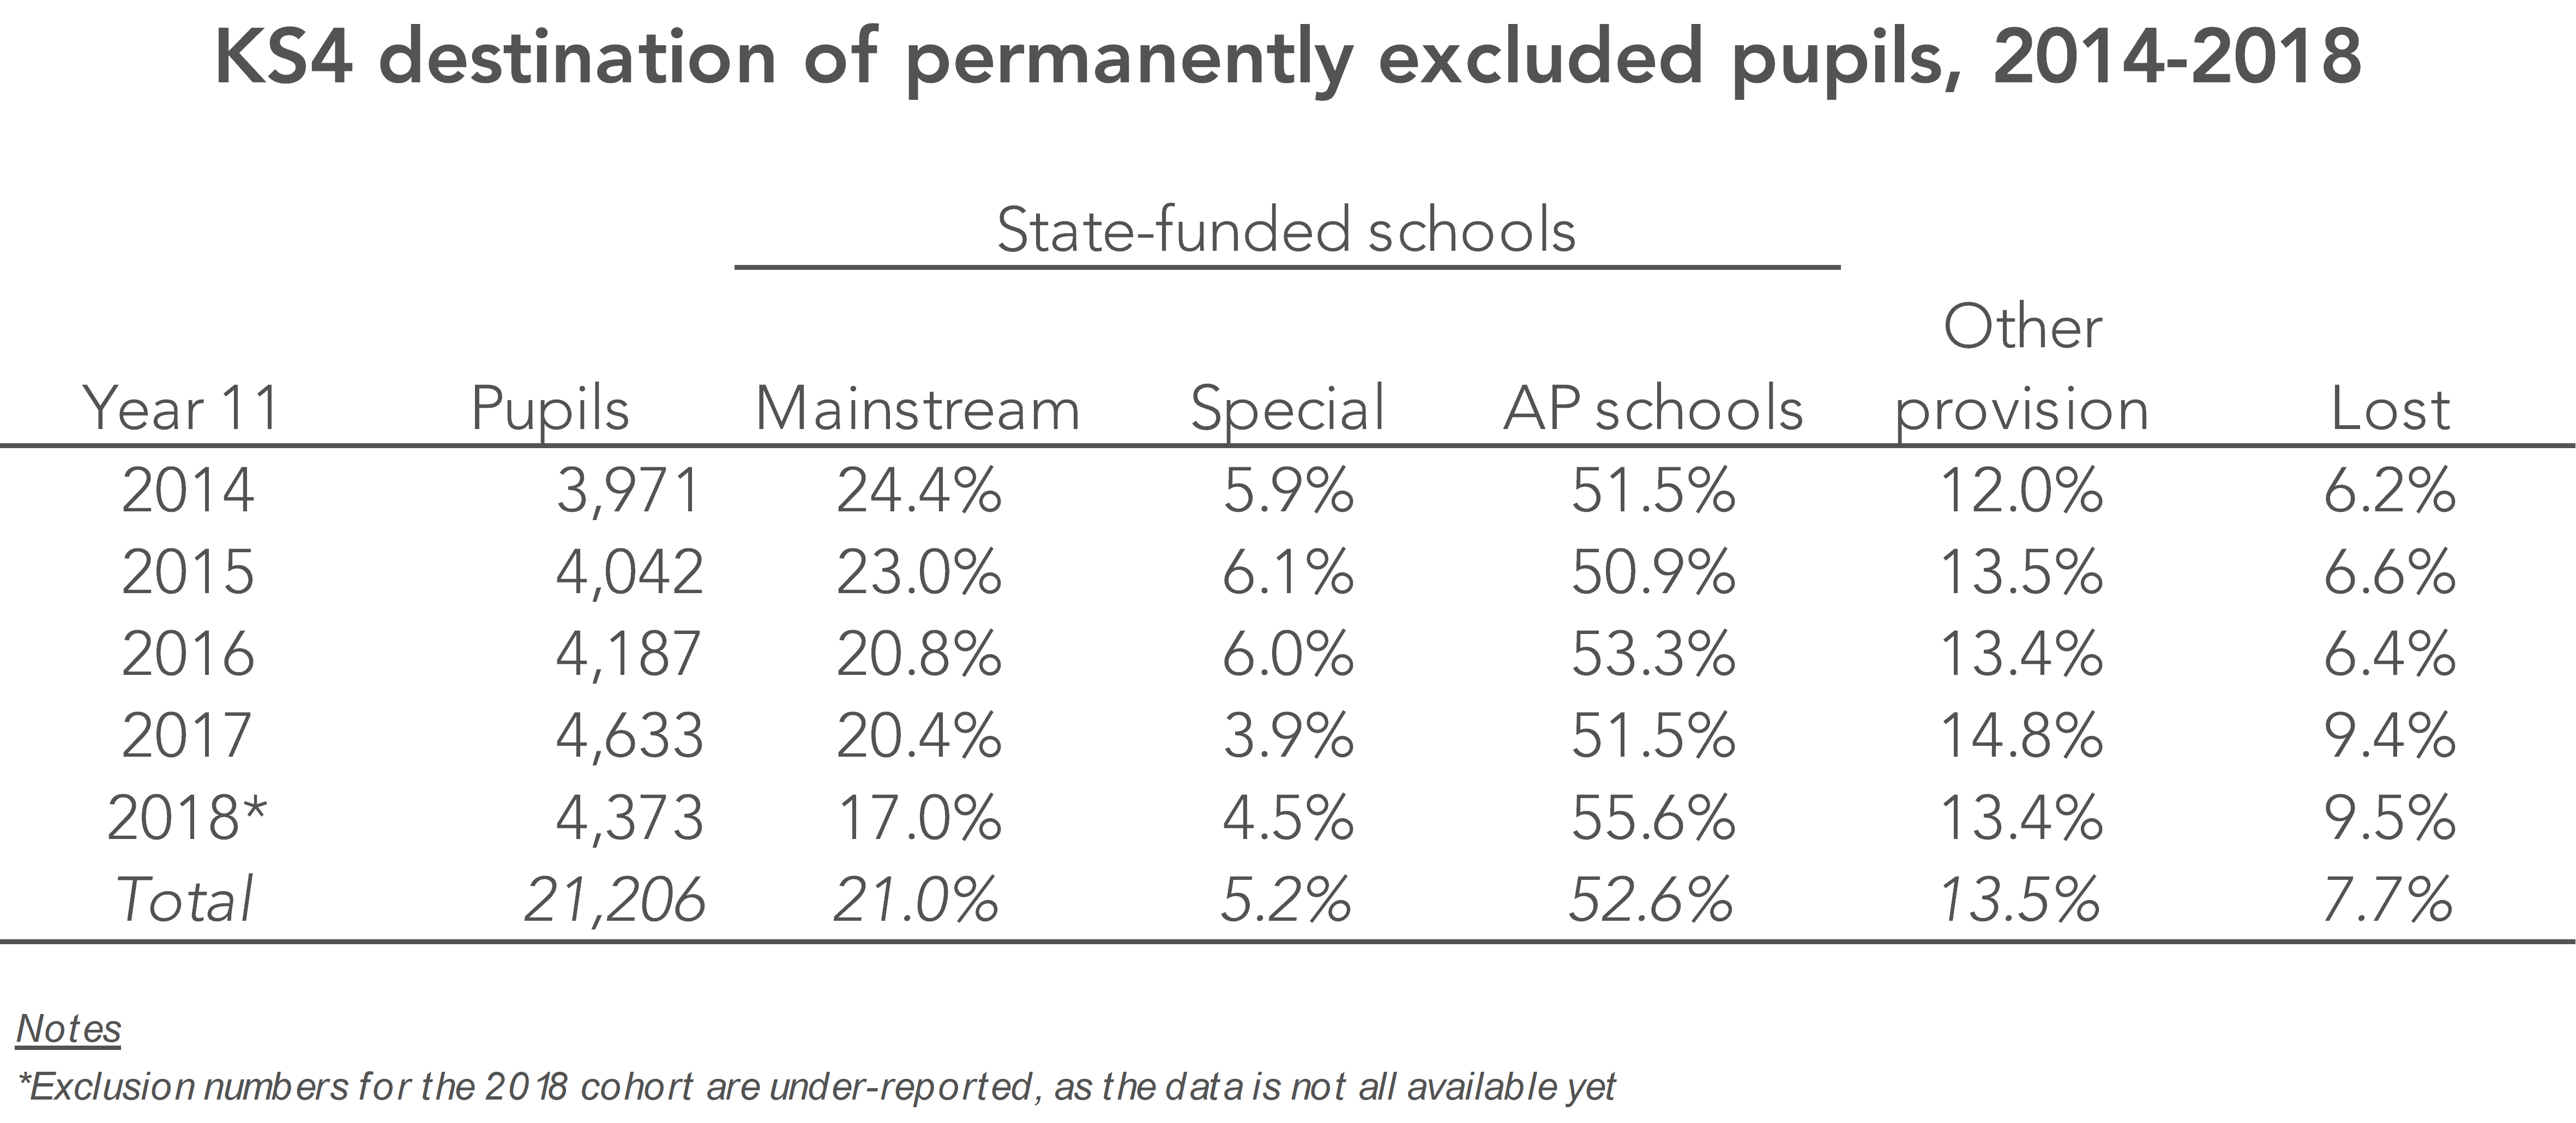
Just over half of the pupils completed their compulsory education in state-funded AP schools, and just over a quarter were attending other state-funded schools (either mainstream or special).
A further 13.5% of excluded pupils were in other provision. This will include alternative provision in the independent sector. We had a go at estimating the number of young people accessing such provision here. However, we are aware that there are many other independent alternative providers offering part-time provision only. There is a paucity of national information about the numbers of pupils accessing this sort of provision.
The ‘lost’ pupils do not appear to be on roll anywhere, a subject we’ve touched on previously. This will include any pupils who have died or emigrated and those being home educated.
Interestingly, around one-in-five of these ‘lost’ pupils, who were not on-roll anywhere in January of Year 11, then appeared on the roll of a state-funded school in the summer of Year 11. There may have been timing issues, but equally there may have been a reluctance for schools to admit pupils earlier due to fears about them being included in performance tables measures. Any pupil excluded in Year 10 or later but taken on by another school would not be counted.
Although only around half of excluded pupils complete Year 11 at a state-funded AP school, around 85% attended one at some point between being excluded and reaching the end of Year 11.
Outcomes
The Timpson Review confirmed that the attainment outcomes of permanently excluded pupils were poor, reporting that 7% of permanently excluded pupils achieved good passes in English and maths GCSEs.
Correctly, it cautioned that excluded pupils may have other characteristics that lead to poor outcomes and that exclusion may not be the root cause of low attainment.
I doubt that it is possible to estimate the effect of exclusion on attainment using observational data. I cannot think of a way in which we could approximate an experiment in which a set of pupils are excluded and another set are not.
What we can do is statistically match[2] pupils who are permanently excluded during Years 7 to 11 to similar pupils based on their characteristics and dispositions at the start of Year 7.[3] Key Stage 4 outcomes for excluded pupils are then compared to their statistical matches. This will not provide causal estimates of the impact of exclusion, but it will provide a sense of the sorts of outcomes achieved by pupils who were otherwise similar at the start of secondary school.
The chart below shows the Attainment 8 measure, including all pupils, even those without Key Stage 4 data.[4]
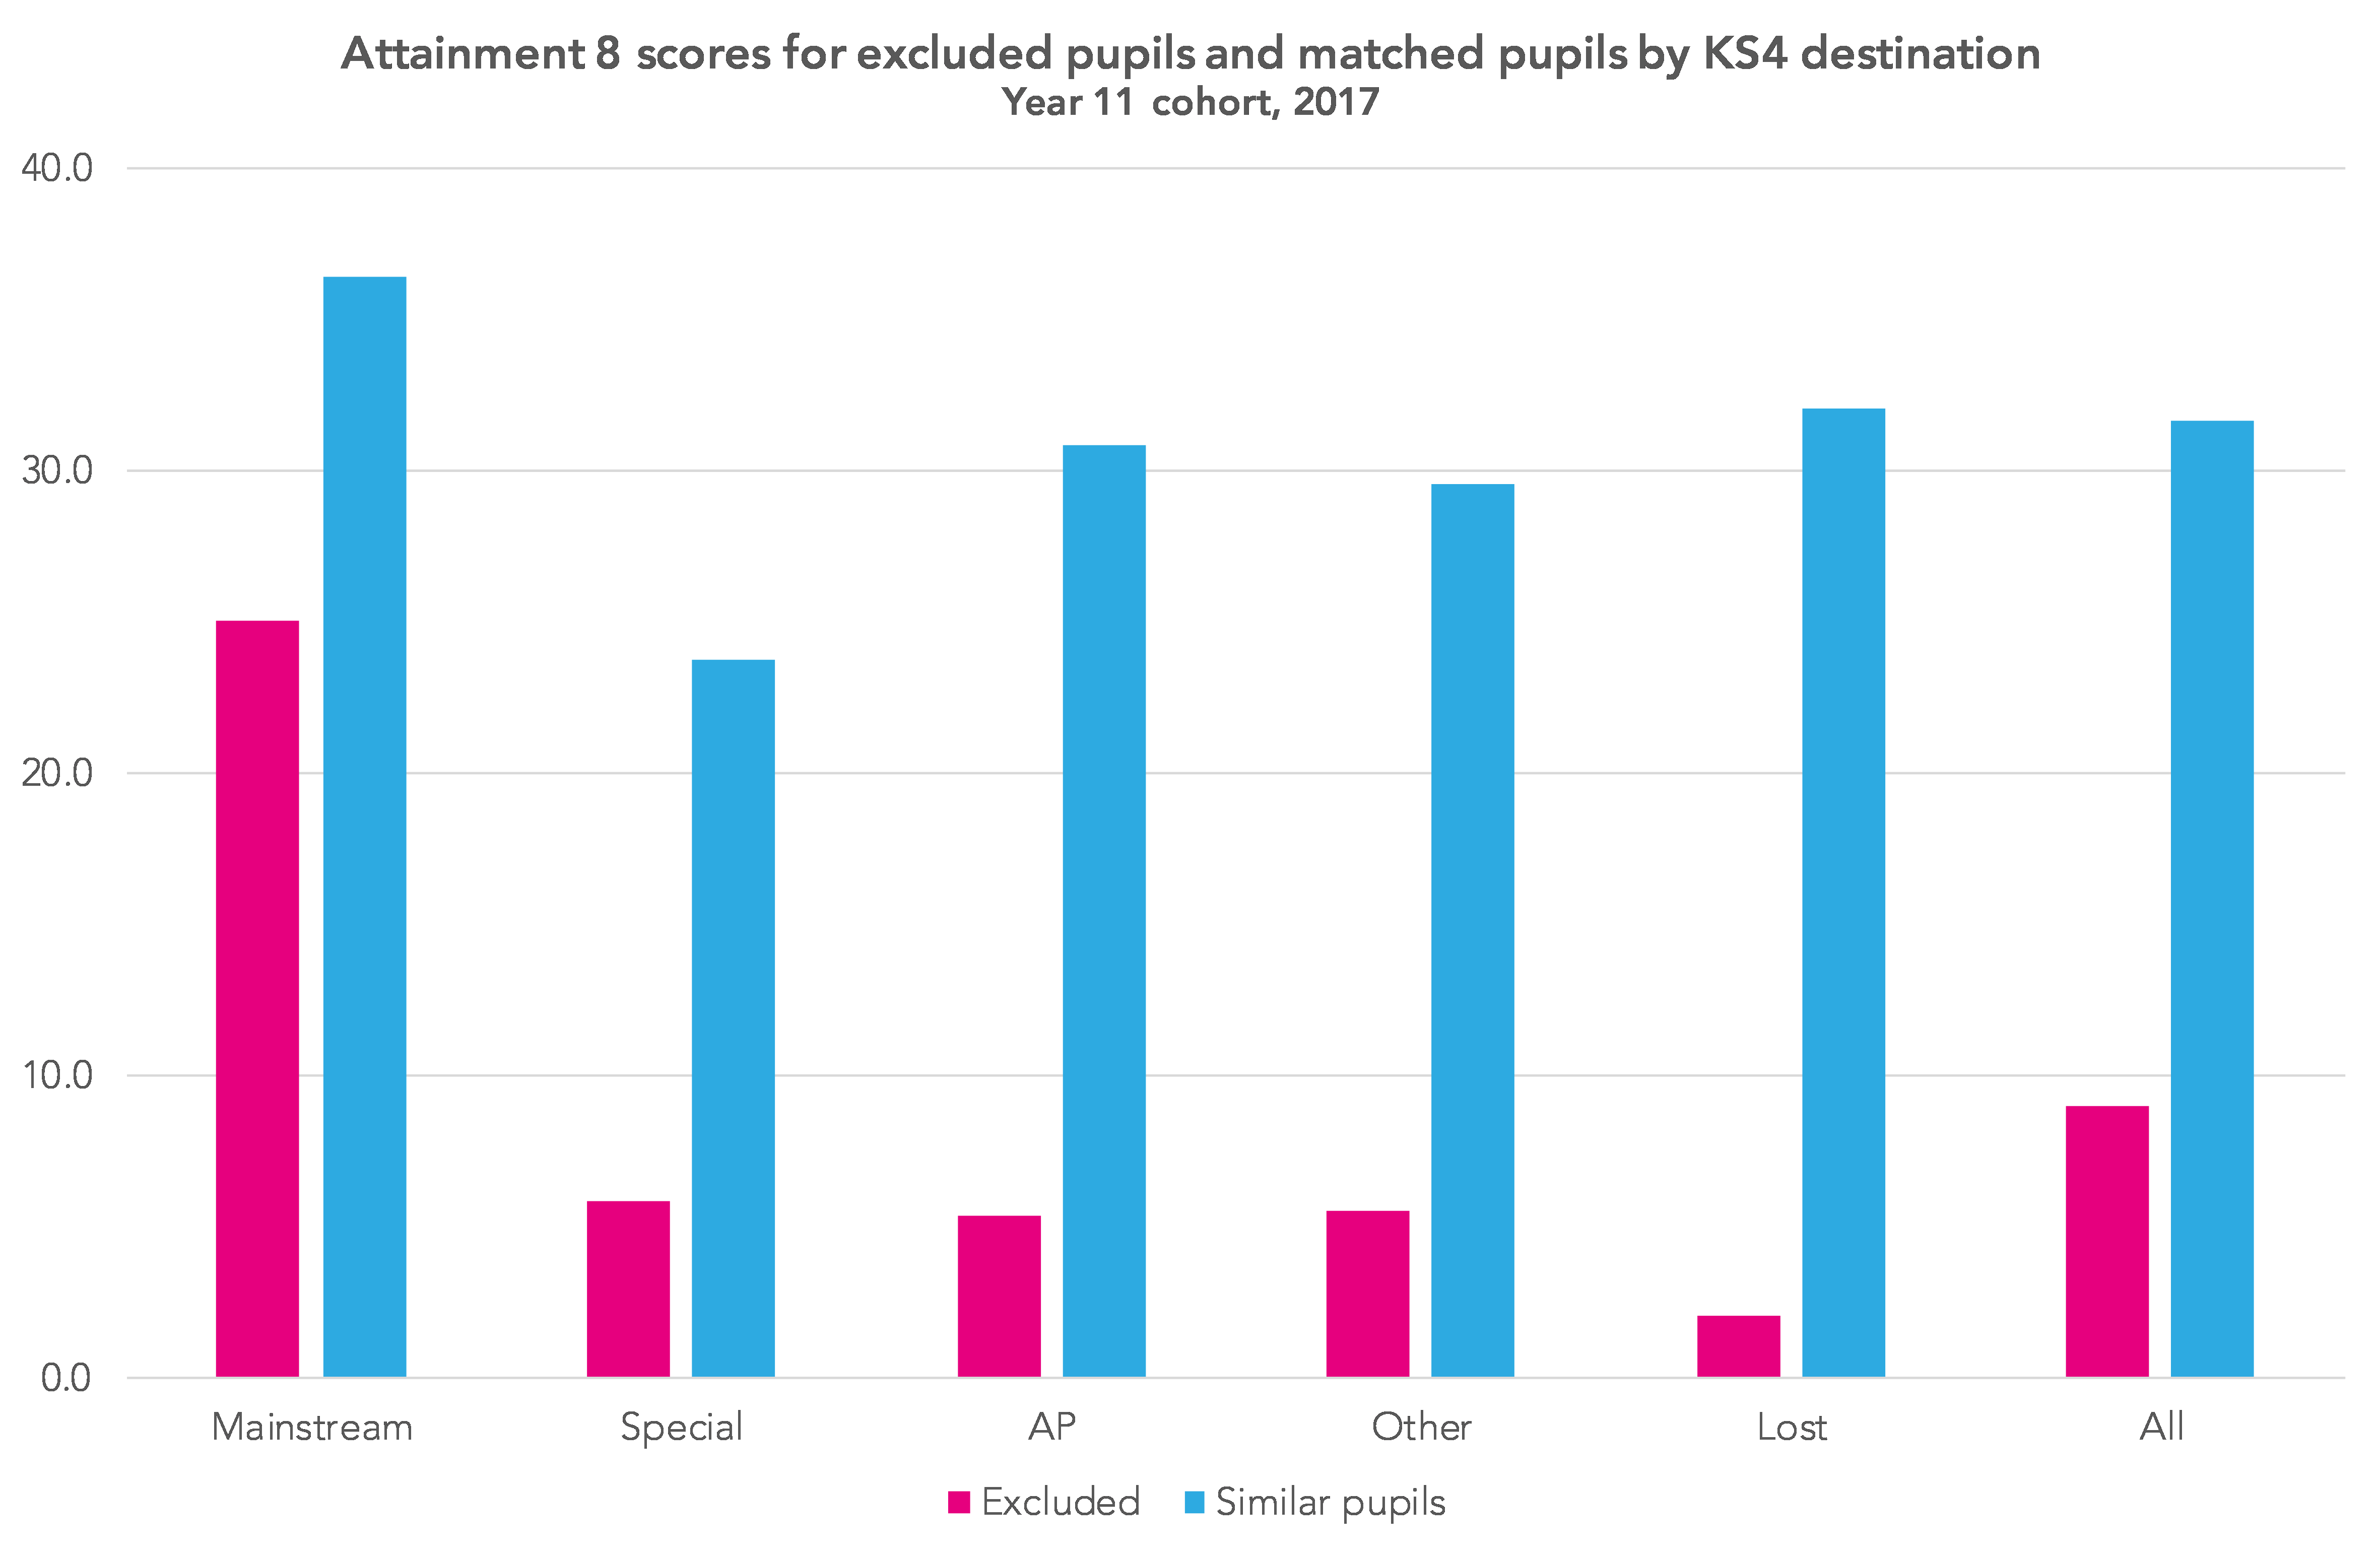
As would be expected, the Attainment 8 scores of excluded pupils were far lower than those of the pupils who were similar to them at the start of Year 7, regardless of where the pupils ended up in Year 11.
The overall Attainment 8 score of the similar pupils – 32 points; see the ‘all’ group shown in the chart – was itself well below the national average for state-funded schools in 2017 (46.3), which points towards the fact that excluded pupils face multiple disadvantages. Indeed, the combined set of similar pupils achieved a Progress 8 score of -0.6.
Versus other Year 11 destinations, excluded pupils who complete Year 11 in mainstream schools tended to achieve higher Attainment 8 scores.
This is perhaps unsurprising for two reasons. Firstly, they may well have had less complex needs than other excluded pupils. Secondly, mainstream schools tend to have curricula that are more aligned to Attainment 8.
If schools are to retain accountability for excluded pupils and Progress 8 is to remain the headline accountability measure then there will be a stronger incentive to find places for excluded pupils in mainstream schools. Whether this is the right decision is another question, of course.
Regardless, for this to happen, I suspect the right levels of support will need to be in place. Most excluded pupils will have additional needs, and other analysis we have recently carried out suggests that mainstream schools are becoming less, not more, likely to take them on.
Want to stay up-to-date with the latest research from FFT Education Datalab? Sign up to Datalab’s mailing list to get notifications about new blogposts, or to receive the team’s half-termly newsletter.
1. This uses a combination of the school census, the alternative provision census and end of Key Stage 4 data.
2. Pupils are matched exactly on ethnicity, gender, highest special educational needs status at primary school, absence in Years 5 and 6, and whether excluded (permanent or fixed-term) while at primary school. They are then propensity-score matched on KS2 attainment, free school meals (FSM) history, IDACI score of neighbourhood, region and school characteristics (%FSM, mean KS2 and KS4 performance). Pupils who start Year 7 in middle schools are not included.
3. We could try to statistically match pupils who are permanently excluded with those who are not on the basis of characteristics and behaviour at the point of exclusion, for instance using characteristics known to be associated with exclusion (ethnicity, special educational needs, gender) and dispositions (absence, number of fixed-term exclusions, current levels of attainment).
However, dispositions might be affected by school attended. Some schools may be more effective at minimising the risk of absence and exclusion.
4. They are assigned an Attainment 8 score of 0.


Leave A Comment