If you’re a regular reader, you’ll probably know that I’m interested in the subject choices that pupils make. But one thing I don’t get into quite so often is why they make those choices.
Of course, subject choice can be influenced by all sorts of things, but today I’m thinking about just one possible influence: school policy and culture. Or rather, trust policy and culture.
I’m going to take a look at public data on entries to KS4 subjects last year broken down by trust to try and unearth whether some trusts encourage their pupils to enter particular subjects. And also whether some trusts manage to beat the odds and enter a high proportion of their pupils to GCSEs in languages – something that’s proved tricky to achieve at the national level – or triple science GCSE.
I’ll restrict this analysis to large trusts. For this analysis, this means trusts with at least ten schools with 2023 Key Stage 4 results. We haven’t made any adjustments for schools that have recently joined a trust.
And as we can’t cover every subject here, we’ve put the data we’ve used into an annex.
Popular GCSE subjects
I’m going to start by looking at some subjects that are far more popular in some large trusts than they are nationally.
While we can’t say for sure why entry numbers are so much higher in these trusts, it certainly seems possible that that the trusts, or perhaps some individual schools within the trust, have a policy of encouraging pupils to enter these subjects.
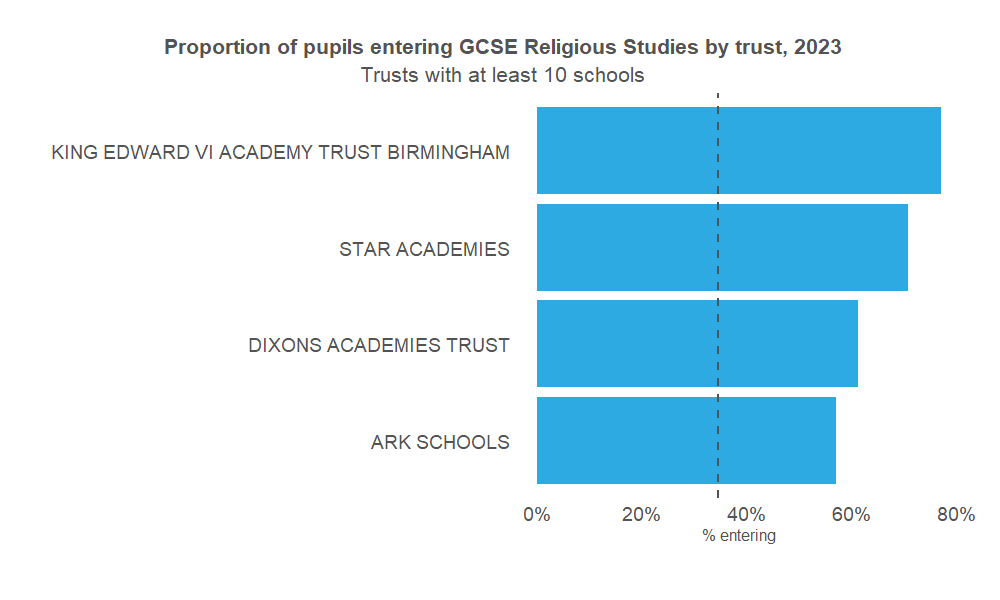
One such subject is religious studies. Nationally, just over a third of pupils take a GCSE in the subject, but in a small number of trusts, the proportion is well over half. The dotted line shown on the chart represents the national average.
Another interesting one – at least for me as a statistician – is GCSE statistics. It’s pretty obscure nationally, taken by less than 5% of pupils, but in a handful of trusts it’s far more common.
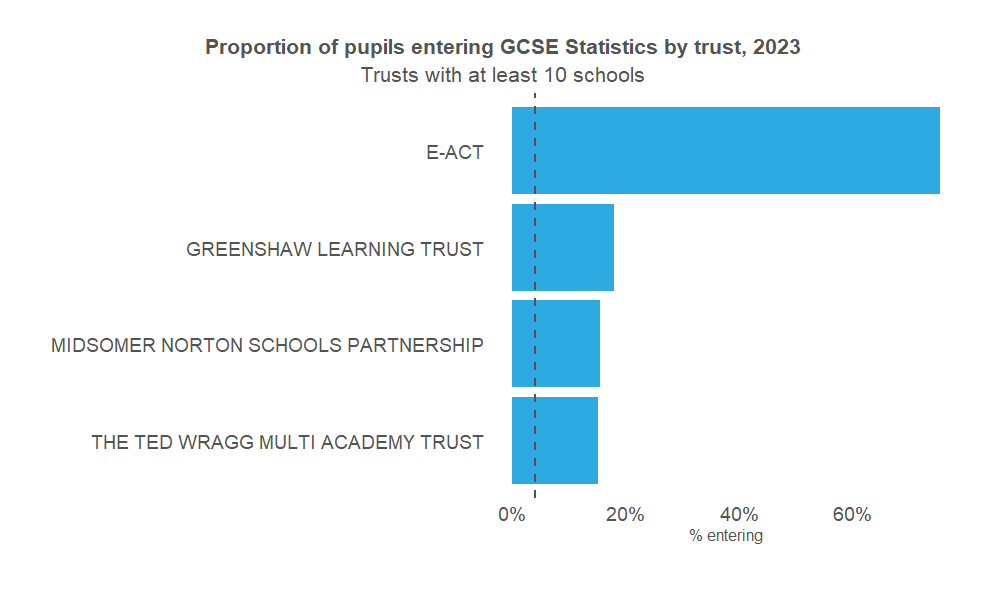
A particular friend to the statisticians is E-ACT, in which three-quarters of pupils take GCSE statistics.
And finally, art and design subjects.[1] This group of subjects are taken by around 28% of pupils nationally, but in some trusts the figures are far higher.

Other Level 2 qualifications
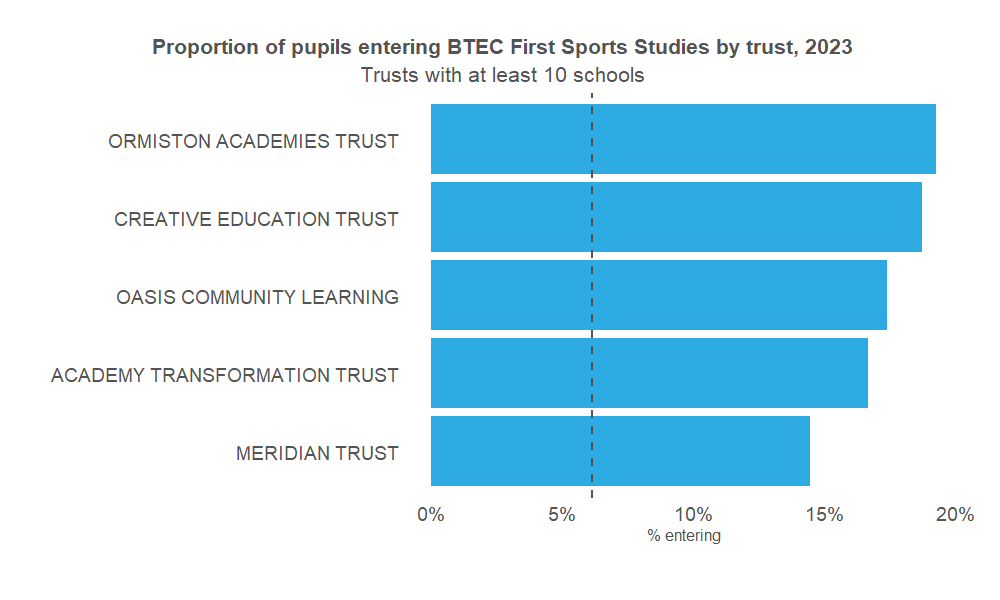
Other Level 2 qualifications tend to be taken by far fewer pupils than GCSEs at KS4; the most popular Level 2 qualification, the BTEC Technical Award in Health Studies, is taken by just 7% of pupils nationally.
And this is also true within trusts. While some other qualifications are more popular within some trusts than they are nationally, the proportions taking each individual qualification are still fairly low.
So it may not be the case that trusts have a policy of encouraging pupils to take these qualifications; rather, it may be that these qualifications are suited to a higher proportion of pupils within the trust in question than they are to pupils nationally.
Qualifications that are particularly popular within some trusts include the Cambridge National Certificate in Creative iMedia, the BTEC First Award in Sports Studies, and the Cambridge National Certificate in Small Business Management


Languages
Now we’re going to turn to languages. And I imagine a lot of schools would like to increase the proportion of pupils studying languages (or even offer languages at all) but struggle for a number of reasons – not least the shortage of language teachers and harsher grading for languages GCSEs.
As things stand, less than half of pupils nationally take a language GCSE. But some large trusts are bucking the trend.
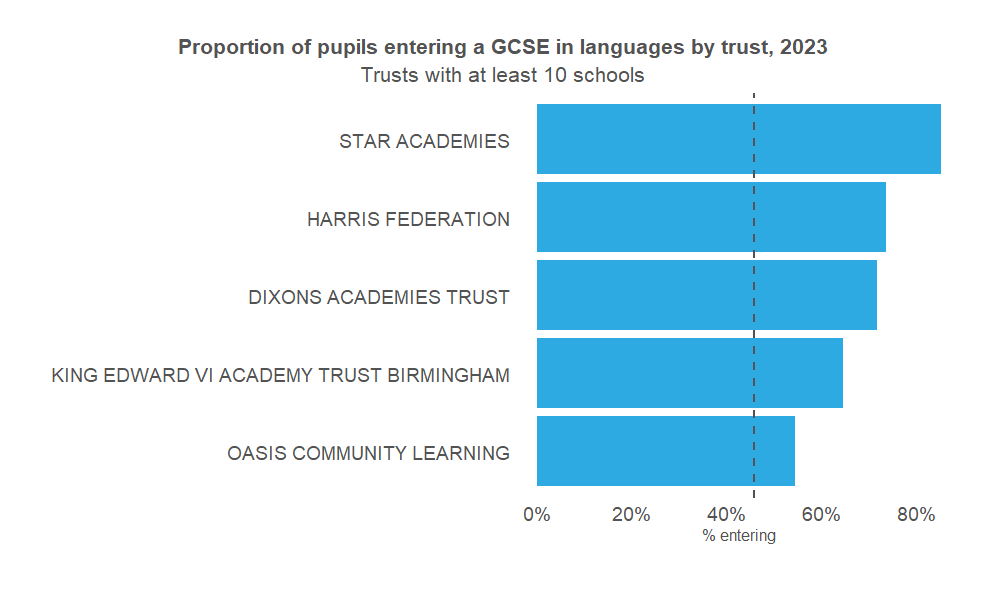
Sadly, we can’t tell just from looking at the data what the secret of their success is, but one thing we can do is look at how the entries break down by subject.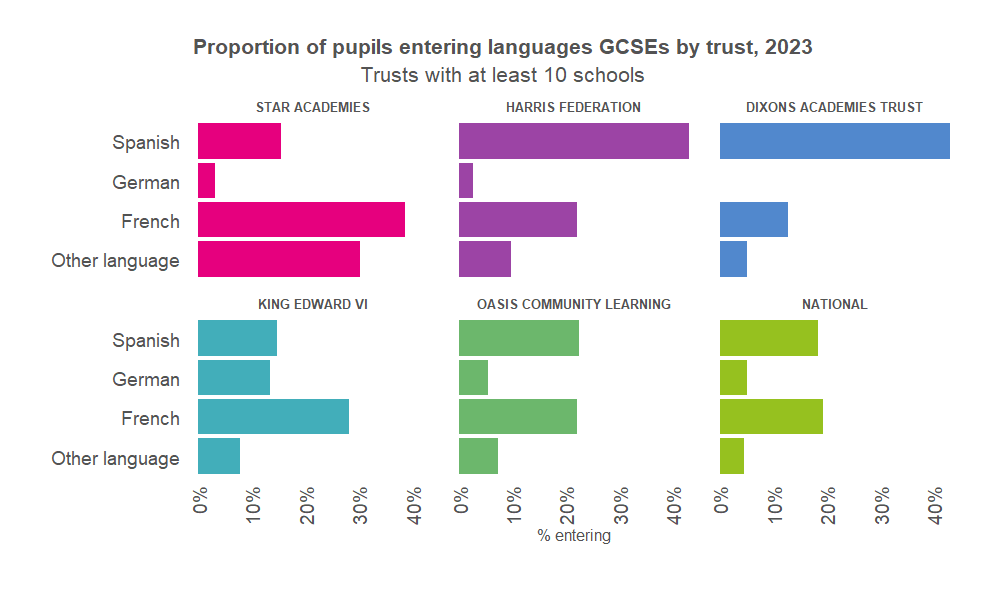
The picture here is mixed. Some trusts have a far higher proportion of pupils entering the most popular language, Spanish, but little difference in the other languages. Others have an average or below average proportion of entries in Spanish, but more entries in other languages.
Science
Now to one of my favourite subject areas: science. And there’s scope for some interesting differences here when we look at the numbers taking double vs triple science.[2]
Nationally, just over a quarter of pupils take single science GCSEs in the three main subjects: biology, chemistry and physics. Around 13% take GCSE computer science.
This varies hugely at school level. As part of some work for the Gatsby Foundation a while back we found that around 8% of schools had no pupils taking triple science at all, while 5% entered at least three-quarters of their pupils.
So are there similar differences at trust level?
Well, certainly nothing so extreme among the large trusts. In most of the large trusts, a lower proportion of pupils enter triple science than nationally.
But this is probably more to do with prior attainment than anything else. Triple science tends to be an option taken up by pupils with higher levels of prior attainment. And pupils in large trusts tend to have lower levels of prior attainment than pupils nationally.
But two trusts stand out. In the first, King Edward VI Academy Trust Birmingham, an impressive 55% entered triple science GCSE, which may at least partly reflect the trust’s high attaining intake: 54% of pupils had high prior attainment at primary, compared to just 23% nationally.
The second, Meridian Trust, also had triple science entries well above the average at 38% of pupils. But in this trust, just 19% of pupils had high prior attainment at primary.
What have we learned?
It looks as though some trusts may be following a policy of encouraging pupils to take some GCSEs, including religious studies, statistics and art and design.
We’ve also seen that some trusts buck the trend in terms of entries to languages at GCSE, and others enter a surprisingly high proportion of their pupils to single science GCSEs. And they may have some useful knowledge to share on how they pulled it off. With the proportion of pupils entered for triple science set to become a headline performance measure next year, this could be particularly useful.
Of course, all I’ve done here is look at the data and make some guesses. I’d love to hear from readers who are involved in trusts and who can let me know if any of these deductions from the data chime with their experience.
Want to stay up-to-date with the latest research from FFT Education Datalab? Sign up to Datalab’s mailing list to get notifications about new blogposts, or to receive the team’s half-termly newsletter.
[1]: I have grouped together a number of art and design subjects here. These are: Art & Design, Art & Design (3d Studies), Art & Design (Critical Studies, Art & Design (Fine Art), Art & Design (Graphics), Art & Design (Photography) and Art & Design (Textiles).
[2]: In case there’s any room for confusion, by ‘double’ I mean combined science GCSE and by ‘triple’ I mean taking three separate GCSEs in science subjects, usually biology, chemistry and physics.


Really interesting read. I do work with one of these trusts. I’d be interested in seeing the larger data set, and exploring science in particular with you more.
Great read – any chance you’d be willing to share the data so I can look closer, I work with one of the trusts identified.
Hi Sam, glad you enjoyed it! We stuck a copy of the trust level dataset that we put together in the post as an annexe, you should be able to download it here. (We created the dataset by mashing together school level data from this site and trust level data from this site.)