This week sees the launch of a much requested feature in FFT Aspire’s Attendance Tracker for Welsh secondary schools – the ability to analyse persistent absence by pupil group. This will allow you to compare persistent absence rates for key groups in your school such as gender, disadvantage, and special educational needs status.
To mark the occasion, we’re going to take a look at how persistent absence varied by pupil group last academic year.
Aspire Attendance Tracker
Schools can track, analyse and compare their attendance data against 1,000s of other FFT schools using Aspire Attendance Tracker.
Log in to Aspire to access Attendance Tracker – log in here.
Not an FFT Aspire user? Learn more here.
The data
As usual, we’ll be using data from Attendance Tracker, which covers around 130 secondary schools in Wales.
And we’ll be defining persistent absence as the percentage of pupils who missed a particular percentage of their possible sessions. This is different from the definition previously used by the Welsh government[1], which specified a threshold number of sessions (60) rather than a proportion. 60 sessions is equivalent to 20% of sessions for the average pupil, though is due to be reduced to 10% in a drive to identify pupils with attendance problems more quickly.
Persistent absence overall
Firstly, let’s see how many pupils were persistently absent last year overall. We plot the proportion who missed at least 10%, 20% and 50% of sessions. These thresholds are equivalent to a day off every two weeks, a day off a week, and a week off every two weeks, respectively.

Overall, 44% of pupils missed at least 10% of sessions, 19% missed at least 20%, and 6% missed at least 50%.
The 19% who missed at least 20% of sessions is slightly higher than the Welsh government’s persistent absence figure for last year of 16.3%. That’s because our figure includes pupils who missed 20% of their possible sessions but did not miss more than the Welsh Government’s threshold number of sessions, mostly because they were enrolled for a shorter amount of time than a typical pupil[2].
Plotting the same data but breaking it down by year group:
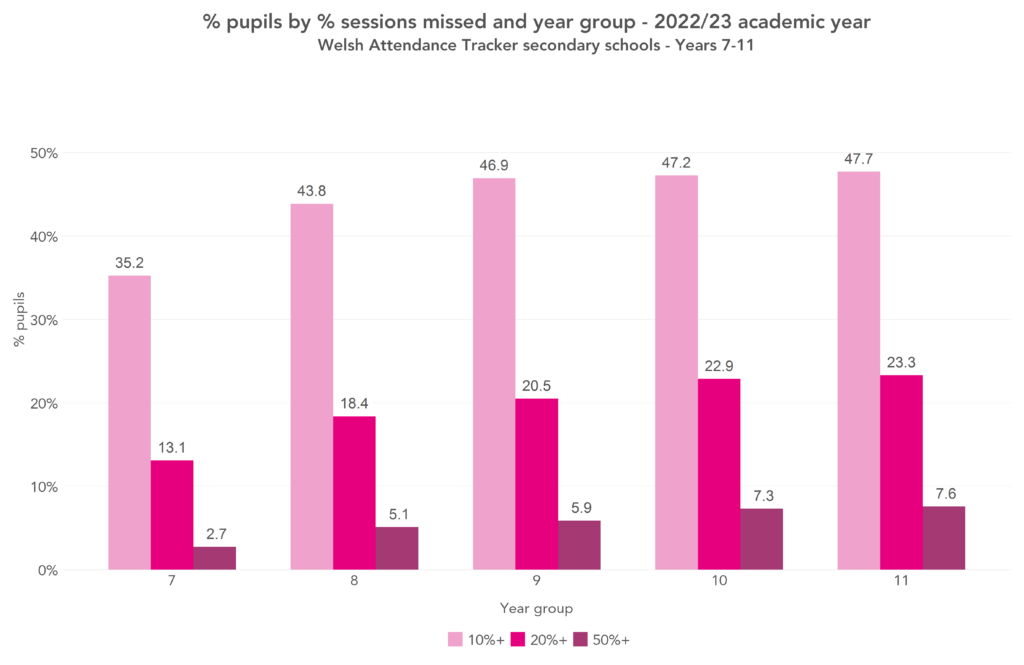
Persistent absence was much more common among older pupils than younger. For example, while 13% of Year 7 pupils missed at least 20% of sessions, this was true for 23% of Year 11 pupils.
Persistent absence by disadvantage and SEN
Persistent absence also varies substantially by disadvantage and by SEN/ALN (special educational needs and disabilities / additional learning needs) status.
Plotting persistent absence by SEN/ALN status[3]:

Pupils who had a Statement of need under the old SEN framework had slightly higher rates of persistent absence than those who had no SEN/ALN. The highest rates, though, were among the group of pupils who were supported under the old framework by School Action or School Action Plus, or had a school or local authority IDP (individual development plan) under the new ALN framework.
The same plot for disadvantage, as measured by having ever been eligible for free school meals (ever FSM):
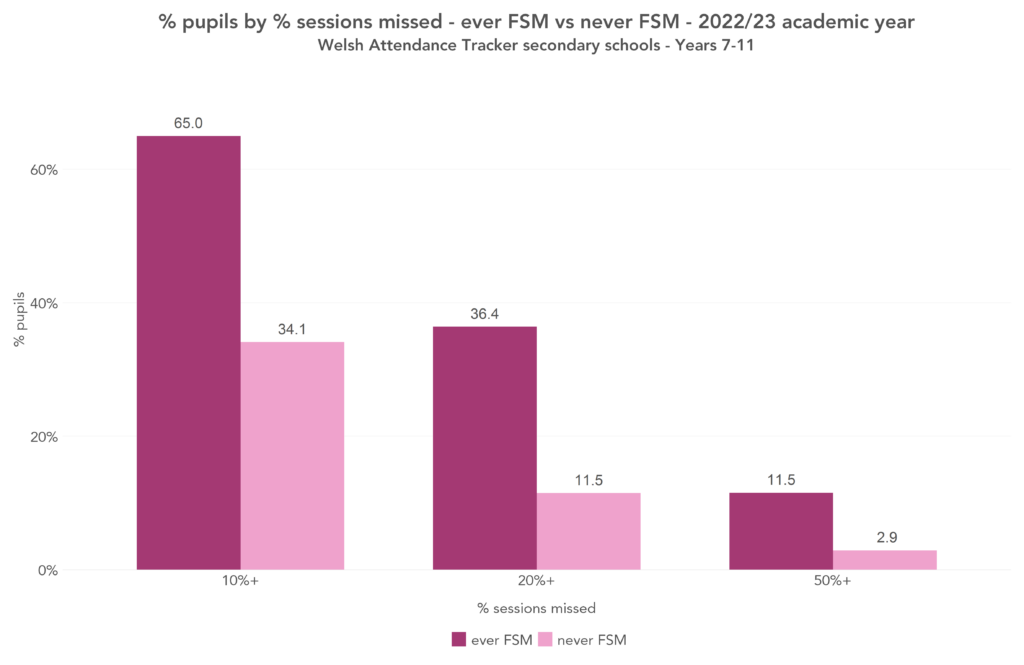
Disadvantaged pupils were much more likely to be persistently absent than others, particularly at the higher thresholds. For example, one in nine disadvantaged pupils were absent more often than they were present (missed at least 50% of sessions) compared with one in thirty-five non-disadvantaged pupils.
Persistent absence by school
Let’s move on now to look at how school-level rates of persistent absence varied across the country. Below, we plot the proportion of schools where up to 10% of pupils were persistently absent, between 10 and 20% of pupils, between 20 and 30% of pupils, and so on. Here, we define persistent absence as having missed at least 10% of possible sessions.
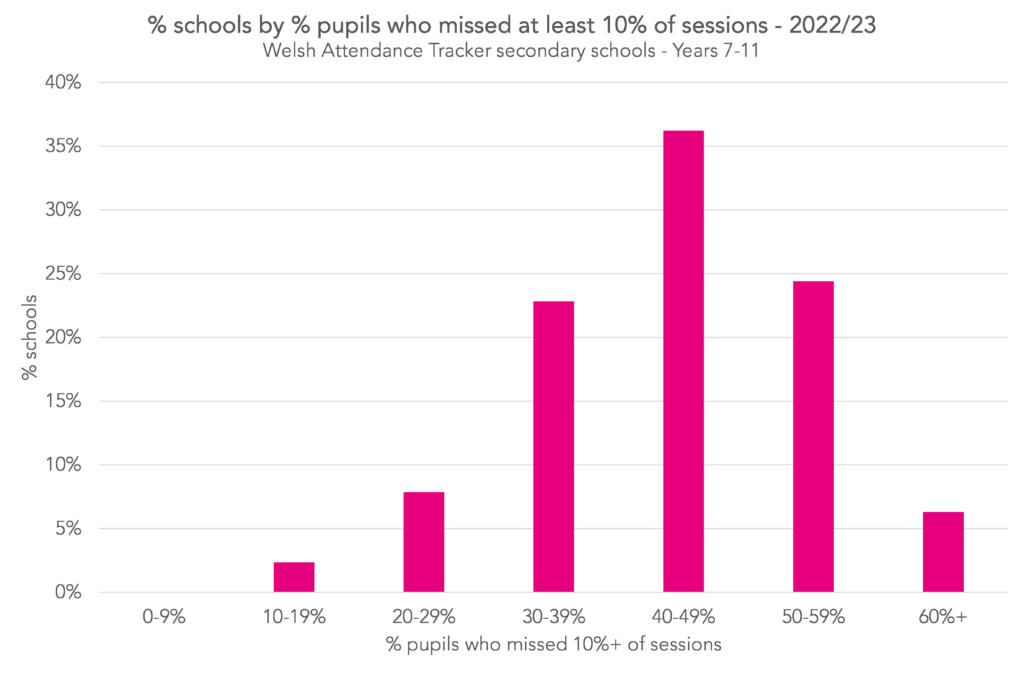
The most common grouping (35% of schools) was 40-49% of pupils persistently absent. A further 24% of schools had persistent absence rates of 50-59%, and 22% had rates of 30-39%. No schools had fewer than 10% of pupils persistently absent.
Persistent absence by school and disadvantage
To finish, we’ll see how the distribution of schools by their persistent absence rates is impacted by the proportion of disadvantaged pupils they had on-roll.
To do this, we divide our schools into three groups of equal size:
- Lowest third – up to 24% of pupils were disadvantaged
- Middle third – between 24 and 38% of pupils were disadvantaged
- Highest third – at least 39% of pupils were disadvantaged
These are the results:
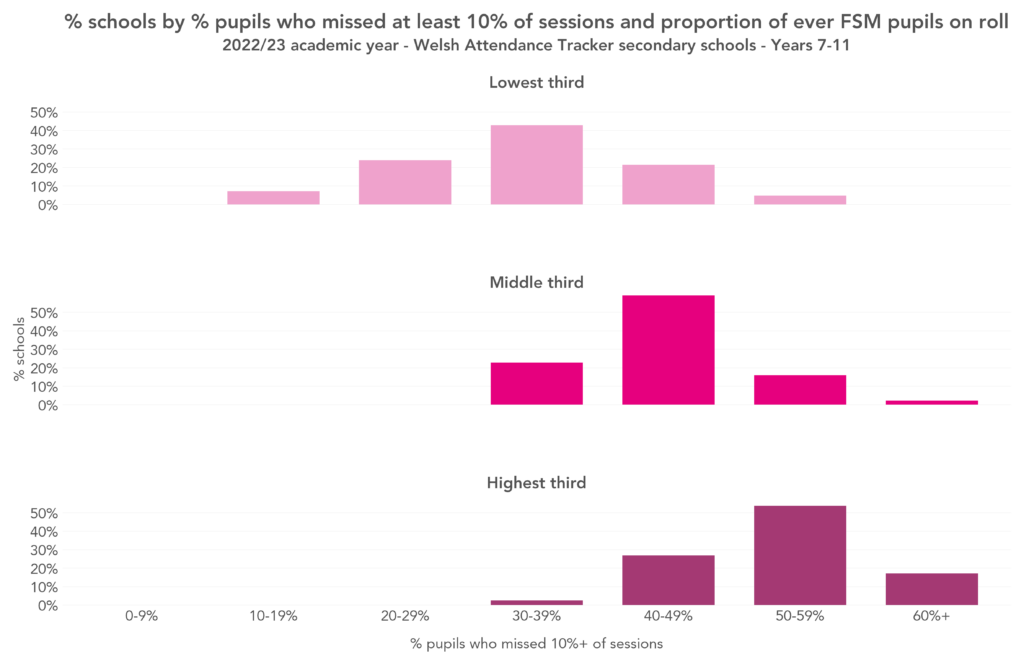
Unsurprisingly, perhaps, schools with a higher proportion of disadvantaged pupils on-roll tended to have higher rates of persistent absence: the most common persistent absence grouping for schools in the lowest third in terms of their proportion of disadvantaged pupils was 30-39%, for the middle third was 40-49%, and for the highest third was 50-59%.
However, not all schools with a high proportion of disadvantaged pupils had very high rates of persistent absence, and not all schools with a low proportion of disadvantaged pupils very low rates.
Your school
To see how persistent absence varies by pupil group in your school head over to Attendance Tracker now, or click here to set up a subscription for your school.
[1] A roundup of persistent absence in 2022/23 using this definition can be found here.
[2] There are also other reasons why a pupil might have a below-average number of possible sessions, for example, if they spent a long period of time dual-registered (sessions recorded in the register as dual registered do not count as possible sessions).
[3] The groupings we use here are as follows: pupils with a Statement of need under the old SEN framework go into “SEN with Statement”, pupils who were School Action or School Action Plus under the old framework or have a school or local authority IDP under the new ALN framework go into “SEN/ALN without Statement” (plus pupils who is still recorded as receiving school specific or local authority support under the old framework) and everyone else goes in to “no SEN/ALN”.


Leave A Comment