Aspire Attendance Tracker
Schools can track, analyse and compare their attendance data against 1,000s of other FFT schools using Aspire Attendance Tracker.
Log in to Aspire to access Attendance Tracker – log in here.
Not an FFT Aspire user? Learn more here.
The return to school this year has been accompanied by a renewed push on attendance by the Government.
When we last looked at attendance, in early November, the picture was similar to the same period the previous year. Though absence was down slightly at primary, and up slightly at secondary. And both absence and persistent absence remained above pre-pandemic norms. In this post, we’ll see how the rest of the term panned out.
As usual, the data is from schools using Aspire Attendance Tracker – around 2,700 secondary and 7,200 primary.
Weekly absence – this year vs last year
Let’s start by looking at the average percentage of morning and afternoon registration sessions missed due to absence in each week of the Autumn Term. To see how things compare with last year’s Autumn Term, we’ll add the equivalent weeks’ percentages in a paler shade.

We can see this year’s absence tracked last year’s quite closely in the first half-term, but after that, the lines diverge. November and, particularly, December in 2022 saw big increases in absence toward the end of term. While absence did increase this year as term wore on, the week-on-week increases were much less dramatic (with the exception of the final week of term, where there was an equally steep uptick this year).
Across the whole term, primary pupils missed an average of 5.6% of sessions compared with 6.7% last year, and secondary pupils missed 8.7% compared with 9.3% last year[1]. For context, in Autumn 2019, primary pupils missed 4.3% of sessions and secondary pupils 5.6%. So at primary, absence this Autumn Term was around 1.3 percentage points higher than pre-pandemic norms, and at secondary around 3.1 percentage points higher.
Reasons for absence
To see what’s behind these year-on-year changes, we’ll look at the reasons for absence recorded in schools’ registers. Specifically, we’ll look at the proportion of sessions recorded as illness-related absences, authorised absences not related to illness, and unauthorised absence. (In the latest year, the proportion of unauthorised absence will be inflated somewhat as schools will still be chasing up reasons for the most recent absences.)

At both primary and secondary, the main driver for the reduction in absence this year is a reduction in illness-related absence – from 4.4% of sessions last Autumn to 3.2% this Autumn in primary schools, and from 4.9% to 4.0% in secondary schools.
When comparing this Autumn with pre-pandemic, the picture is less clear-cut. At primary, there was a bit more illness-related absence than in Autumn 2019 (0.6 percentage points), and a bit more unauthorised absence (0.6 percentage points). At secondary, there was a bit more illness-related (0.9 percentage points) and a lot more unauthorised absence (2.8 percentage points).
Weekly absence across the country
Now let’s see how weekly absence varied by region. Firstly, for primary pupils:

Broadly, most regions mirror the national picture of absence steadily increasing through the second half-term this year, with rates far below the same weeks last year. Not all regions saw the sharp uptick in absence in the last week of term though – in fact, this seems to have been mostly confined to the south of the country, with London and the South East worst affected.
Looking now at secondary pupils:
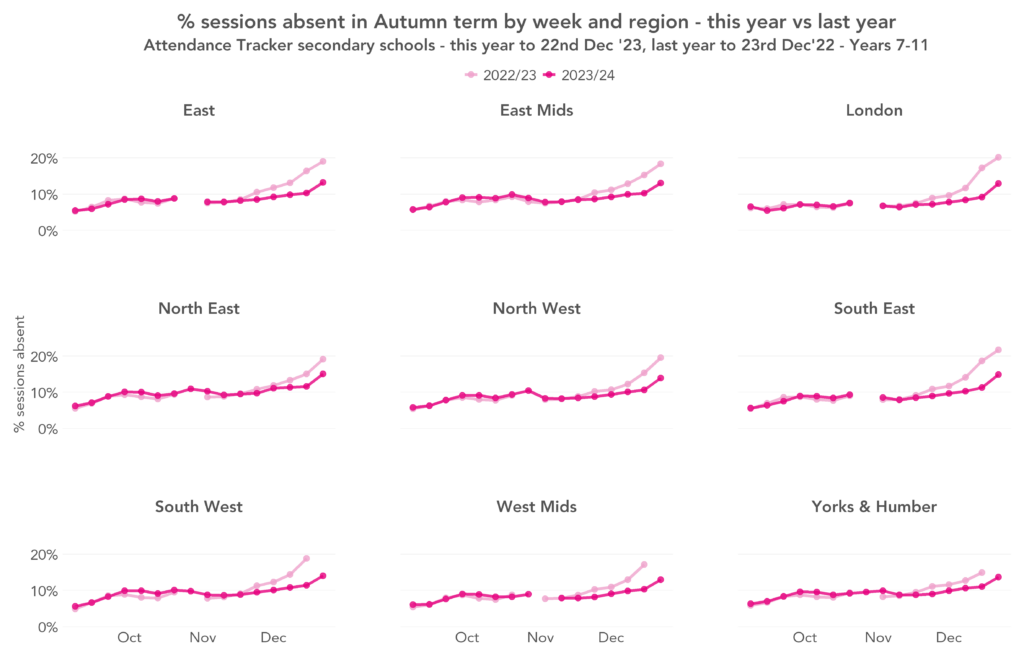
Here, almost all regions share the same pattern – absence increased steadily as term went on, at a slower rate than the same period last year, and increased sharply in the final week of term.
Persistent absence – this year vs last year
Moving on to persistent absence. Here we’ll plot the proportion of pupils who missed at least 10%, 20% and 50% of sessions in Autumn Term – the equivalent of around 7, 14 and 35 days off, respectively[2]. Again, we’ll compare with last year’s Autumn Term.
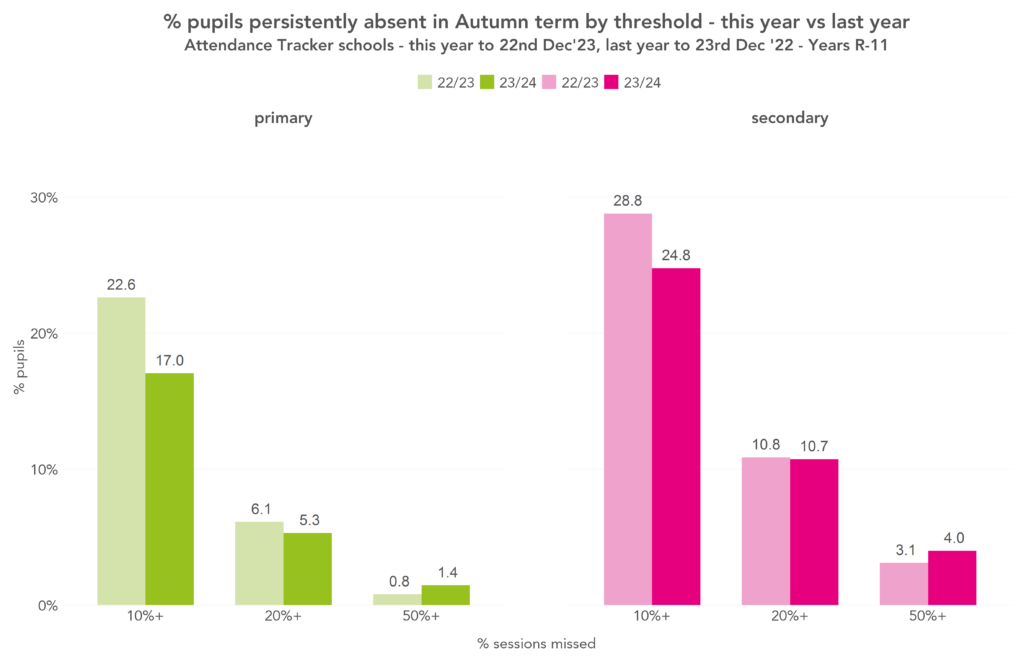
Similar results in the previous section, persistent absence was lower this Autumn Term than last at both primary and secondary, with primary seeing bigger improvements than secondary.
However, there has been less of an improvement at the higher thresholds than the lower. In particular, the proportion of pupils who missed at least 50% of sessions (sometimes referred to as severely absent pupils) seems to have increased. We’d sound a note of caution about that result for now though, as we suspect this year’s data contains pupils who left their schools over the summer but were only taken off-roll this year. (While this is typically only a small number of pupils, their presence has a large effect when discussing small percentages.)
At both primary and secondary, persistent absence remained some way above pre-pandemic (in Autumn 2019, 11.2% of primary and 15.0% of secondary pupils missed at least 10% of sessions).
Persistent absence across the country
Let’s now look at how persistent absence varied across the country. Here, we’ll focus on the 10% threshold.
First, we’ll plot the percentage of primary pupils who were persistently absent in each region.

There’s not much difference between the regions with the highest rates of persistent absence (the North East and West Midlands with 18.1%) and the lowest (the South West with 15.8%).
But while all regions saw reductions in persistent absence, some saw bigger changes than others. For example, in London persistent absence dropped by 6.9 percentage points compared with 3.3 percentage points in the North East.
Moving on to secondary:

Like at primary, most regions had similar rates of persistent absence this year – there was only a 2.3 percentage point difference between seven of the nine regions. The North East, with the highest rates, and London, the lowest, were exceptions.
All regions saw drops in persistent absence compared with last year.
Summing up
Absence rates this Autumn Term are lower, on average, than last Autumn Term, with bigger reductions among primary pupils than secondary. This is driven almost entirely by reductions in absence coded as illness.
The reduction in absence for primary pupils is so large in fact, that average absence is now only around a percentage point higher than pre-pandemic. It remains to be seen whether this will hold as the year progresses, particularly as there’s still two months of winter to get through.
And rates of persistent absence are still stubbornly high, both at primary and, particularly, secondary.
Want to stay up-to-date with the latest research from FFT Education Datalab? Sign up to Datalab’s mailing list to get notifications about new blogposts, or to receive the team’s half-termly newsletter.


Hi Katie – more fascinating data. Interesting that absenteeism is falling in all categories (except 50%+) just as the Govt launches its campaign on school attendance.
I wonder if you have any information on the number of days lost to permanent and fixed term exclusions over the same periods. I’m trying to work out whether the fall of the absenteeism figures is as great as the (anticipated/anecdotal) rise in exclusion figures. If you have any data I’d be very grateful.
Many thanks for your great work
Tim
Hi Katie, me again! I see from the DfE site that in the autumn term of the school year 2022/2023 47% of suspensions were for one day and 99% were for one week or under. Do you have have any more detail about the average length of a suspension? (ie what was the average suspension for those were suspended for more than one day)
Best
Tim
Hi Tim. The best place to get this information is from that DfE site. There’s a link on the page you were on just below the headlines box called “view or create your own tables” which takes you here. Then, on the left, one of the files you can download is called “suspensions – duration of suspensions”, which gives you a breakdown of number of suspensions by duration for the past few years.
Re your other comment, exclusion tends to be only a small contributor to overall absence, so would be very unlikely to be driving any changes. For example, even if there were to be twice as many exclusions this year as there were last year, overall absence would only go up by ~0.1-0.2 percentage points. You can see the figures for last year in this post.
Hi Tim. Average suspension length was 2.8 days in primary and 3.7 days in seconday in Autumn 22/23. That’s from the “Suspensions – average days missed” file on the page included in Katie’s link.