Earlier this month we looked at how absence rates in September compared with last September. We saw that they had increased slightly at secondary, and stayed roughly the same at primary. In this post, we’ll look at how the rest of the half-term panned out.
As usual, we’ll be using data from the 2,700 secondary and 7,200 primary schools that use FFT’s Attendance Tracker. We’ll be restricting the analysis to English schools.
The overall picture – this year vs last year
Let’s start by plotting the average absence rates of pupils in each week of the term so far. We’ll do this separately for primary and secondary.
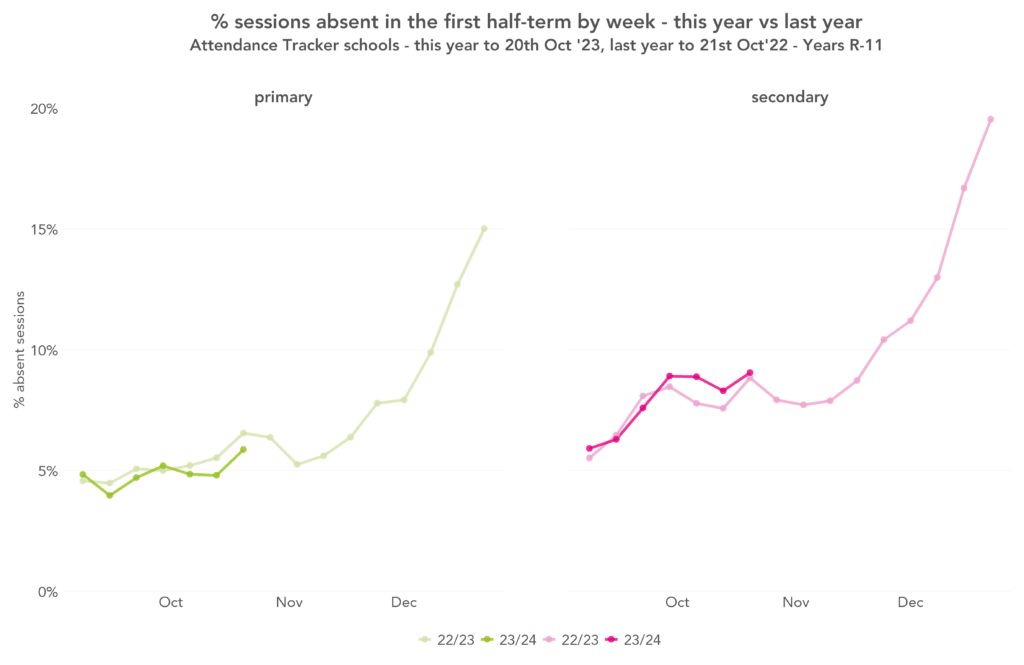
We see the familiar pattern of absence increasing as term goes on, peaking in the weeks before the half-term break.
We also see that absence among primary pupils in October this year was generally lower than last year, while for secondary pupils it tended to be a few percentage points higher.
By year group – this year vs last year
Now let’s look at the half-term as a whole, and compare with the first half-term last year. This time, we’ll plot each year group separately.
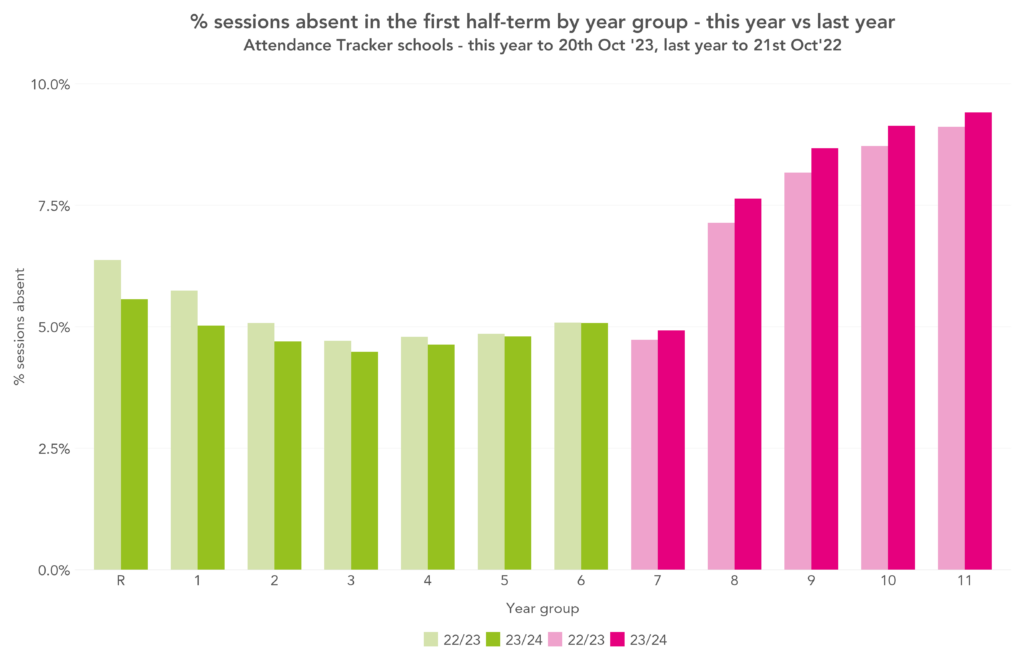
At primary, the youngest pupils have seen the biggest improvements in absence compared with last year – in Reception the drop was 0.8 percentage points, while in Year 6 there was no change. All secondary year groups saw increases of around 0.4 percentage points.
Overall, primary pupils have missed 4.9% of sessions so far this year compared with 5.2% over the same period last year. This isn’t much higher than pre-pandemic (4.3% in Autumn 2019[1]). But in the last two years we’ve seen much higher absence rates in the second half of Autumn Term than the first. So it’s unlikely that Autumn Term 2023 will see a return to pre-pandemic levels of absence in primary schools.
The 7.9% of sessions missed by secondary pupils so far this year is some way higher than pre-pandemic (5.6% in Autumn 2019).
By region – this year vs last year
Looking now at how things have changed across the country. First, for primary pupils:
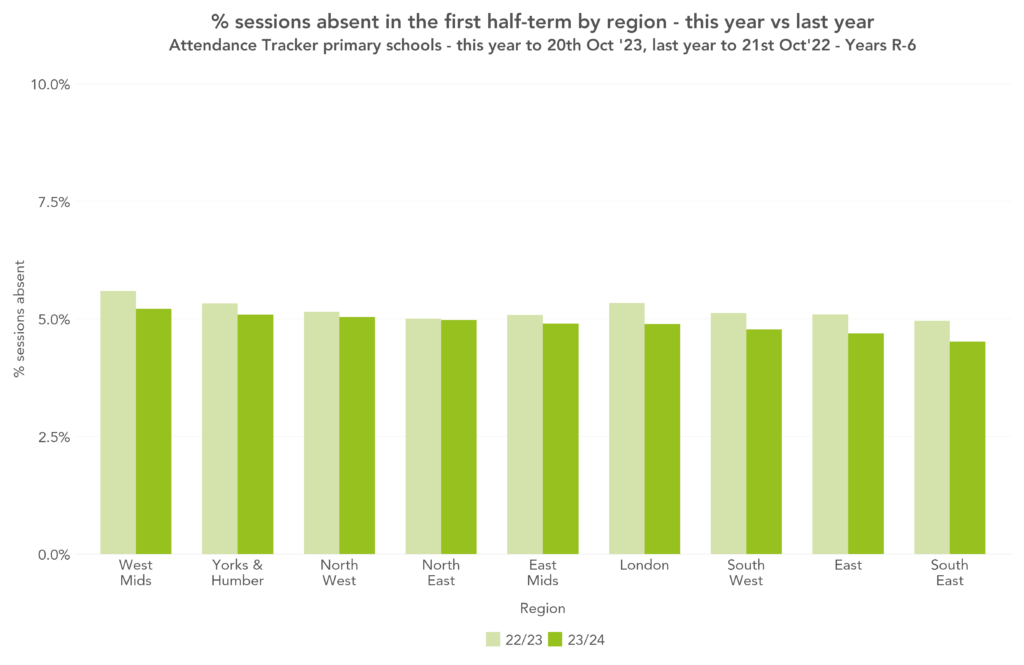
Absence has decreased slightly in all regions apart from the North East, where it has stayed the same. Absence remained highest in the West Midlands (5.2%) and lowest in the South East (4.5%).
And for secondary pupils:
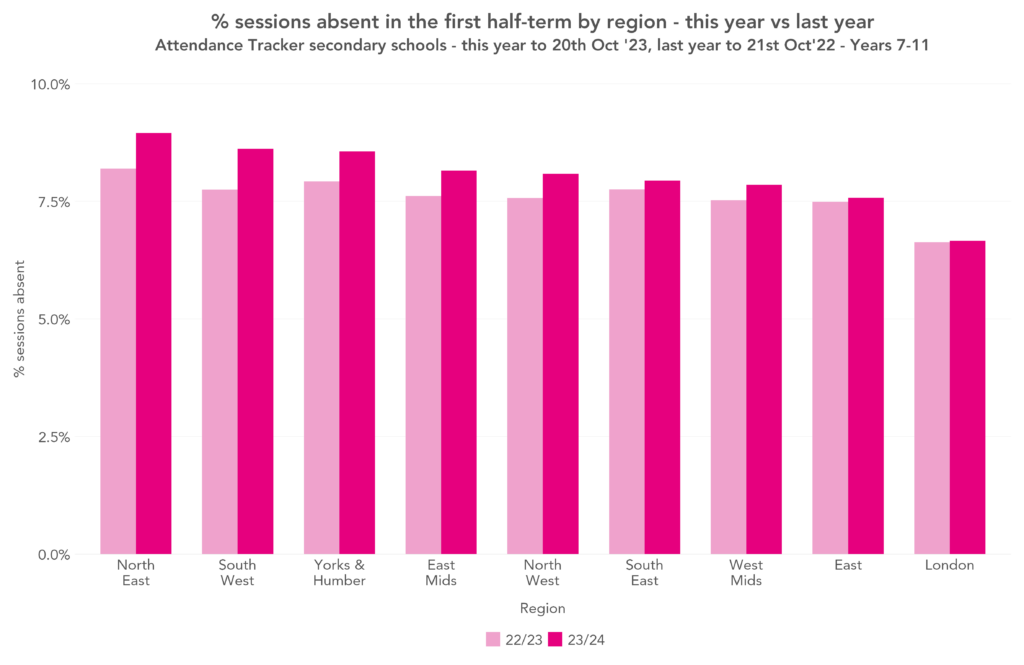
Absence increased in all regions apart from London, where it stayed the same. In the East of England, absence increased by only 0.1 percentage points.
As was the case last year, the North East remains the region with the highest absence rates, and London the lowest.
Persistent absence
We turn now to persistent absence. We’ll calculate the percentage of pupils who missed at least 10%, 20% and 50% of sessions so far this year, and compare with the same period last year. Across the half-term, this is equivalent to missing at least three and a half, seven, and seventeen and a half school days, respectively[2]. As it’s still early in the school year, there will be pupils who have triggered these thresholds with a single spell of absence.

The picture is similar to what we’ve seen in this post so far: at primary, this year is slightly better than last, and at secondary it’s slightly worse.
There is one area that bucks this trend, though. Although the percentage of pupils missing at least 10% and 20% of sessions at primary has decreased or stayed roughly the same, the percentage missing at least 50% of sessions has increased. We sound the usual notes of caution around not overinterpreting small increases in small numbers, particularly as this will likely include some pupils who left over the summer without informing their schools. But it will be interesting to see if this pattern holds across the rest of the year.
Persistent absence among the most disadvantaged pupils
To finish, we’ll explore how persistent absence varied among disadvantaged pupils – those eligible for free school meals at any point in the last six years (FSM6), and those with an identified special educational need or disability (SEND).
First, this year’s persistent absence rates for FSM6 pupils compared with their peers:
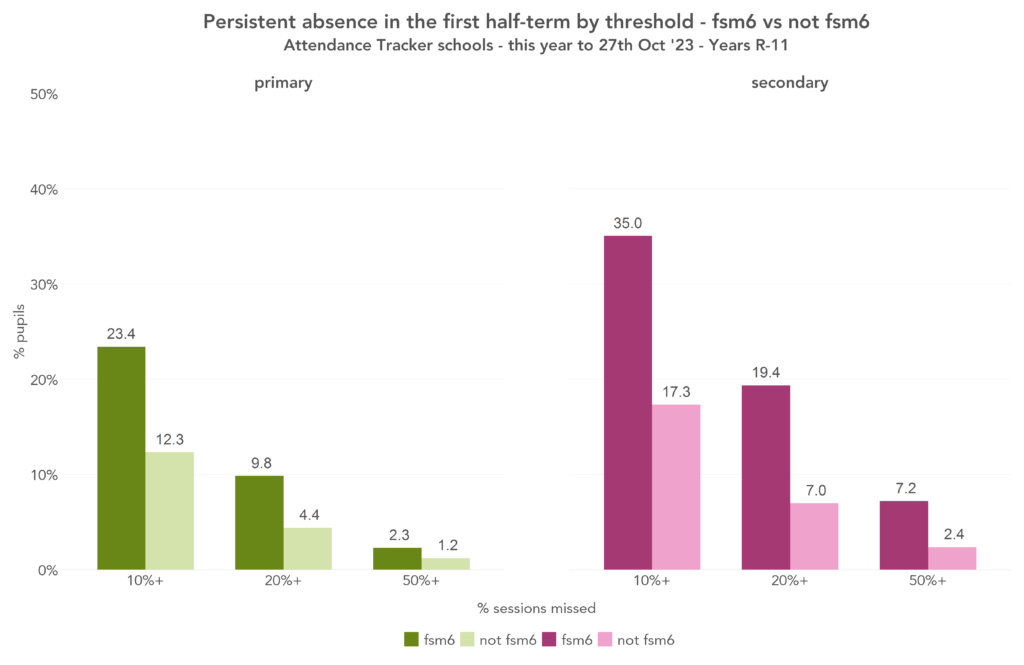
There were much higher rates of persistent absence among FSM6 pupils. At primary, FSM6 pupils were around twice as likely to have missed at least 10%, 20% and 50% of sessions as non-FSM6 pupils. At secondary, they were around twice as likely to have missed at least 10% of sessions, around two and a half times as likely to have missed 20% of sessions, and around three times as likely to have missed at least 50% of sessions.
Now, pupils with SEND:

Rates were highest among SEND pupils with an Education, Health and Care Plan (EHCP). They were between two and three times more likely to have missed at least 10% and at least 20% of sessions as those with no identified SEND, and around four and a half times more likely to have missed at least 50% of sessions.
Those receiving SEN Support also had higher rates of persistent absence than pupils with no identified SEND, though not as high as those with an EHCP.
And finally, let’s compare pupils who were FSM6 and had an EHCP, with those who were not FSM6 and had no identified SEND.
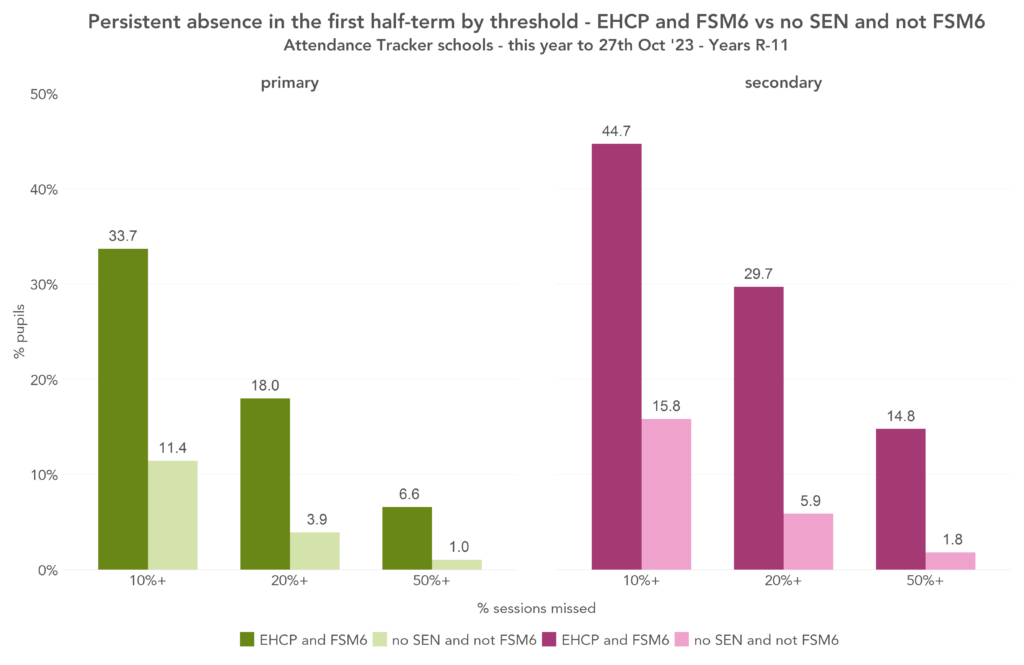
Those who were FSM6 and had an EHCP had much higher rates of persistent absence than those who were not FSM6 and had no identified SEND. The differences were largest at the higher thresholds. For example, at secondary, around one in seven FSM6 pupils with an EHCP missed at least 50% of sessions compared with around one in fifty non-FSM6 pupils with no identified SEND.
Aspire Attendance Tracker
Schools can track, analyse and compare their attendance data against 1,000s of other FFT schools using Aspire Attendance Tracker.
Log in to Aspire to access Attendance Tracker – log in here.
Not an FFT Aspire user? Learn more here.
Summing up
Rates of absence are slightly lower so far this year than last at primary, and slightly higher at secondary.
Persistent absence is still high, with rates highest among the most disadvantaged pupils.
With winter just around the corner, likely bringing with it an increase in seasonal illnesses, it seems unlikely we’ll see a return to pre-pandemic norms by the end of this term.
Want to stay up-to-date with the latest research from FFT Education Datalab? Sign up to Datalab’s mailing list to get notifications about new blogposts, or to receive the team’s half-termly newsletter.


Something to bear in mind – there were bus strikes affecting much of the North East
Affected weeks commencing 2 October and 15 October.
They are now also ongoing (from 28 October).
May well impact your absence comparisons
Thanks Philip, that’s useful context
Hi Katie
Thank you for your brilliant work. I’m forever drawing on FFT data. Do you have any data on the percentages of children with SEND/EHCPs and/or on FSM who are persistently absent comparison with the previous year? I’m trying to find out if the trend on persistent absence mirror the figures of other children. In other words, are proportionately more children with SEND or on FSM persistently absent this year than they were a year ago?
Many thanks
Tim
Hi Tim, glad you find the blogs useful. I’ve put together the persistent absence figures we used for this one into an Excel workbook, downloadable here. You’ll see it’s a mixed bag in terms of your question, which is perhaps not surprising given that we’re only looking at a half-term’s worth of data. Maybe one to keep an eye on.
Also worth adding that if you’re in a school that subscribes to Aspire, there’s a neat summary of persistent absence by pupil group in your school vs all schools nationally at the bottom of the 360 Attendance report.
I’m not a teacher so I don’t have access to Aspire, but I’ll go through the data and see what I can find! Many thanks for this, Katie.