Aspire Attendance Tracker
Schools can track, analyse and compare their attendance data against 1,000s of other FFT schools using Aspire Attendance Tracker.
Log in to Aspire to access Attendance Tracker – log in here.
Not an FFT Aspire user? Learn more here.
Last week the House of Commons Education Committee published its report into the causes of, and possible solutions to, the rise in absence since the start of the Covid-19 pandemic.
With the first month of the new academic year behind us, we take a look at rates of absence this year so far.
As usual, we base the analysis on data collected from 7,200 primary schools and 2,700 secondary schools that make use of FFT’s Attendance Tracker service.
Absence by year group
In the chart below, we compare absence in September 2023 to absence in September 2022 by year group.
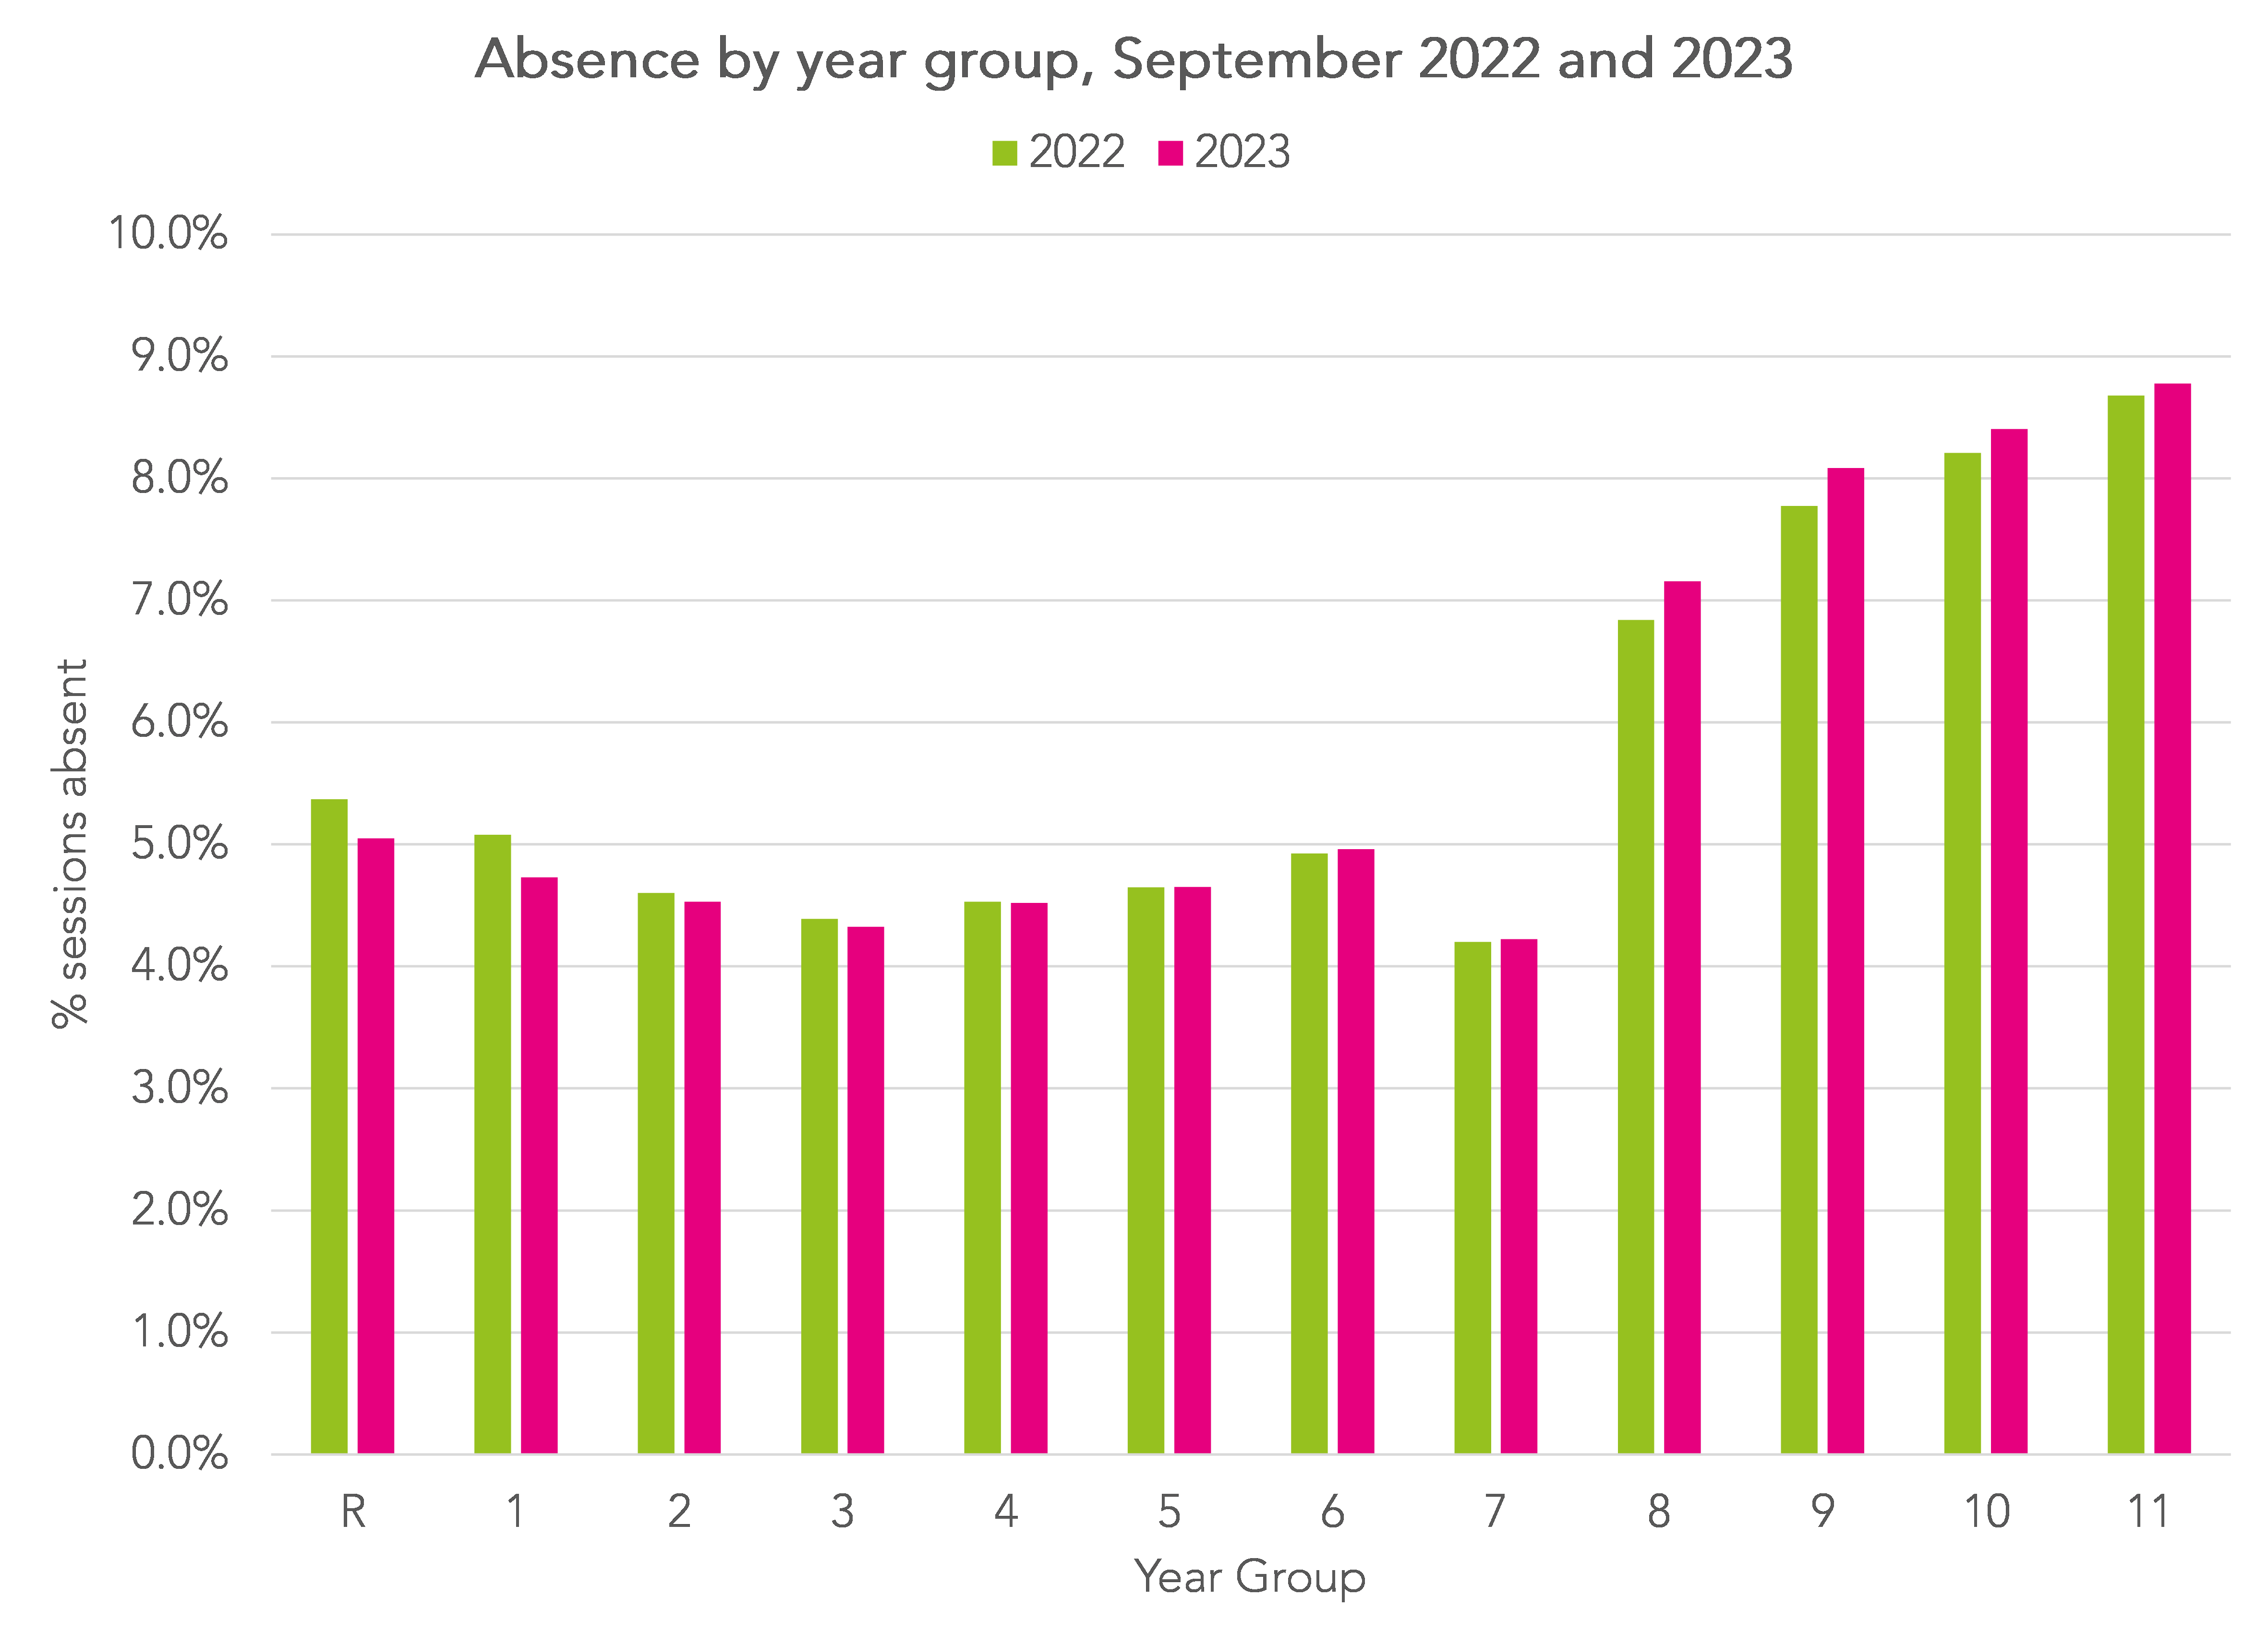
Overall, absence is lower so far this year among pupils in Years 1 to 4. However, it is higher among pupils in Years 5 to 11, particularly those in Years 8 to 11.
Among pupils in Year 8 and below, illness accounts for just under half of all absence in 2023.
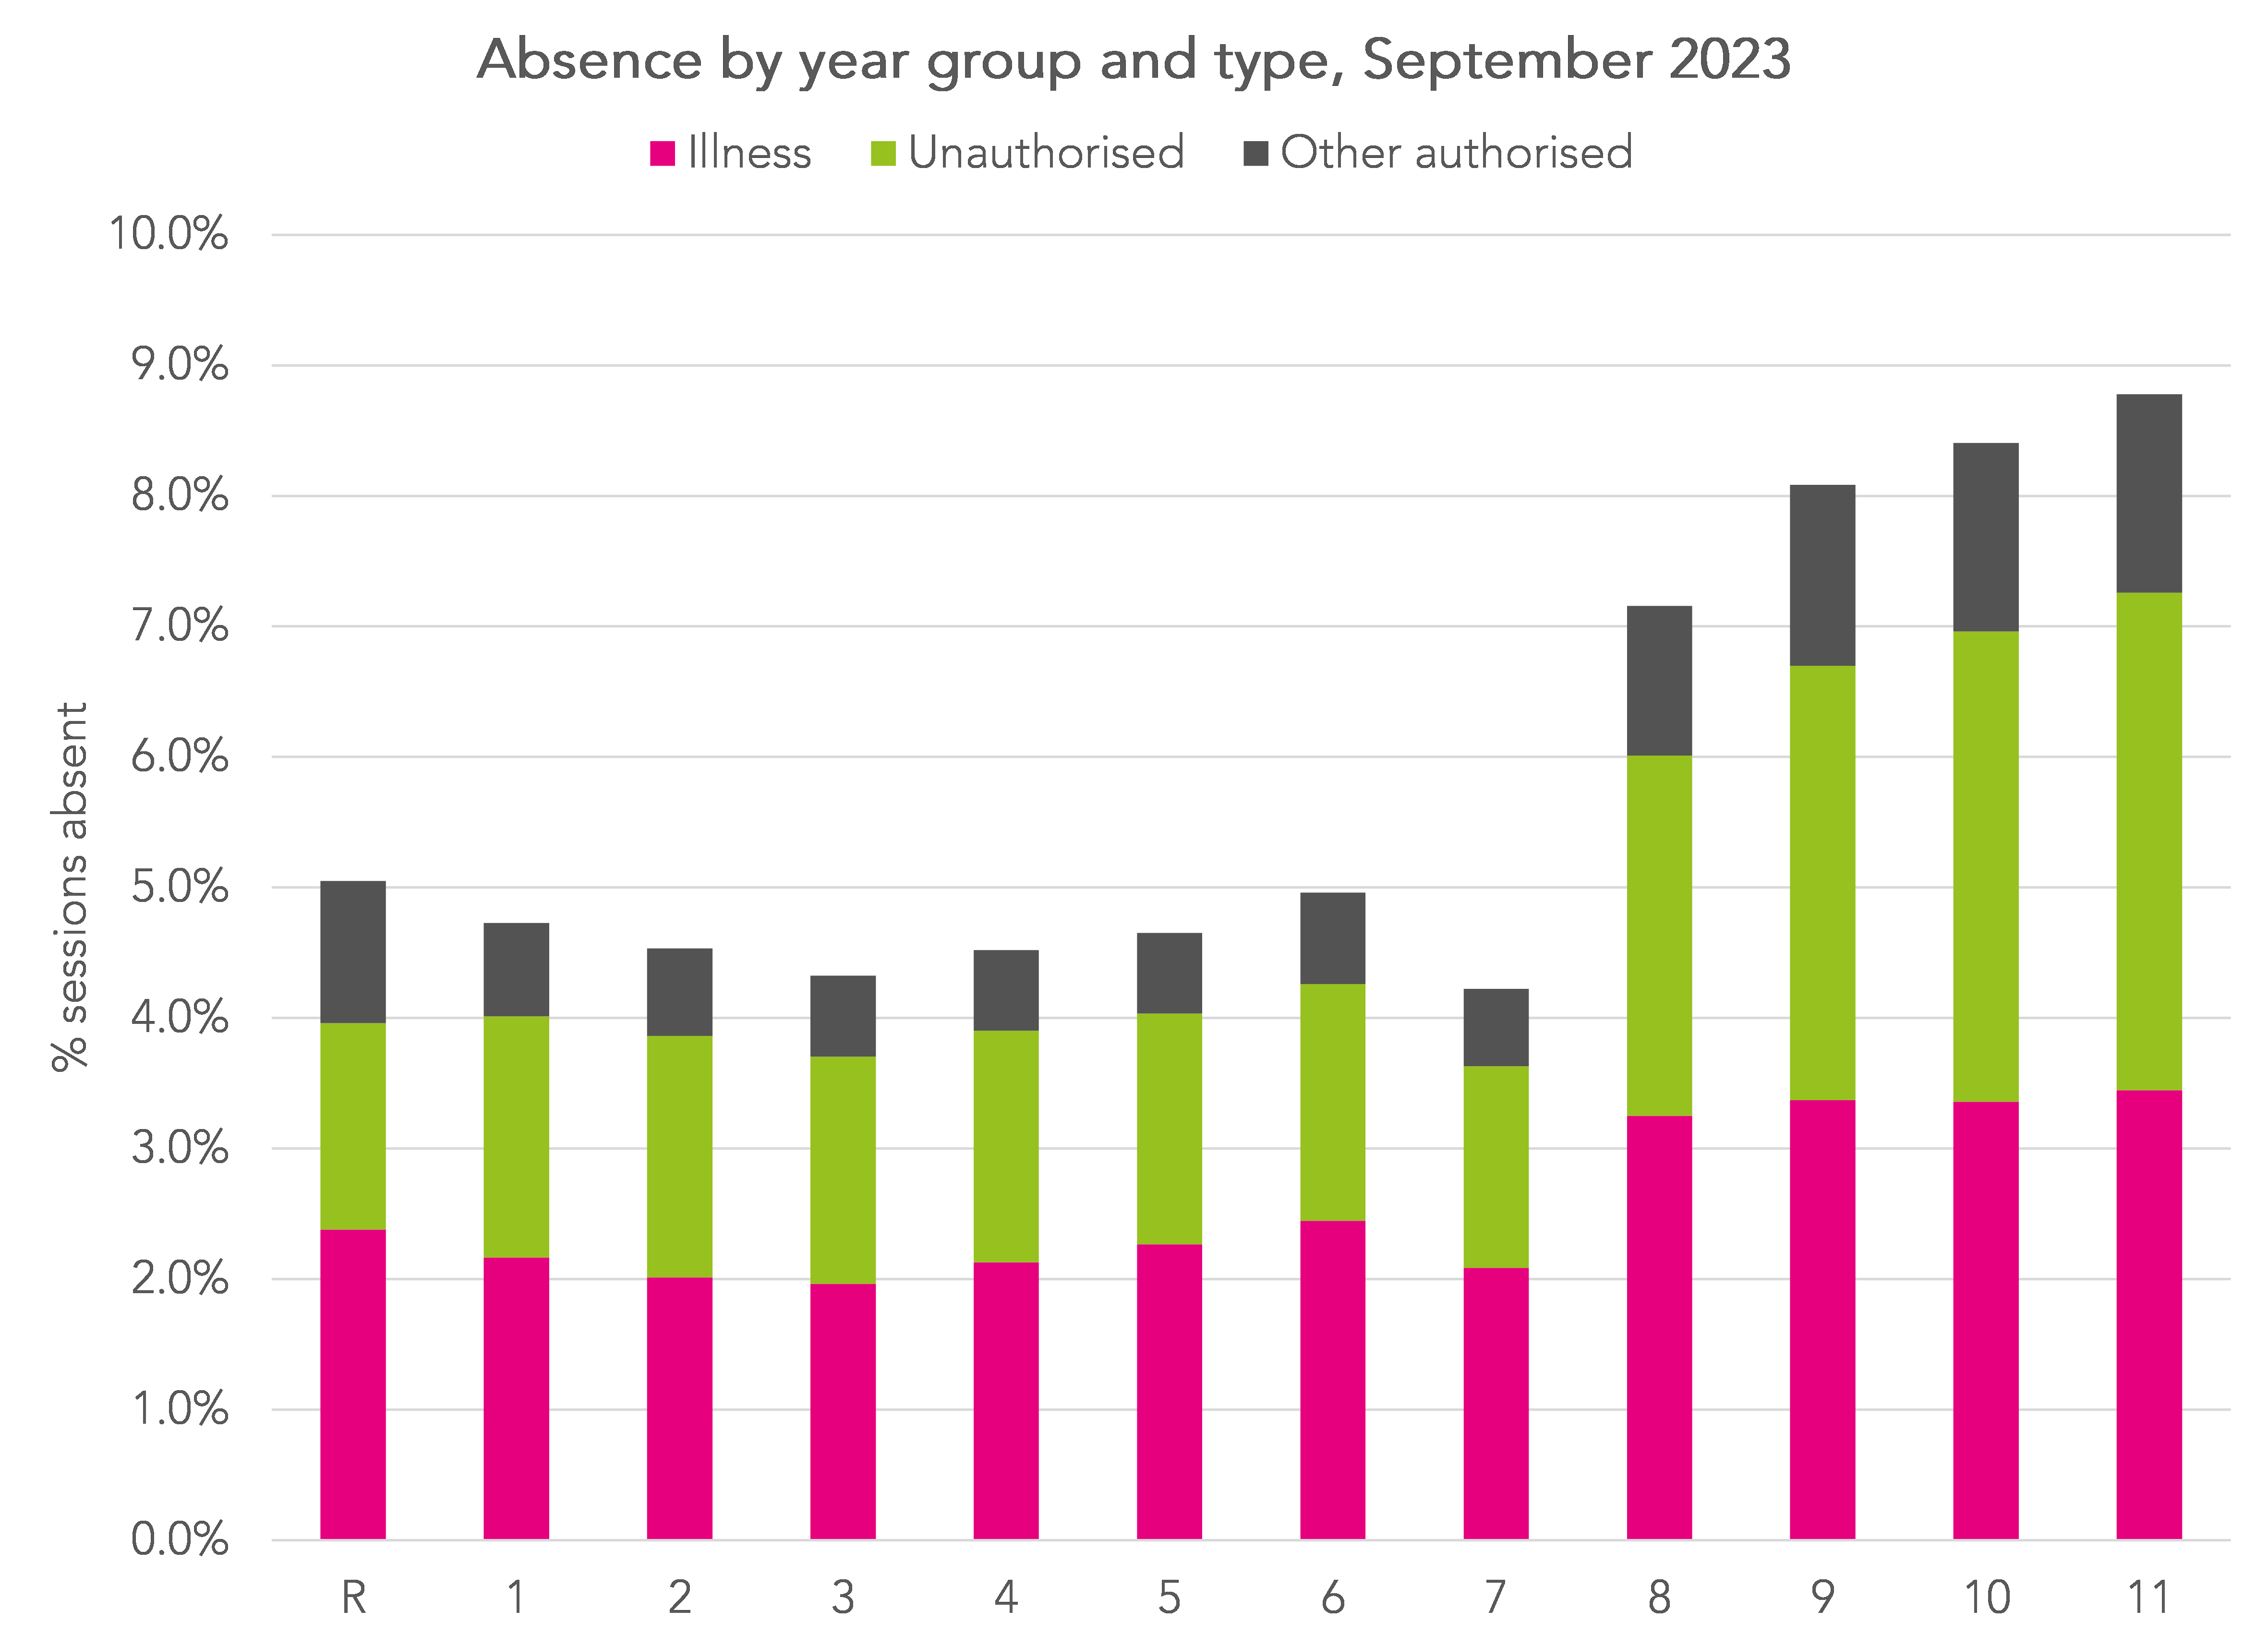
Among pupils in Years 10 and 11, unauthorized absence accounts for more absence than illness. However, some of this may be because reasons for absence have yet to be established.
We can look back to the data for the same period last year, bearing in mind that schools would have had the rest of the 2022/23 academic year to chase up reasons for absence.
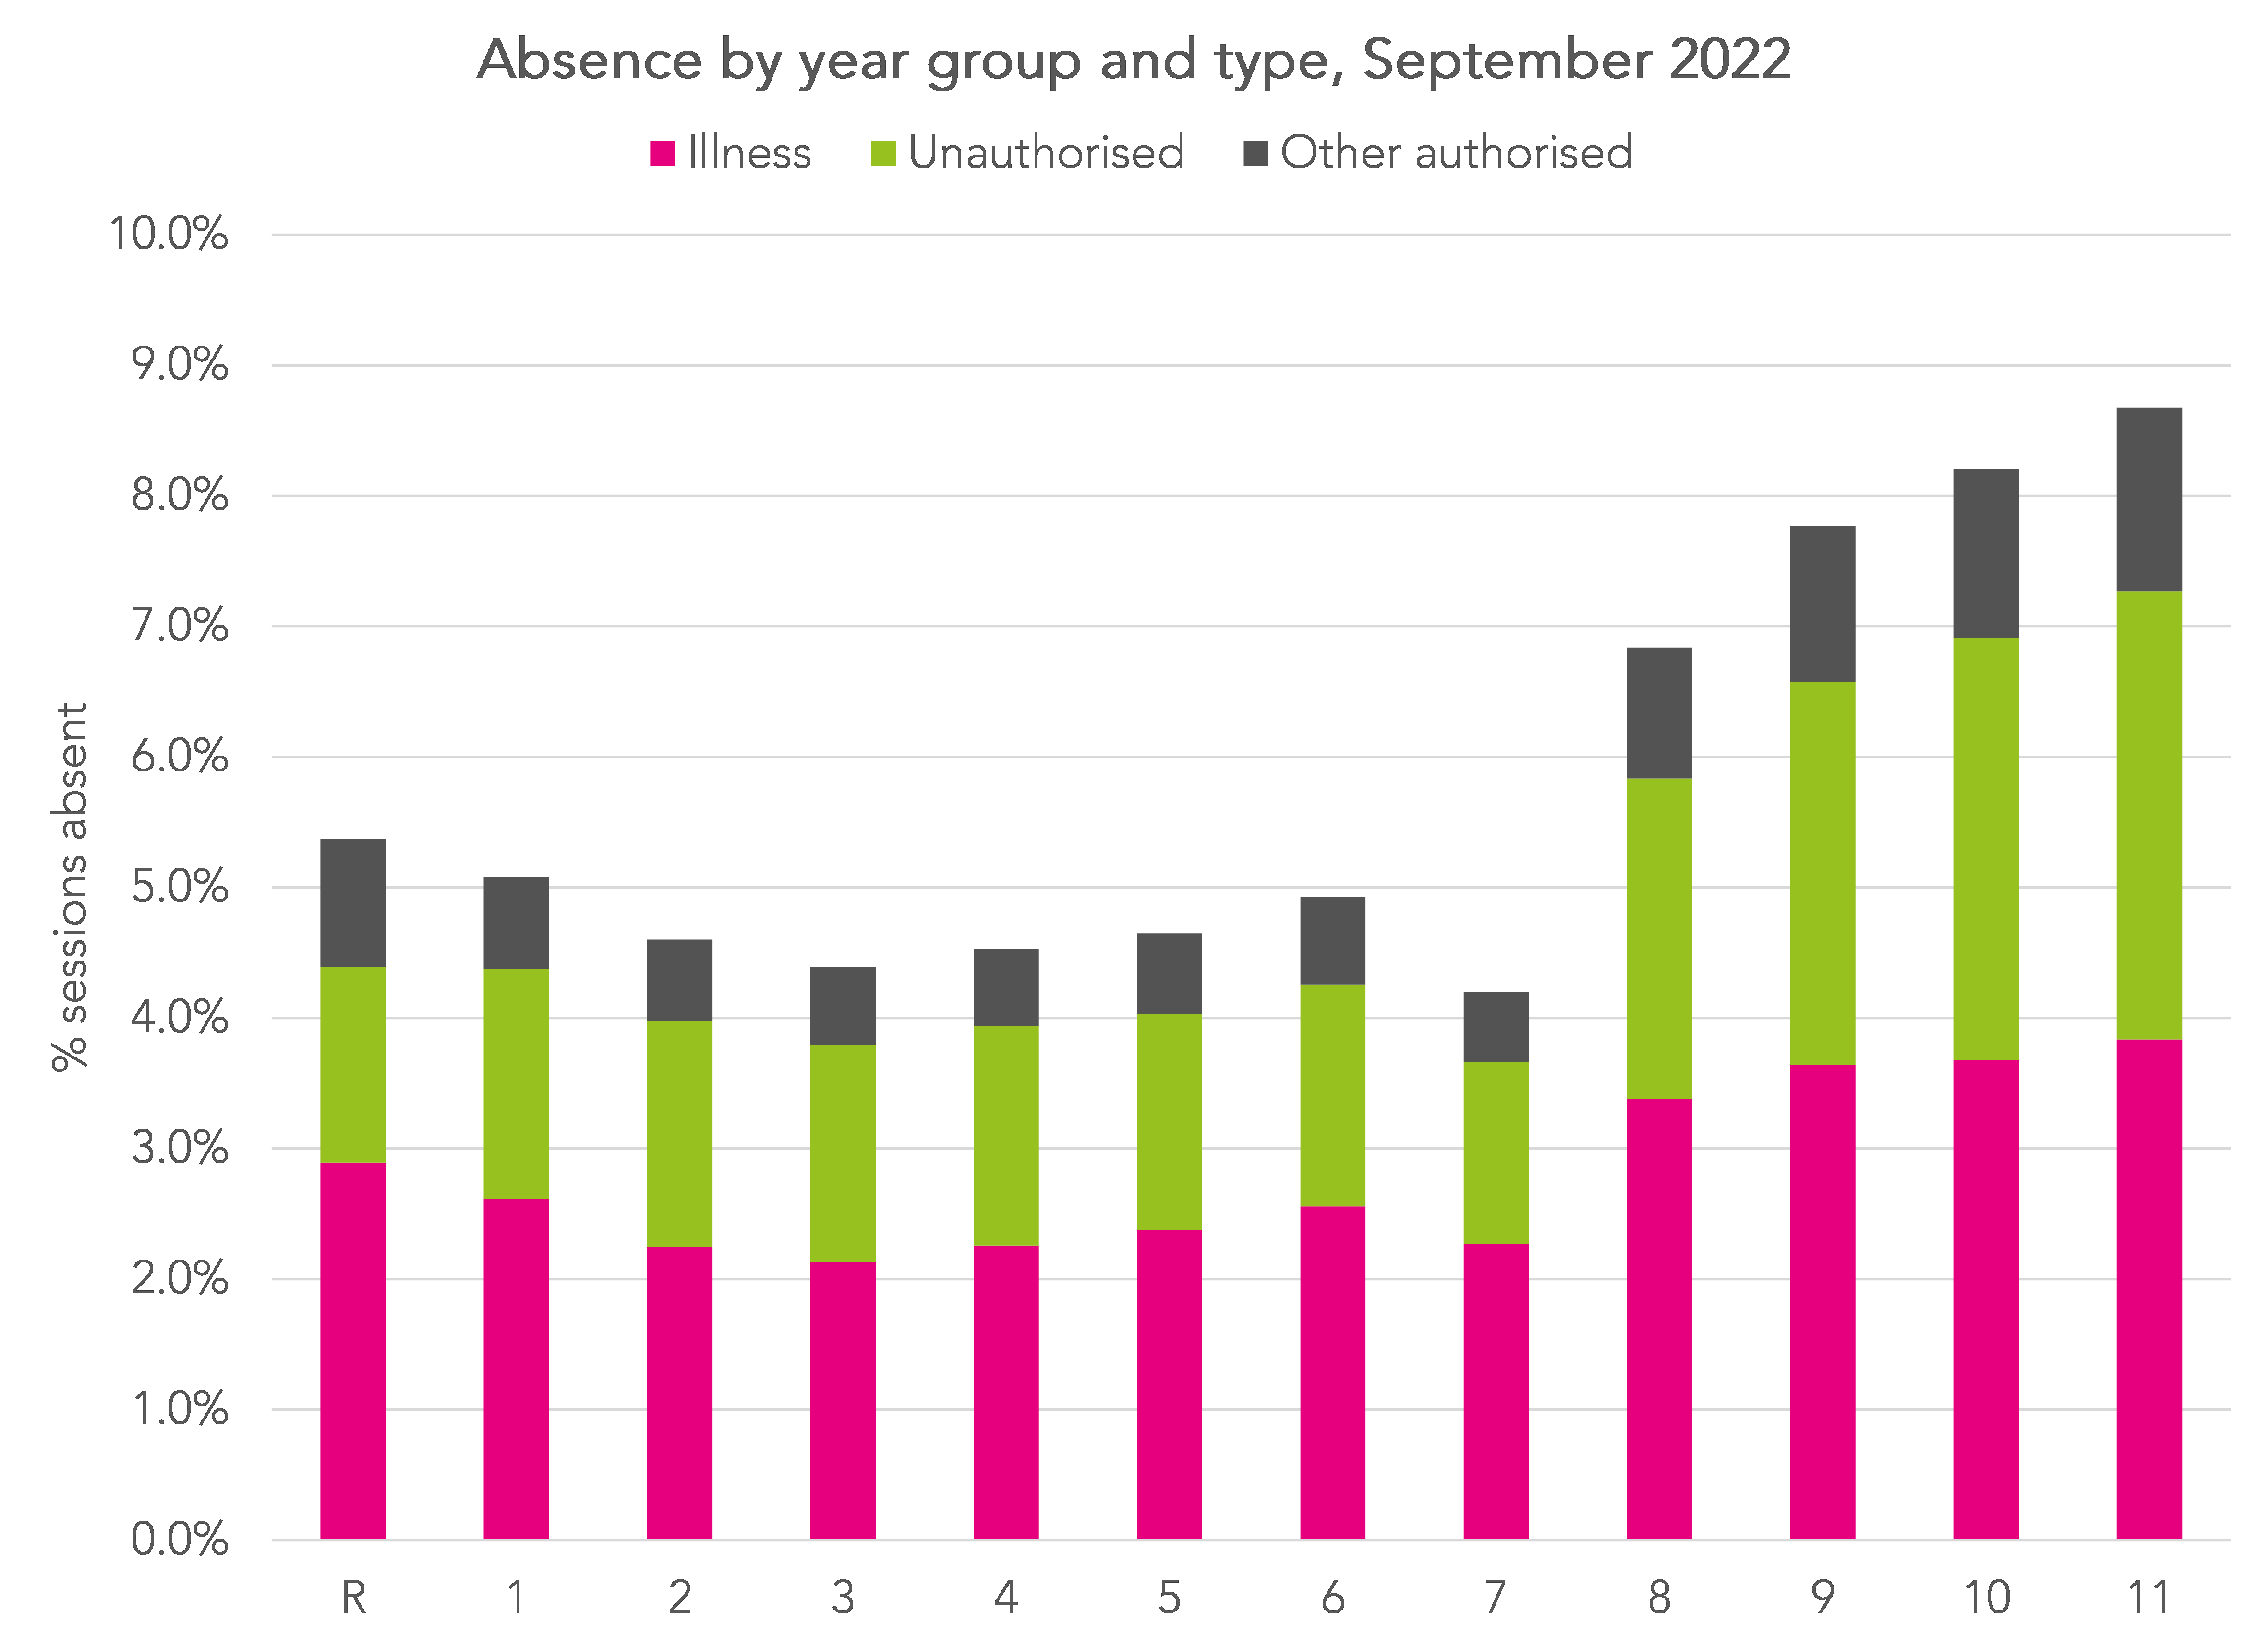
Although there was still a substantial amount of unauthorized absence among pupils in Years 10 and 11, illness was more common. So we might expect some of the unauthorized absence in 2023 to be reclassified as illness over the next few weeks.
Absence by region
Among primary schools, absence remains highest in London and the West Midlands.
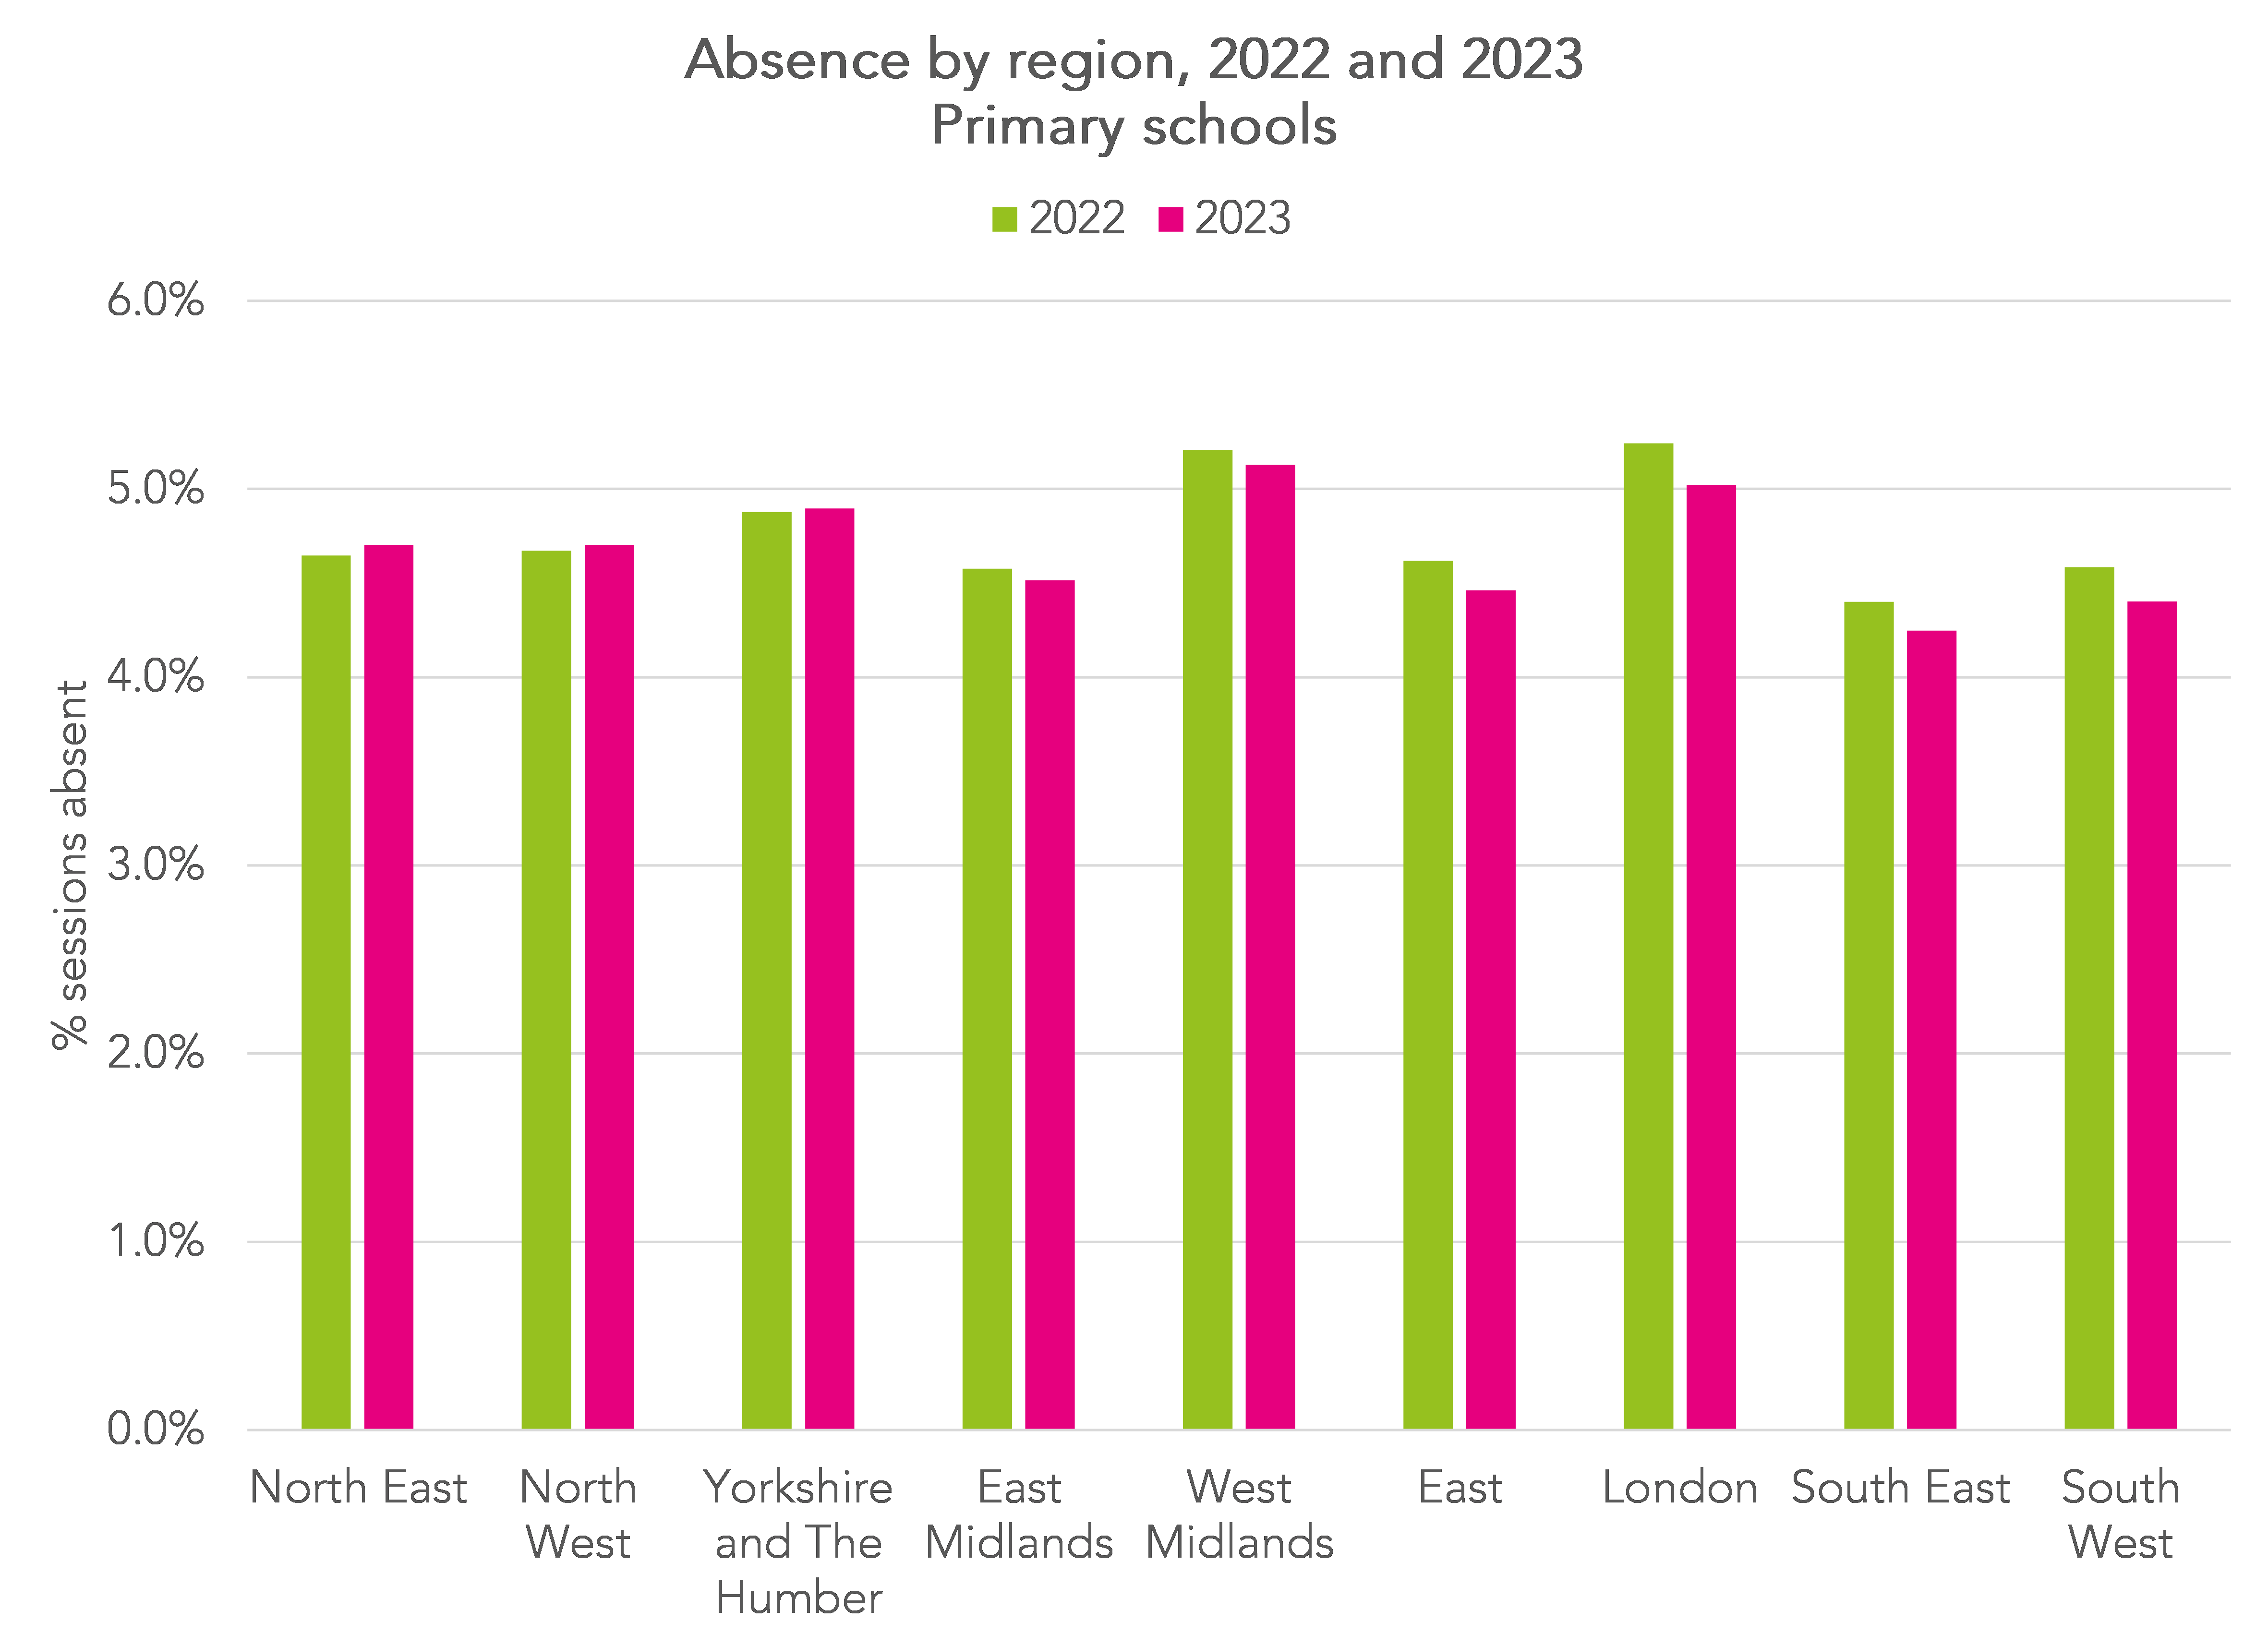
However, absence has increased in primary schools in the three northern regions.
The picture in secondary is somewhat different. Absence remains lowest in London.
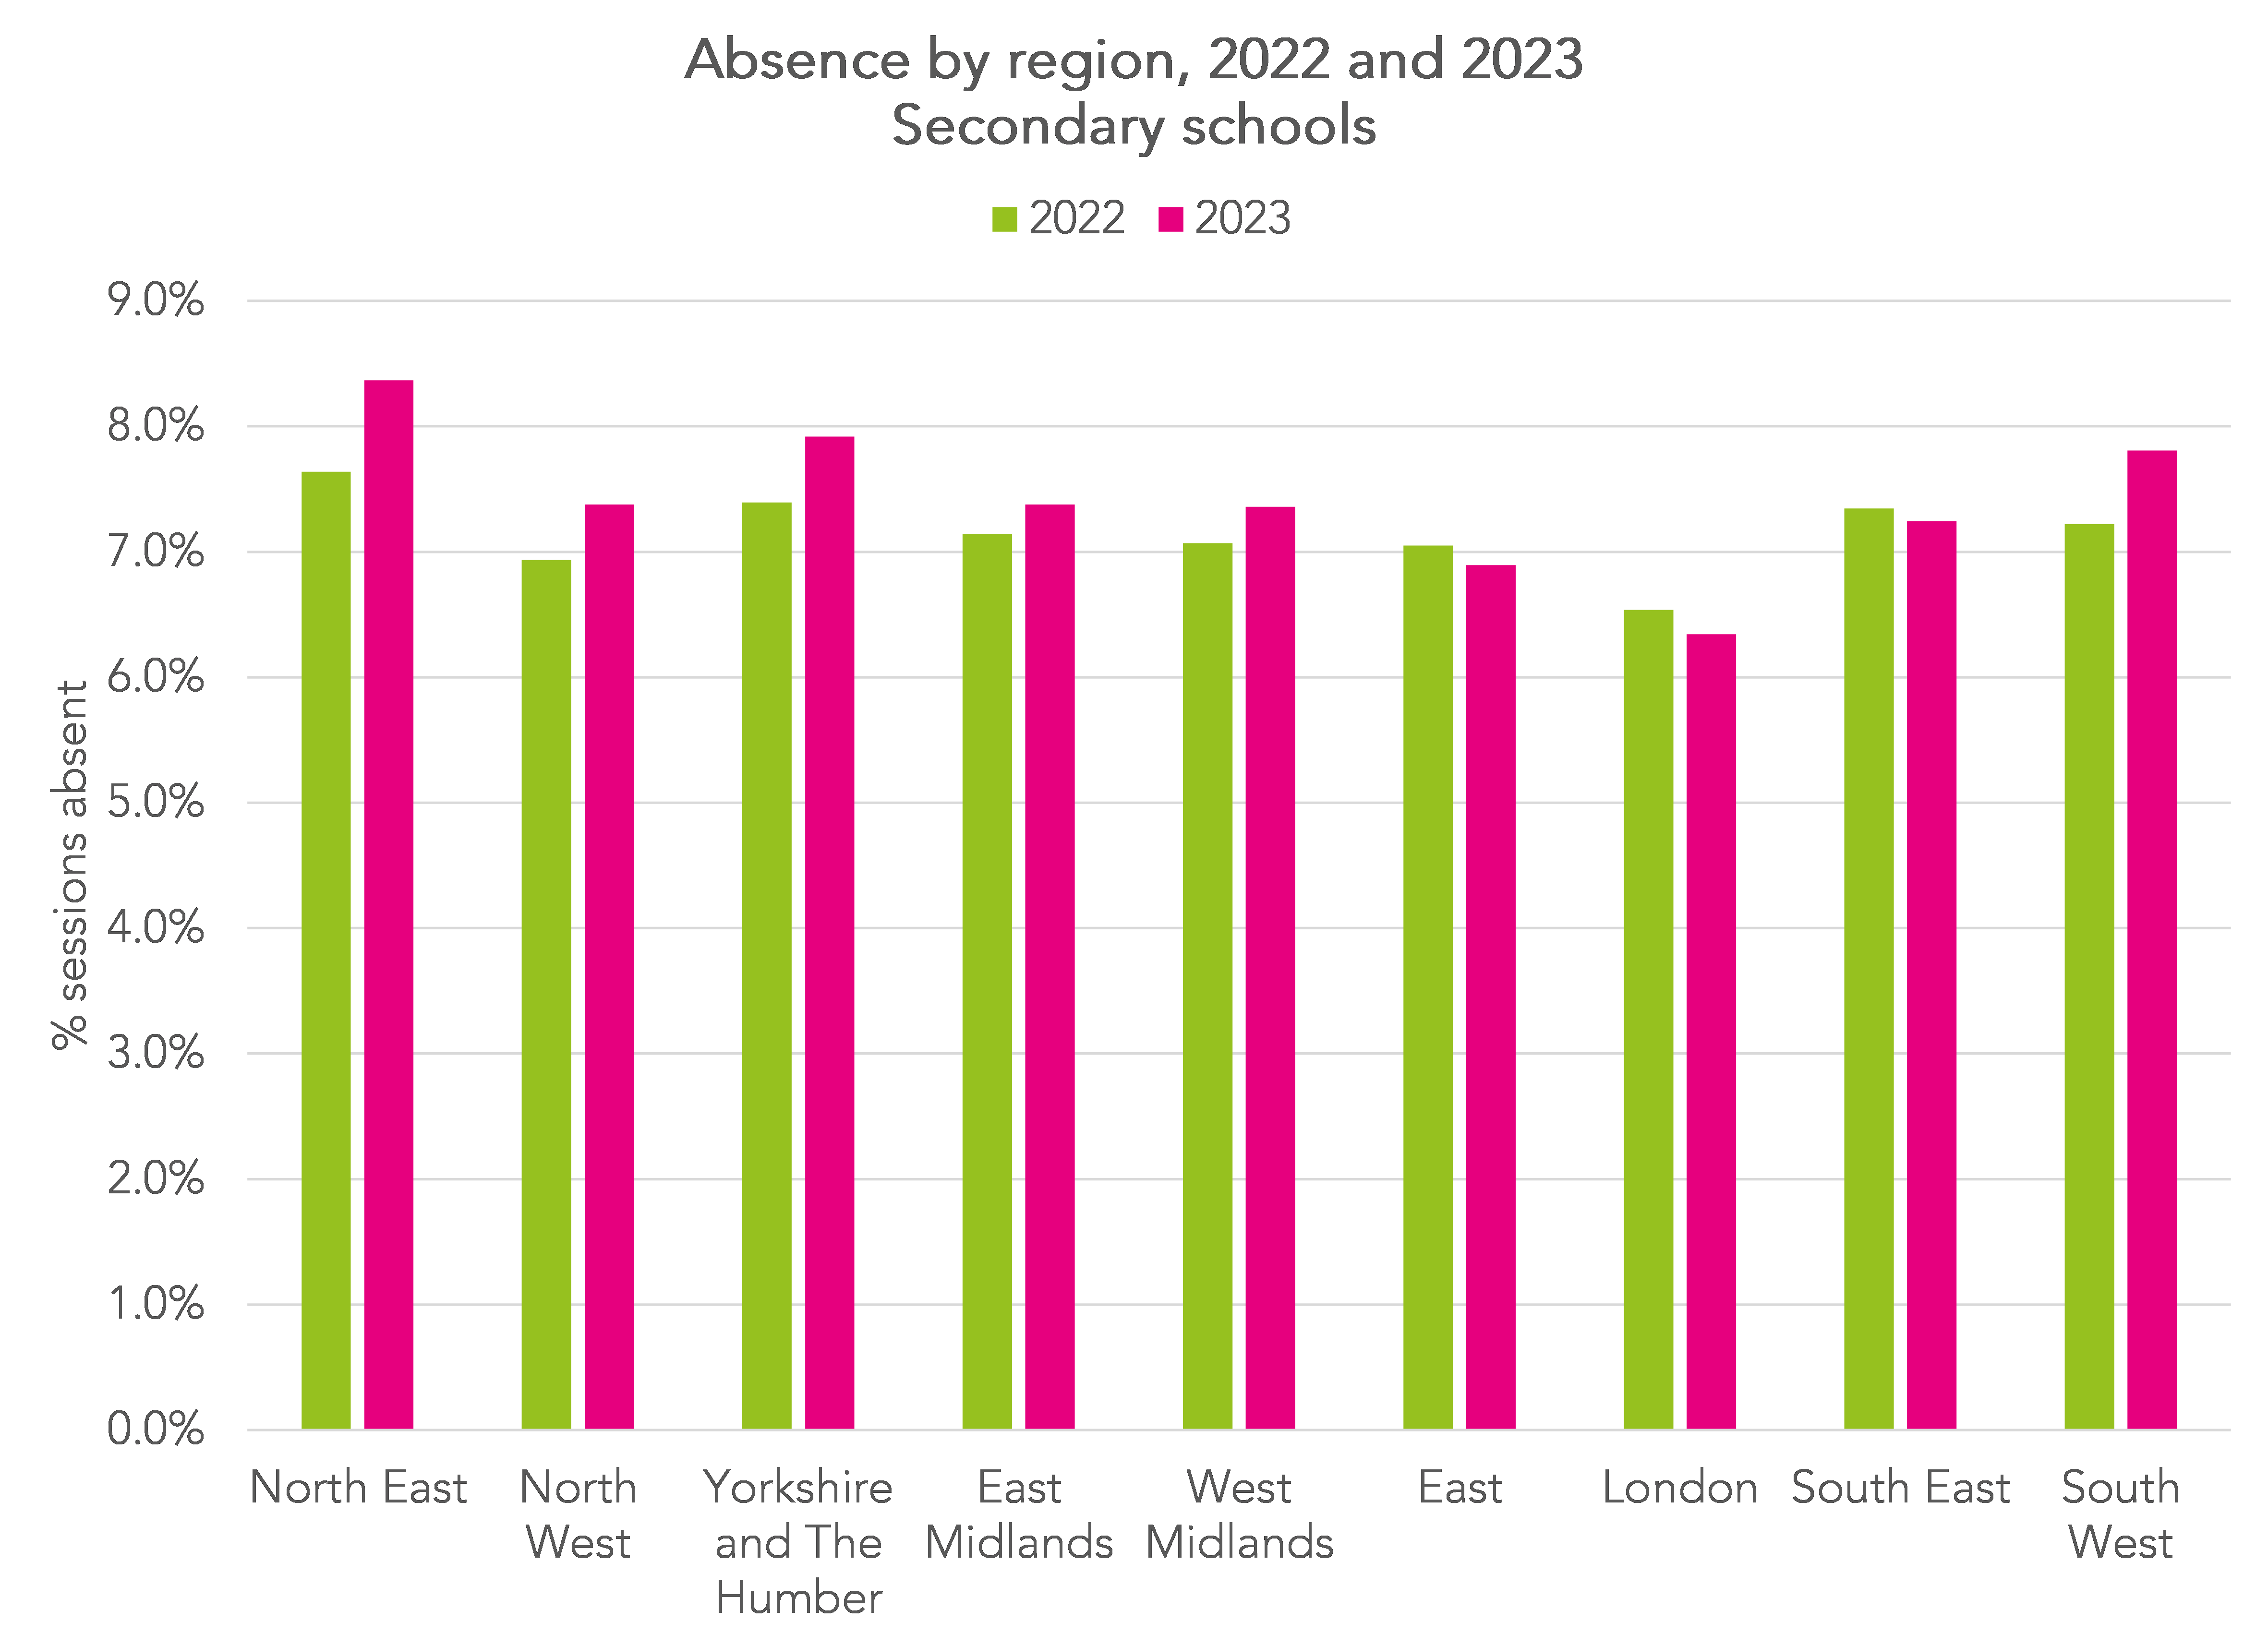
Absence has fallen in London, the East and South East and increased in other regions, notably the North East where it has increased from 7.6% to 8.4%.
Absence by week
In both primary and secondary schools, absence in the first week of 2023 was higher than the first week of 2022. However, it then fell in weeks 2 and 3 before rising in week 4 (last week).
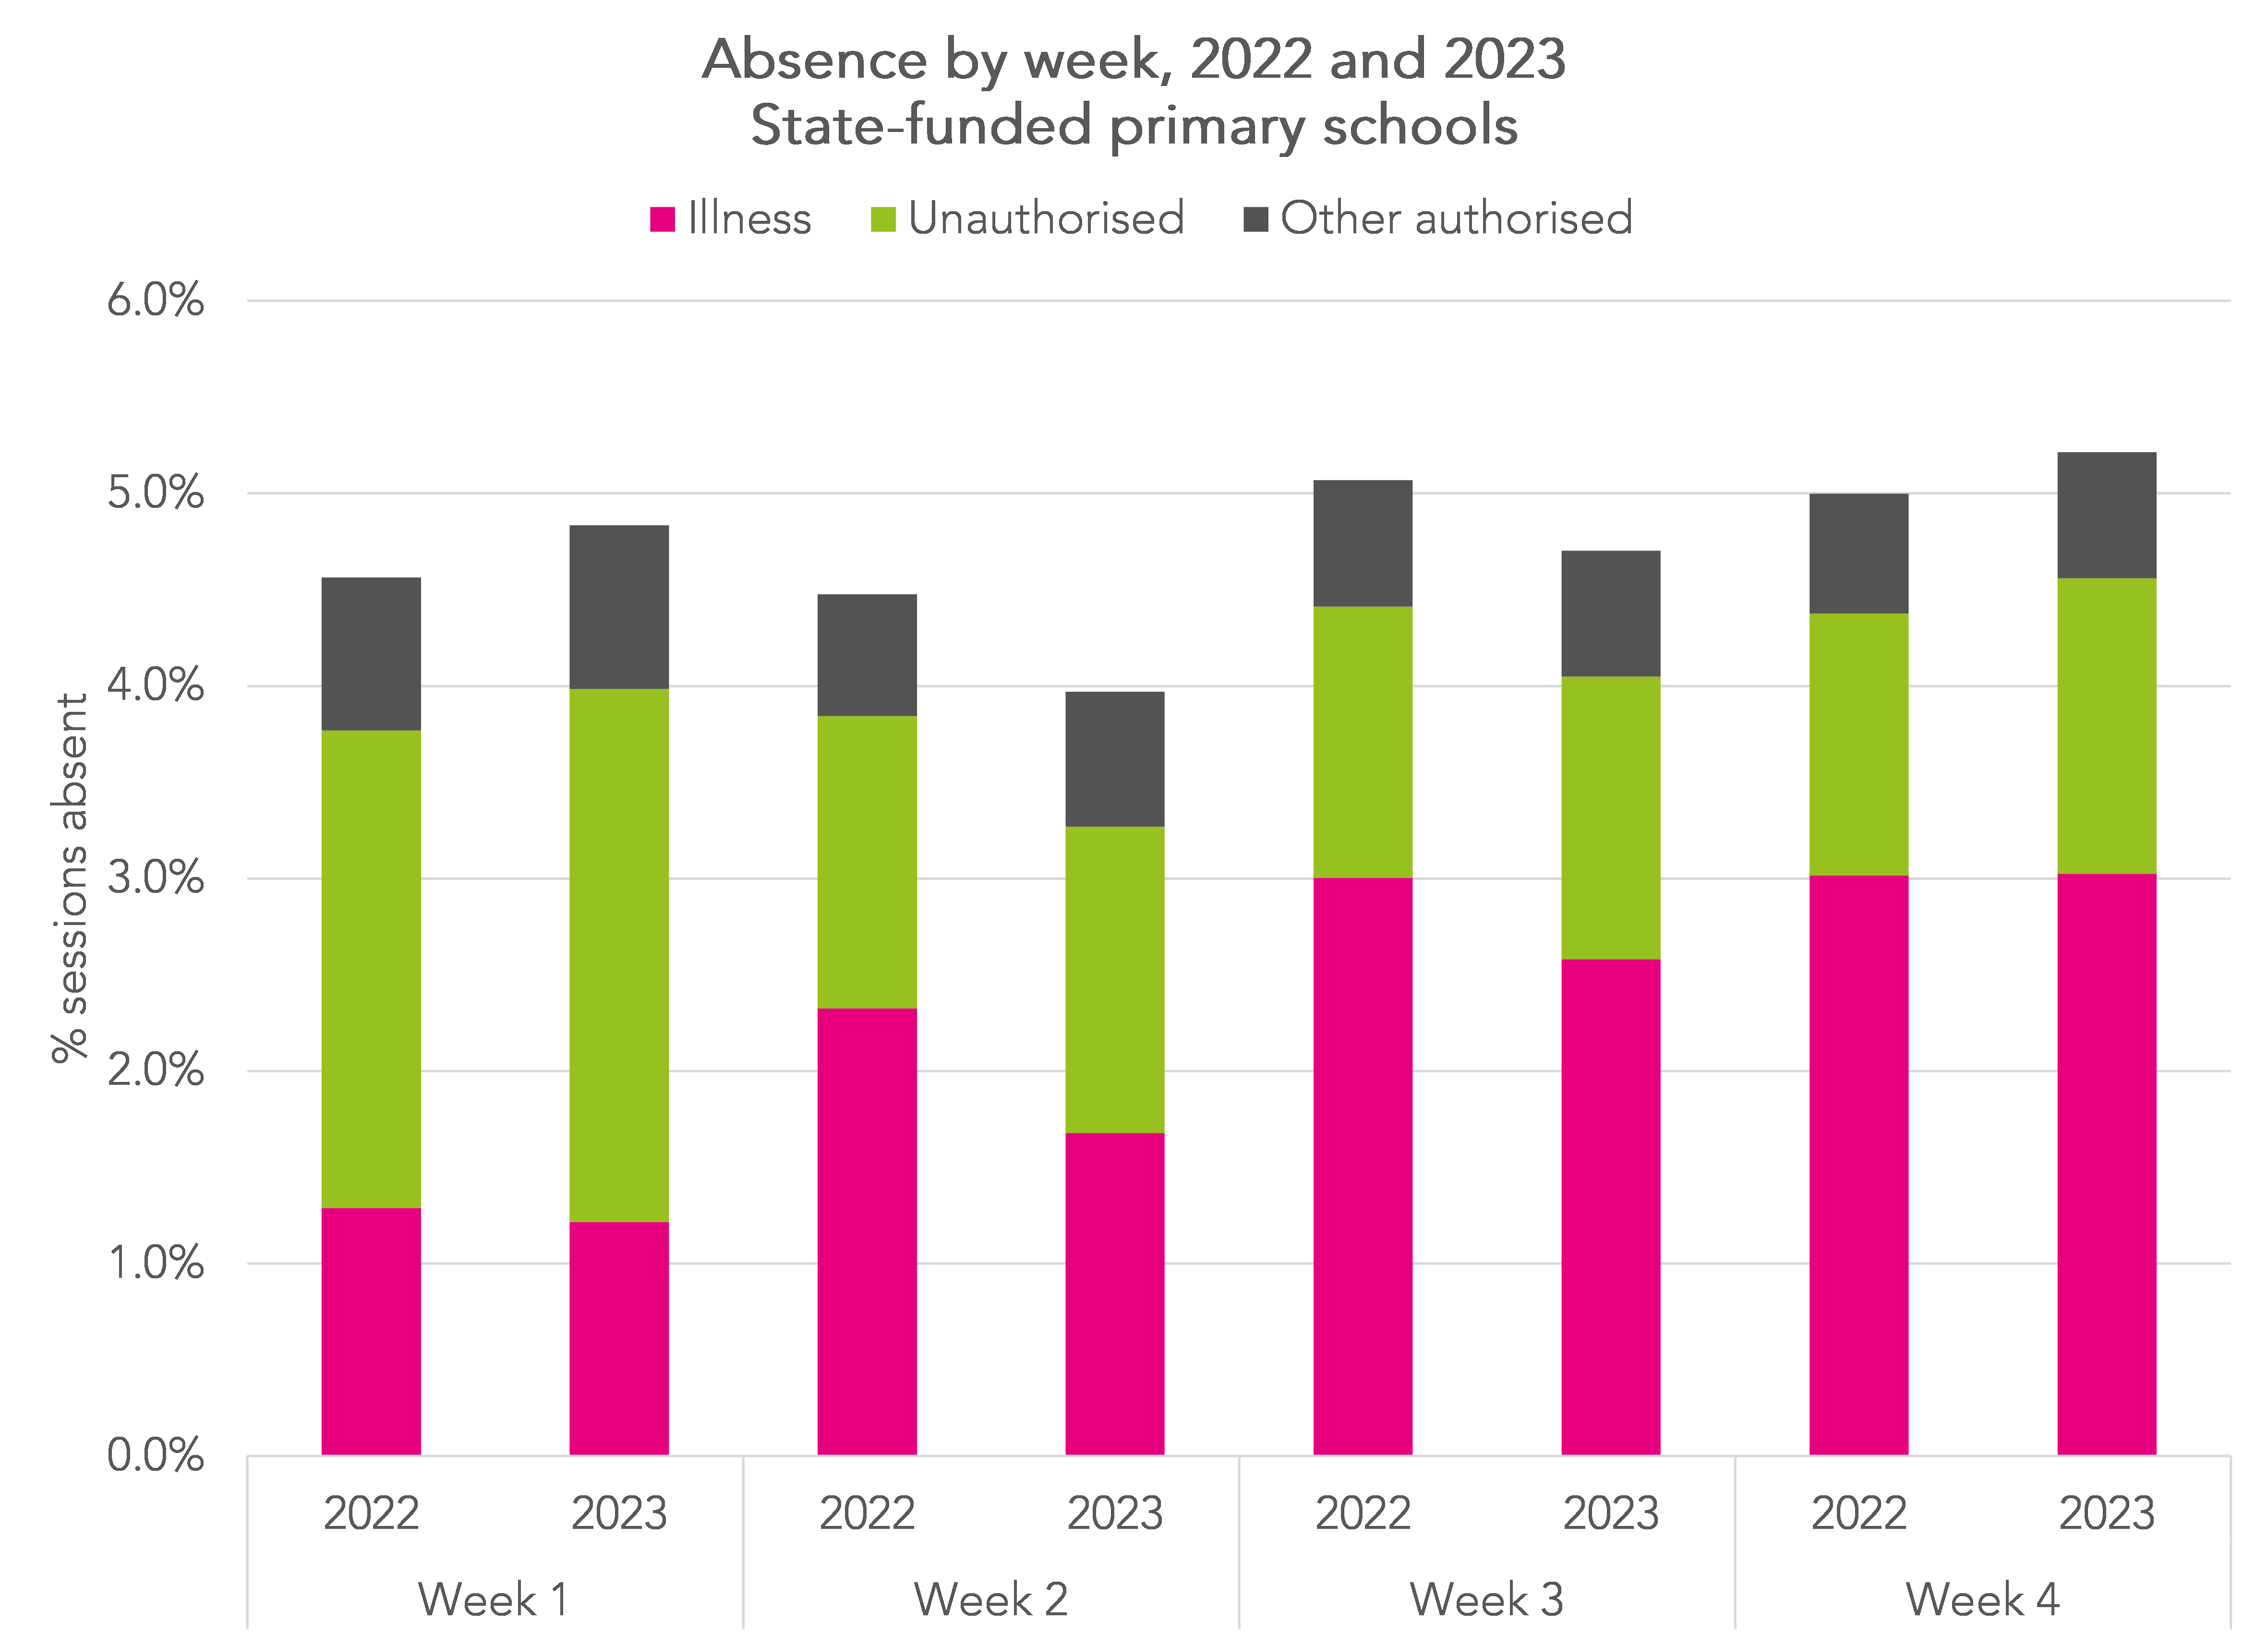
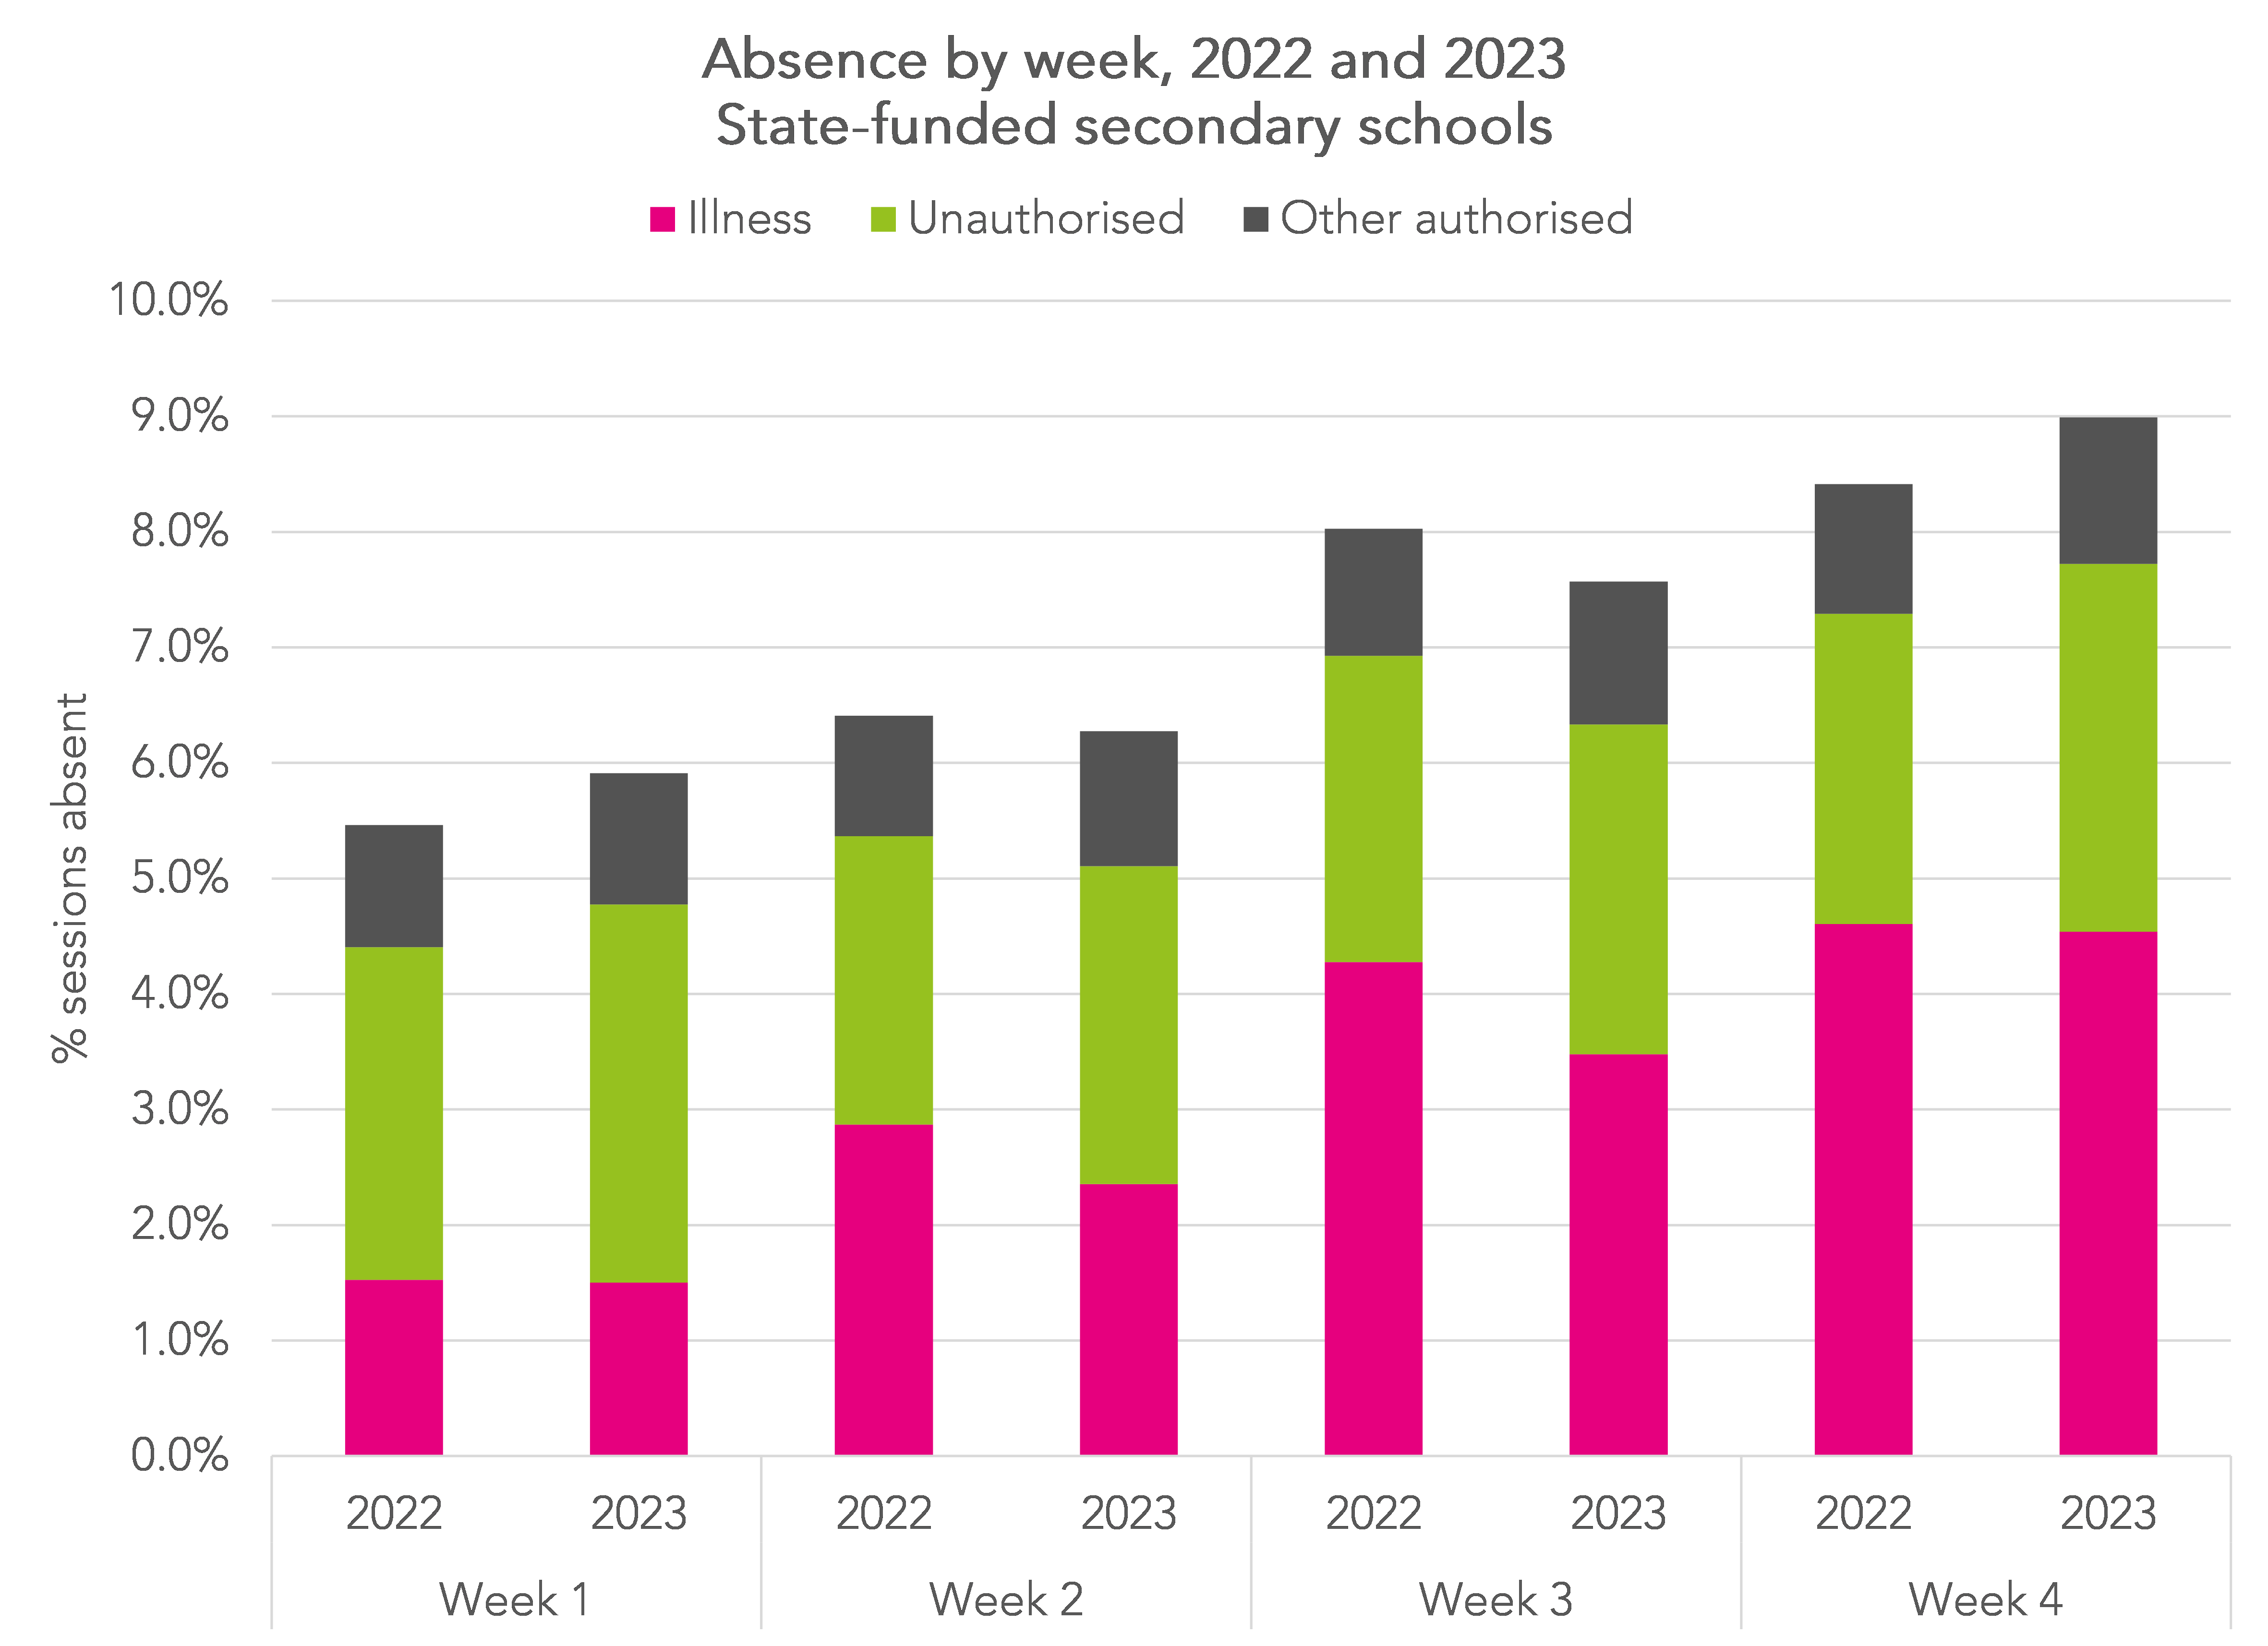
Weekly absence statistics tend to exhibit a common pattern, gradually increasing towards the end of each half term. It then falls at the start of the new half term before rising again. We would therefore expect the absence rate to continue to climb over the next few weeks.
Summing up
Absence this year appears to have increased compared to last year in secondary schools in most regions and in primary schools in the north of England.
Just under half of absence among pupils in Year 8 and below was due to illness. However, we do not know what sort of illness this is. How much is due to Covid-19? How much is due to mental health/ anxiety? Perhaps the Select Committee’s recommendation to introduce an authorized mental health absence code would be helpful.
Want to stay up-to-date with the latest research from FFT Education Datalab? Sign up to Datalab’s mailing list to get notifications about new blogposts, or to receive the team’s half-termly newsletter.


Is it possible to see demographic data I.e. send, pupil premium?
Yes, we’ll include something on this in the end of half-term round-up.