After an Autumn Term which saw some of the highest levels of absence since the start of the pandemic, the first half of Spring Term represented a big improvement. In this post, we look at how the rest of the term panned out.
As usual, the data we use comes from our 10,000 Attendance Tracker schools.
Weekly absence since the start of the year
First, let’s start by plotting weekly absence[1] across Autumn and Spring Terms.

Fortunately, we’ve not seen the levels of absence recorded at the end of Autumn Term (driven by a rapid rise in illness) repeated in Spring.
However, we might have hoped that absence in the second half of Spring Term would be lower than the first, perhaps due to a decrease in seasonal illnesses. But we see that this was not the case. At both primary and secondary, absence in the second half of the term remained roughly the same as the first. As a result, although better than the same period last year, absence across Spring Term at both primary and secondary remains some way above pre-pandemic levels. (6% at primary this year compared with 7.7% last year and 4.1% in Spring 2019; 9.1% at secondary this year compared with 10.7% last year and 5.6% in Spring 2019.)
Let’s look at weekly absence so far this year by region too. Here we plot primary and secondary on the same chart.
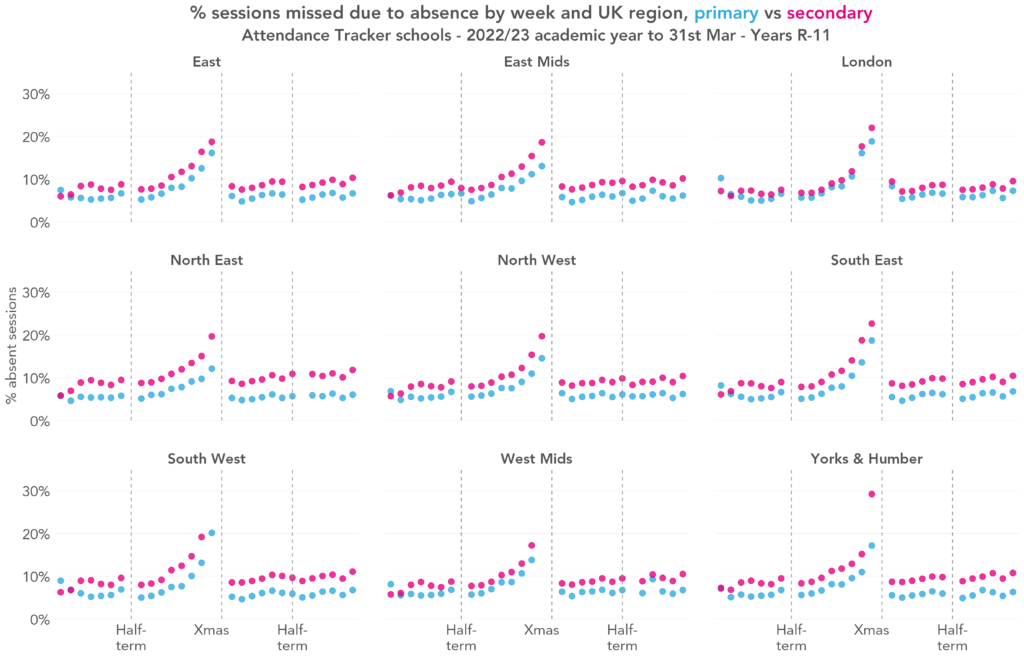
We see the national pattern mirrored in each region – a big peak just before Christmas followed by lower, fairly steady levels of absence throughout Spring Term. The biggest difference between primary and secondary in Spring Term was in the North East, and the smallest in London.
Persistent absence
Moving on to persistent absence, let’s compare this year with last year and pre-pandemic. This time, we’ll look at Autumn and Spring Terms combined.
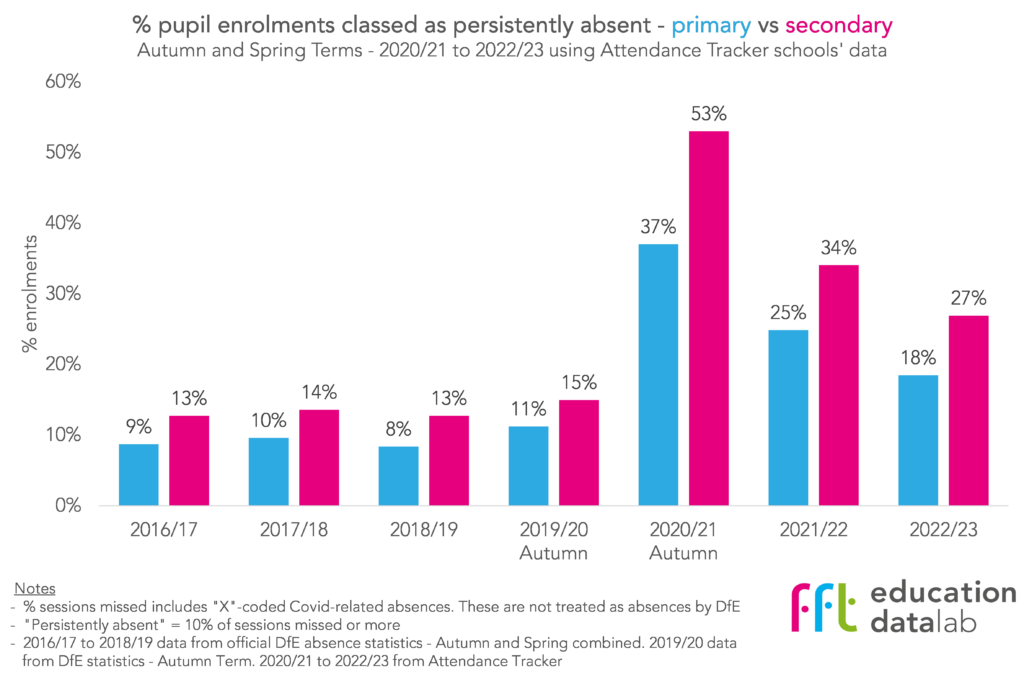
So far this year, 18% of primary pupils and 27% of secondary pupils are classed as “persistently absent”, having missed at least 10% of sessions. This is an improvement on the same period last year, but is around double the pre-pandemic rate.
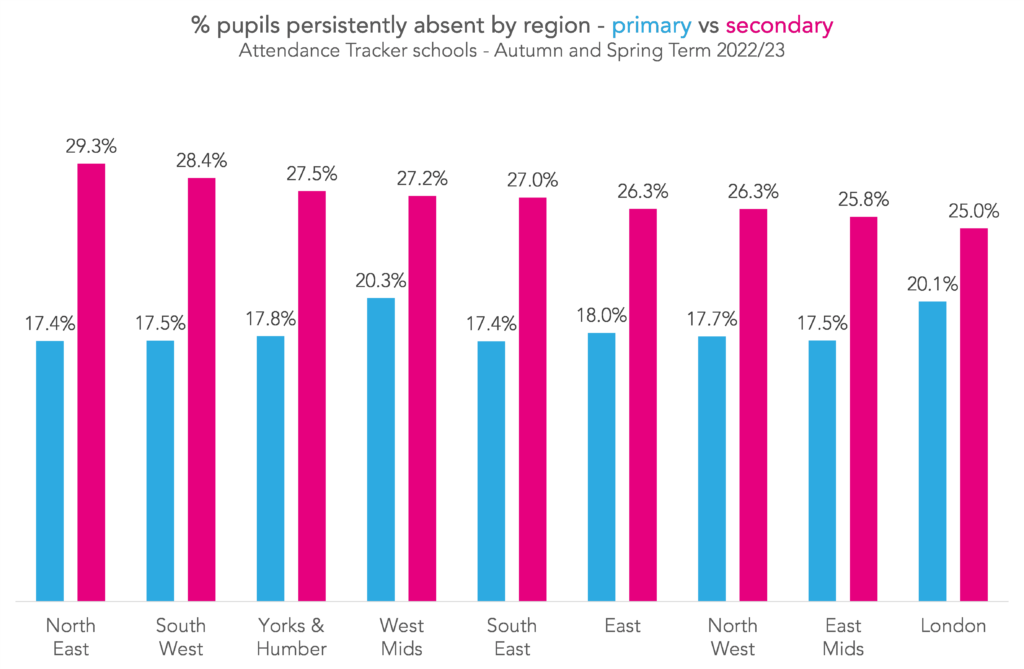
Let’s see how this varies across the country.
Aspire Attendance Tracker
Schools can track, analyse and compare their attendance data against 1,000s of other FFT schools using Aspire Attendance Tracker.
Log in to Aspire to access Attendance Tracker – log in here.
Not an FFT Aspire user? Learn more here.
At secondary, rates of persistent absence so far this year have been highest in the North East (29% of pupils) and lowest in London (25%). At primary, seven of the nine regions had rates within 0.6 percentage points of each other, ranging from 17.4% to 18%. In London and the West Midlands, however, around 20% of pupils were persistently absent.
Summing up
Absence in the second half of Spring Term has continued in much the same vein as the first – slightly down on last Spring but still higher than pre-pandemic.
This is true too for persistent absence which, despite being around seven percentage points lower than last year, remains around double pre-pandemic rates.


Leave A Comment