When we looked at absence in the first half-term of this year, we saw that although levels were still some way above pre-pandemic, they were a big improvement on last year.
Let’s see how the rest of term panned out.
Absence compared with last year
First, we’ll plot absence by week across Autumn Term up to the end of last week (9th December) and compare with the same period last year. As usual, we’ll be using data from our 10,000 Attendance Tracker schools.
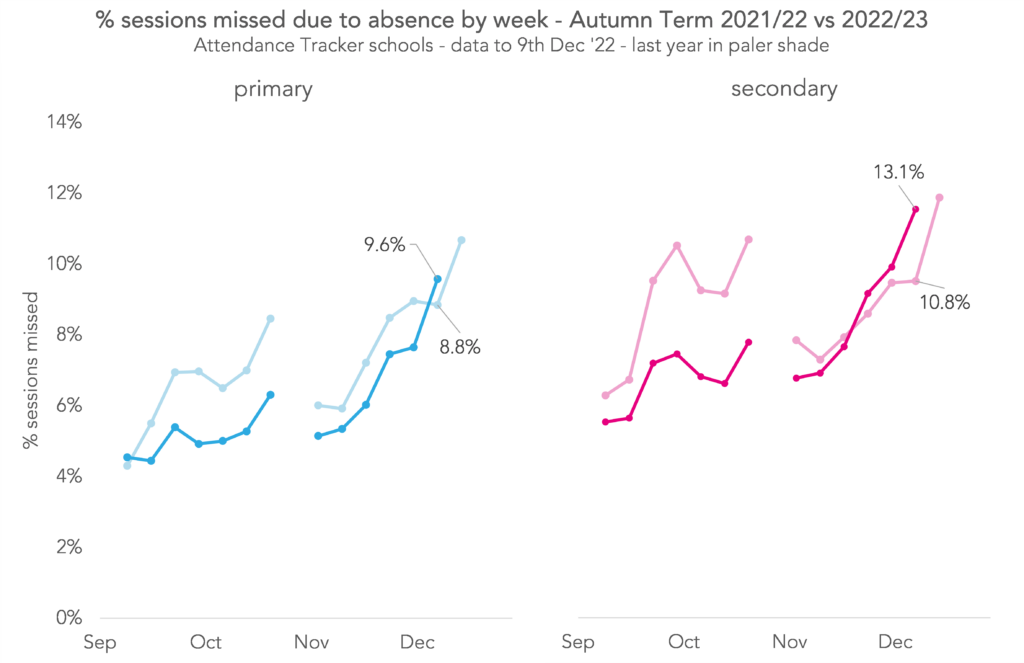
From the half-term break we see a similar trend to last year, with absence increasing each week. At primary, absence tended to stay just below last year’s levels, while for secondary, the two lines track each other fairly closely.
Over the whole term, absence was lower this year than last (6.0% vs 7.0% for primary, and 8.6% vs 9.8% for secondary) but still higher than pre-pandemic (around 4.3% for primary and 5.6% for secondary).
There was a big week-on-week increase in the most recent week (ending 9th December) that we didn’t see last year. However, there was a big week-on-week increase in the final week of term last year.
What could be driving this? Well, as most absence tends to be due to illness, it makes sense to look there. Let’s draw the same plot as before, but restrict ourselves to illness related absence:

Indeed, there was a big increase in illness related absence in the most recent week – to 7.1% of sessions missed at primary and 7.8% at secondary[1]. More broadly, we see this type of absence increase every week since the half-term break. We saw this happen after the summer holidays too, but then it seemed to level out after a few weeks. Not so this time.
To put these figures into context, we show the five weeks with the highest rates of illness related absence since the start of last academic year.
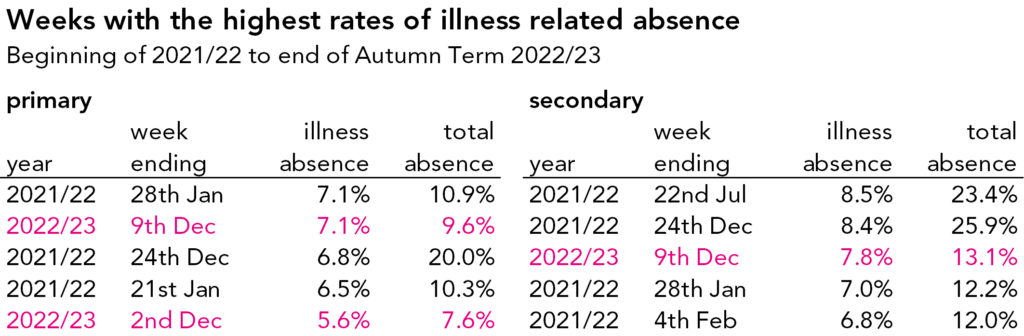
Not only are we currently seeing the highest rates of illness since the start of this academic year but, at both primary and secondary, we’re seeing some of the highest rates since the start of last academic year. (Note that one of the primary weeks and two of the secondary weeks are short “end of term” weeks when many schools would have already broken up – we tend to see unusually high rates of absence in weeks like those.)
Over the whole term, illness related absence was roughly the same as last year for primary pupils (around 3.8%) and slightly lower for secondary (4.4% vs 5.0%). Pre-pandemic, illness related absence was 2.6% at primary and 3.1% at secondary.
Regional variation
To see whether this picture is the same across the country, we plot this year’s illness related absence each week by region.

We do see a similar pattern across the regions – increasing illness related absence since the half-term break. However, the increases seem to be sharper in some regions than others. The South West and South East have seen particularly big rises, while the North of the country – the North East, North West and Yorkshire and the Humber – seem to have fared better. Of course, “better” is relative – all regions have seen much more illness related absence than pre-pandemic.
Persistent absence
We’ll finish by looking at the latest rates of persistent absence. Below we plot the percentage of pupils who have missed at least 10% of sessions so far this year, and compare with the same period last year. We break the data down by year group. Firstly, primary:

Lower overall absence this year has led to lower persistent absence too. The decrease compared with last year was bigger for older pupils than younger – for Year 6 pupils it was 10 percentage points (pp) and for Year 1 pupils, 4pp.
And for secondary:
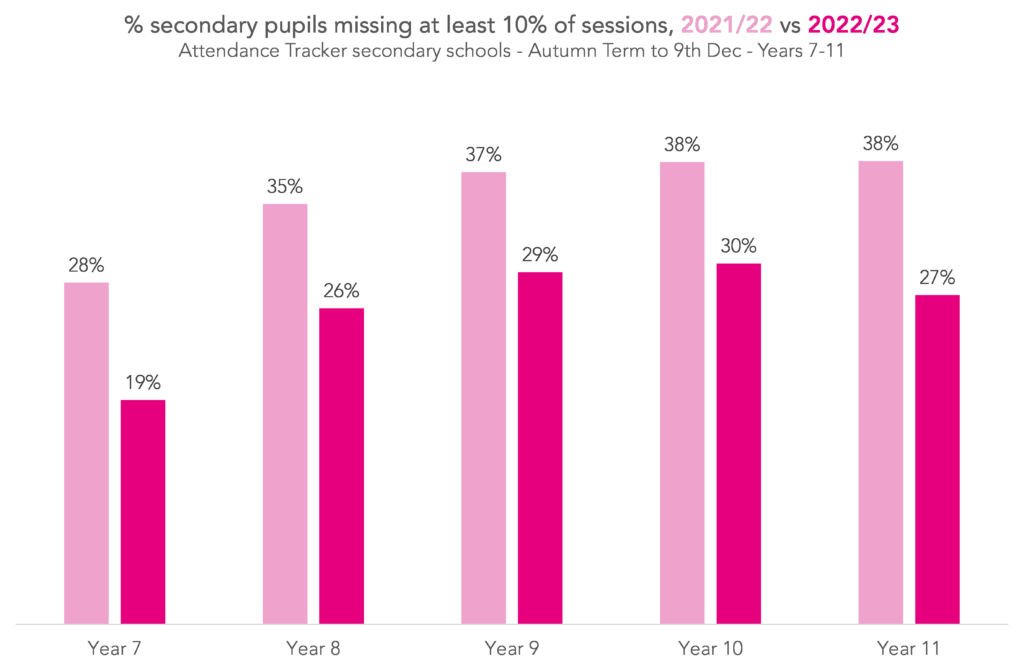
Again, persistent absence was lower this year compared with last year. For most year groups, the decrease was around 8-9pp, apart from Year 11 where it fell 11pp.
We can also look at how persistent absence has changed by disadvantage. Here we plot persistent absence this year and last, separately for disadvantaged and other pupils.
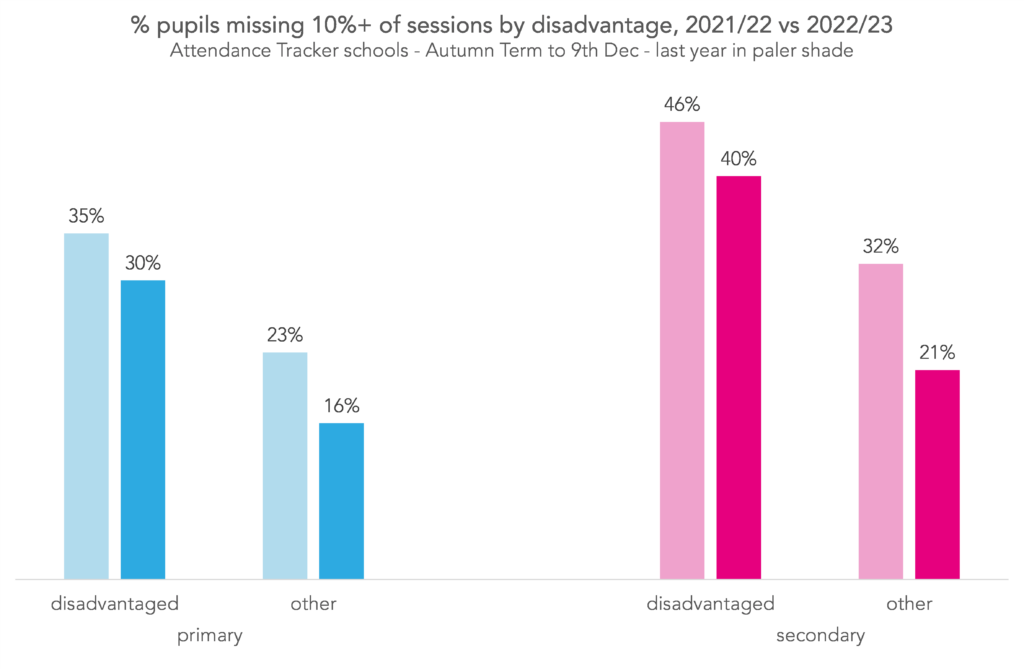
At both primary and secondary, persistent absence decreased for disadvantaged and other pupils. However, the decrease was smaller for disadvantaged pupils – at primary, there was a decrease of 5pp for disadvantaged pupils and 8pp for others, and at secondary, 6pp for disadvantaged pupils and 11pp for others.
Although persistent absence has decreased across the board, it remains high compared with pre-pandemic. In Autumn 2019, primary persistent absence was around 11% and secondary around 15%. This year it’s 20% for primary and 26% for secondary.
Aspire Attendance Tracker
Schools can track, analyse and compare their attendance data against 1,000s of other FFT schools using Aspire Attendance Tracker.
Log in to Aspire to access Attendance Tracker – log in here.
Not an FFT Aspire user? Learn more here.
Summing up
Across Autumn Term as a whole, both absence and persistent absence are lower this year than last year but remain some way above pre-pandemic levels.
There have been large increases in illness related absence in the last couple of weeks as winter bugs take hold – something we didn’t see to such an extent last year even as the omicron COVID variant was emerging.
School absence tends to follow a regular pattern, gradually increasing as each term progresses but then falling at the start of the following term. The Christmas break will be an opportunity for many to recover, relax and recharge for the year ahead.
[1] It’s likely that this is an undercount, too. Because schools will still be chasing reasons for absence in the most recent week/s.
Want to stay up-to-date with the latest research from FFT Education Datalab? Sign up to Datalab’s mailing list to get notifications about new blogposts, or to receive the team’s half-termly newsletter.


Thank you for this very helpful data report.