To mark the last day of a difficult term for some, and the middle weekend of a well-deserved break for others, we’ve put together a selection of insights into pupil absence. The data we’ve used comes from schools subscribed to Aspire Attendance Tracker – around 2,600 secondary and 6,200 primary schools.
Absence remains stubbornly high in most regions
Despite a promising start to this half-term, absence has been rising steadily over the last few weeks. In the chart below we plot the percentage of sessions missed at primary and secondary each week since the start of the academic year (counting X-coded COVID isolation sessions as absences).

We see a similar pattern in almost all regions since half-term. The first week back saw absence rates among the lowest since the start of the academic year, but since then they’ve risen to rates similar to those seen in the run-up to Christmas.
Over 100 secondary schools had to send a year group home last Friday
The attendance guidance for schools lists a set of exceptional circumstances under which pupils do not have to attend school:
- The school site, or part of it, is closed due to an unavoidable cause; or
- The transport provided by the school or a local authority is not available and where the pupil’s home is not within walking distance; or
- A local or national emergency has resulted in widespread disruption to travel which has prevented the pupil from attending school; or
- The pupil is in custody; detained for a period of less than four months.
In these circumstances, code Y is recorded in attendance registers. These sessions do not count towards absence statistics, either as absence or attendance.
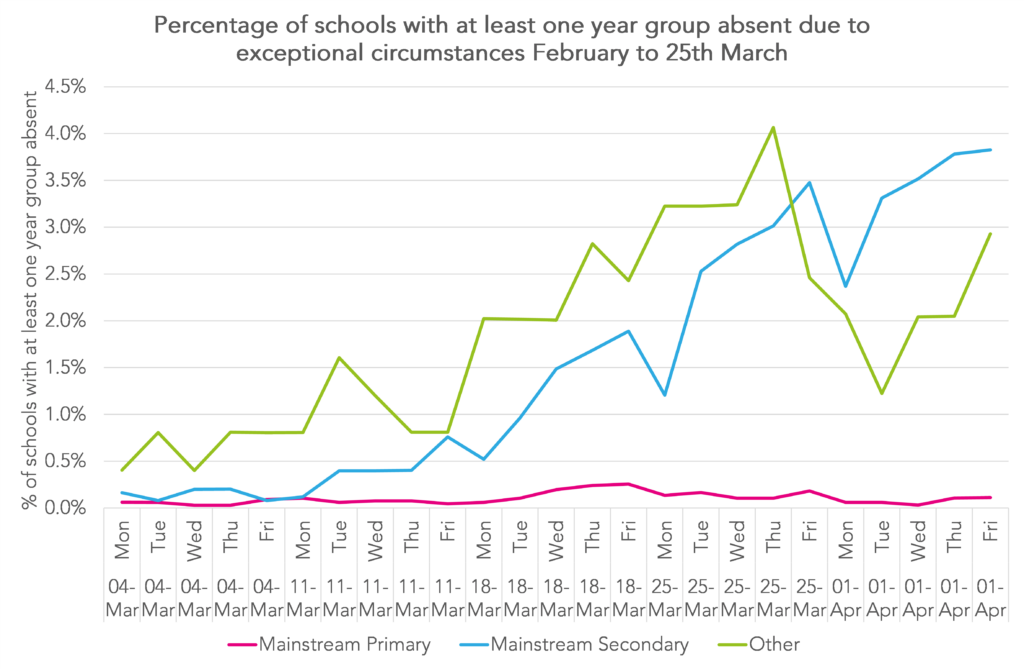
In the chart below, we show the percentage of schools with at least one year group (Years 1 to 11) in which the vast majority of pupils are recorded as Y on the register. The period shown is the five weeks between 28th February and 1st April.
Over the period shown, we see a gradual increase in the percentage of mainstream secondary schools with at least one year group absent in exceptional circumstances. On Friday 1st April this stood at 3.8%. Assuming 3,500 mainstream secondary schools then this suggests there were 133 schools with at least one year group absent in exceptional circumstances.
Rates of severe absence vary depending on how you measure them
Last week’s White Paper sets an expectation that schools and local authorities work together to “re-engage children who are ‘severely absent’” (i.e. are absent for more than 50% of sessions).
As we’ve written about before, we don’t really have a good idea of just how many children in schools are severely absent. This is because published DfE statistics are of “pupil enrolments” rather than pupils. A pupil who moves from one school to another during the course of an academic year would have two enrolments and could be classified as a persistent absentee for one enrolment and not the other. To use an extreme example, a pupil mistakenly enrolled at a school for a single day and who did not attend would be classified as severely absent (and persistently absent) in published statistics.
Let’s look at what difference this makes using our own data. We show rates of persistently (and severely) absent pupils based on a) all enrolments and b) pupils on roll at their school for the whole year).
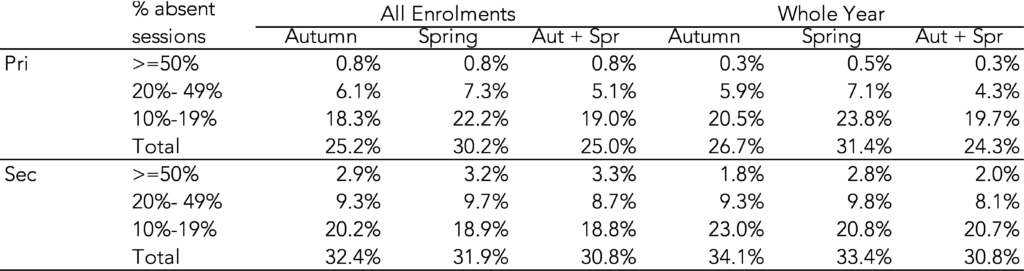
In terms of persistent absentees (all pupils missing at least 10% of sessions) it makes little difference whether you look at the “all enrolments” or “whole year” figures for Autumn and Spring combined. 25% of primary aged pupils and 31% of secondary aged pupils missed at least 10% of sessions.
But for severely absent pupils it makes quite a difference. In primary schools, the “whole year” figure is a third the size of the “all enrolments” figure.
Grossed up to the full national population, the “whole year” figures would equate to 74,000 pupils and the “all enrolments” figure to 136,000 pupils.
Of course, the best thing to do would be to calculate absent measures for each pupil regardless of how many enrolments they have. But we do wonder whether some of the absence data for pupils who leave a school is accurate, for instance in cases where a pupil does not attend school for at least 20 days and their whereabouts cannot be established.
Aspire Attendance Tracker
Schools can track, analyse and compare their attendance data against 1,000s of other FFT schools using Aspire Attendance Tracker.
Log in to Aspire to access Attendance Tracker – log in here.
Not an FFT Aspire user? Learn more here.
Pupils who missed lots of school last year isolated more frequently in Autumn term this year
Back in February, Ofsted released a report called “Securing good attendance and tackling persistent absence”. It contained observations and reflections from schools who have “improve[d] attendance from a low baseline”.
Tucked away in the “New Challenges” section, was an observation of “possible COVID” appearing to be “used as an excuse” for absence by some families whose children are usually poor attenders.
We thought we’d test this observation. In the chart below we summarise the number of separate instances of COVID isolation absence (X-coded absence, including DfE subcodes) observed for pupils in Autumn 2021. The grey bar shows the average for all pupils, the blue bar the average for pupils who had no absence last year[1] and the pink bar the average for pupils who were in the top 10% last year in terms of % of sessions missed.
In calculating last year’s absence rates, we’ve not counted X-coded COVID isolation as absences because we didn’t want to capture the phenomenon of pupils who spent more time isolating last year also isolating more frequently this year.
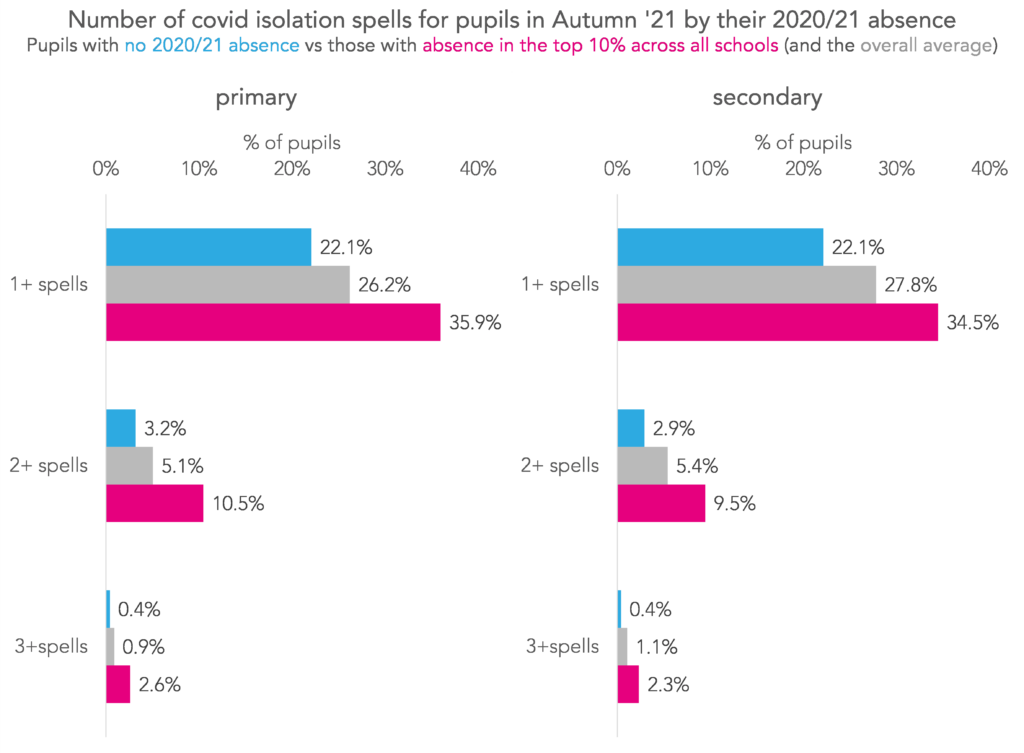
We see that pupils with the highest absence rates last year were more likely than those with the lowest absence rates to miss school this year due to COVID isolation – 22% of those with the lowest absence rates last year missed at least one spell for this reason, compared with 35% of those with the highest.
They were also more likely to isolate multiple times – 3% of those with the lowest absence rates last year isolated at least twice, compared with around 10% of those with the highest.
Patterns are very similar between primary and secondary.
Ofsted make the case that pupils who are historically poor attenders may be using COVID as an “excuse” not to attend. Although the data would seem to support this, there could be other explanations behind these patterns. For example, pupils who are clinically vulnerable might have been more likely to be off sick last year and also more likely to need to isolate this year.
Year 11 and Year 6 missed less school in March than in the rest of the year
Year 6 and Year 11 pupils are always of particular interest when discussing pupil absence, but especially so now that we’re in the run-up to the first external exams since 2019. This is a particularly important period for Year 11 following the release of advance information by exam boards in early February.
Here we compare absence rates in March with those up to the end of February, to see how much disruption these year groups’ exam preparations have suffered so far. First, Year 11:
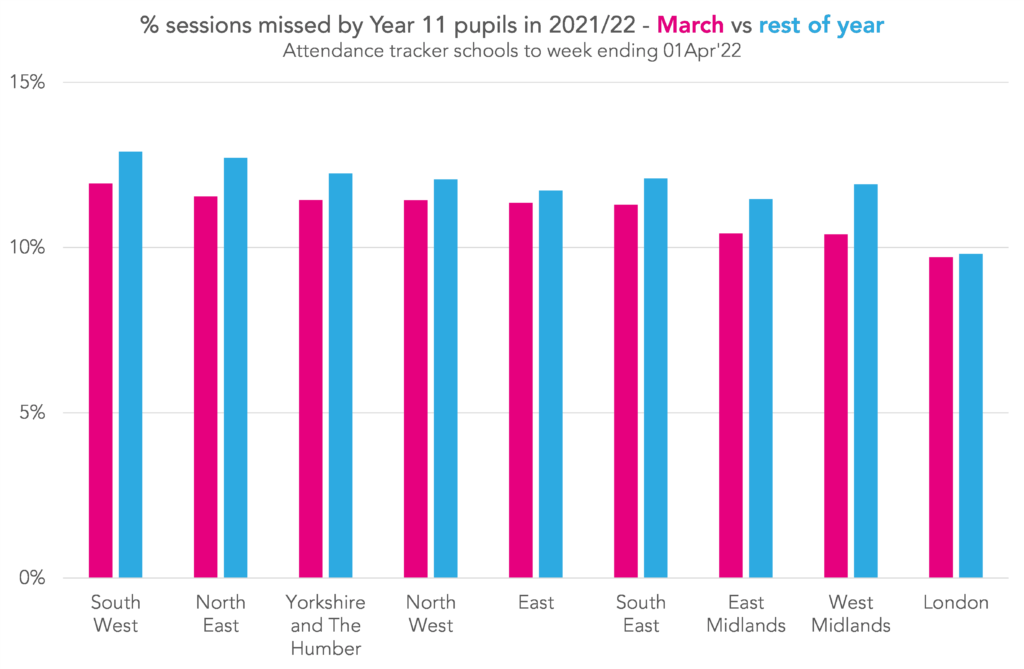
The good news is that all regions saw lower average absence rates in March than they did throughout the rest of the year. The bad news is that pupils still missed at least 10% of sessions in March in all regions apart from London.
Now Year 6:

Again, we see less absence in March than the rest of the year. The South West saw a much smaller improvement than elsewhere following a steep rise in absence in primary schools in recent weeks. The North East has seen the biggest improvement.
Beyond the disruption to preparation, there’s also the question of what will happen if absence remains at current levels during the exam period itself. Will the current system of GCSE exam dispensation be sufficient? And how valid will conclusions based on Key Stage 2 test results be if lots of pupils don’t receive a score due to absence?
Equally, if absence levels reduce because of the shorter recommended isolation period and the end of free testing, but COVID levels remain high, there’ll be plenty of COVID positive pupils keen to come to school to take their exams. It’s unclear whether we can expect advice for schools on how to manage this.
Want to stay up-to-date with the latest attendance research? Sign up to our mailing list to get notifications about new blogposts, or to receive our half-termly newsletter


Leave A Comment