At the end of last term we saw high levels of illness-related absence. In fact, the weeks leading up to Christmas had some of the highest rates of any week this academic year or last. In today’s post, we’ll look at absence in Spring Term so far to see whether things have improved.
As usual, we’ll be using data from our Attendance Tracker schools – around 2,700 secondary and 7,200 primary. And we’re using data up to the end of last week, 17th February.
Overall absence rates
To start, we’ll plot weekly absence rates so far this year, and compare with the equivalent week last year. These rates cover sessions missed for any reason[1].
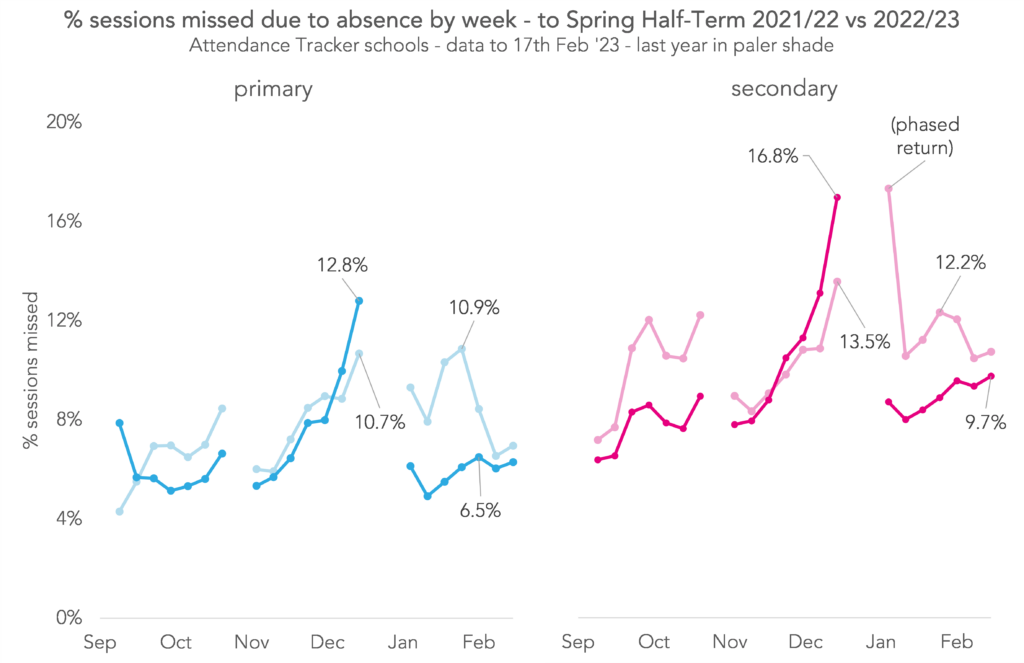
In the final full week of last term[2] absence at primary was around 13% and at secondary was around 17%, both some way higher than the equivalent week last year. Since the holidays, things seemed to have calmed down a little. The highest weekly rate at primary was 7%, and at secondary 10% (and, as both were recorded in the week of the 1st Feb teacher strikes, might be overestimated[3].)
Across Spring Term so far, primary pupils have missed around 6% of sessions and secondary around 9%. This is better than the same period last year, where primary absence was around 9% and secondary around 12%. Pre-pandemic, primary absence for Spring Term was around 4% and secondary around 6%.
Absence due to illness
The big peak in absence we saw towards the end of last term was driven by high rates of illness. As absence has decreased this term, we would expect illness to have done the same. But let’s see how far this is true.
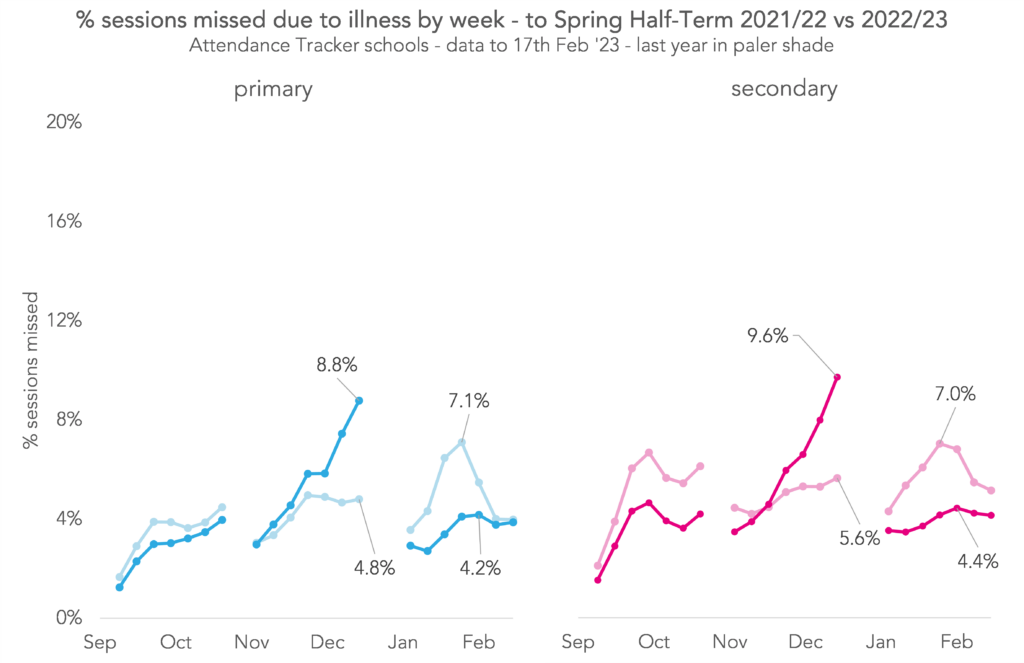
Indeed, at both primary and secondary, absence due to illness has decreased substantially since Christmas, and both are much lower than the same period last year (perhaps not surprising though, as January 2022 coincided with the first COVID omicron peak).
Generally, illness levels so far this term have been more similar to those seen in the first Autumn half-term than in the weeks leading up to Christmas.
The picture around the country
Now let’s see how things varied by region. We plot weekly absence rates (all reasons), with primary and secondary on the same chart. And we make one chart for each region. Here are the results:
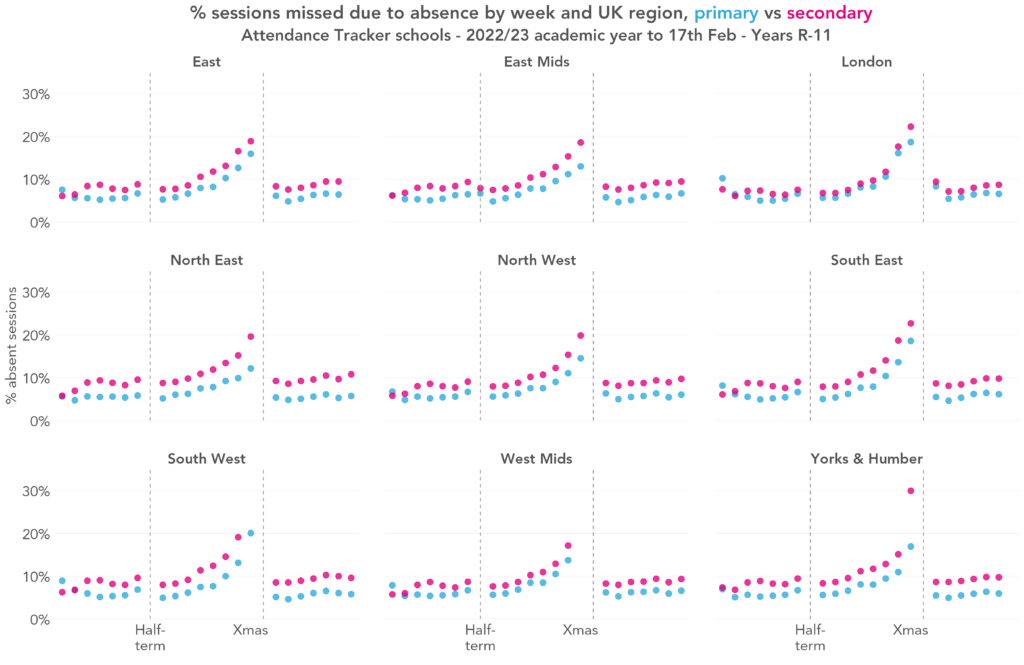
Since Christmas patterns of absence have been similar, even in the areas worst affected in the weeks leading up to the holidays. There are no notable peaks or troughs in any of the regions, with primary hovering between 5% and 6%, and secondary between 7% and 9%. Secondary absence in London tended to be slightly lower than the rest of the country.
When we average absence across the whole of Spring Term so far, we again see a lot of similarity between regions:
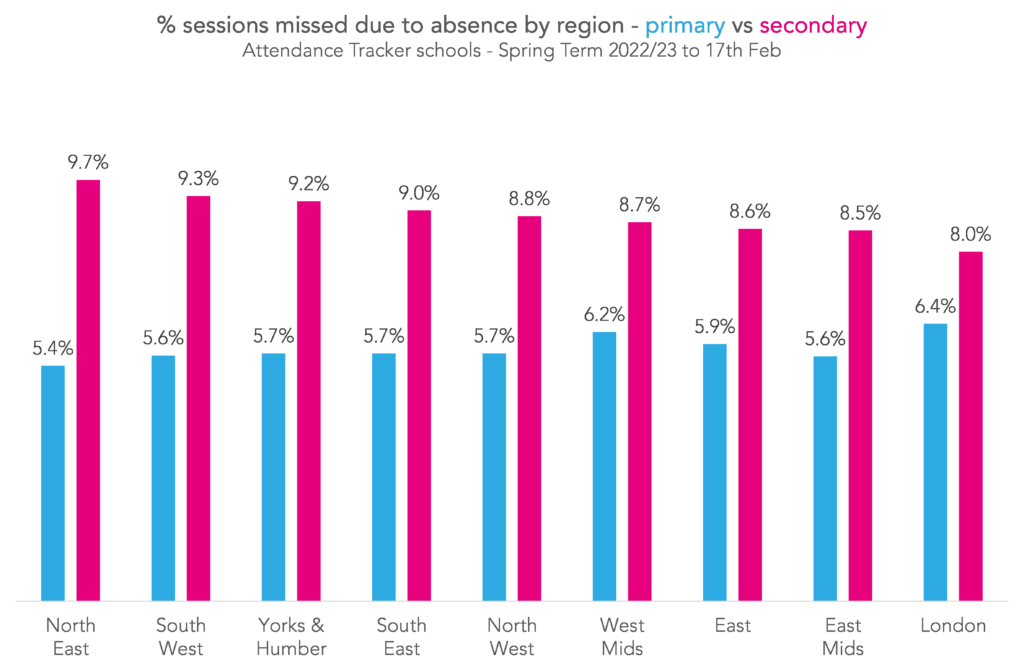
There was a difference of 1.7 percentage points (pp) between the region with the highest rate of absence at secondary (the North East) and the region with the lowest (London). At primary, the difference was 1.0pp. Interestingly, although London had the lowest secondary absence and the North East the highest, at primary their positions are reversed: London had the highest rate of absence and the North East the lowest.
Summing up
Absence rates this term have improved a lot compared with the last few weeks of Autumn Term. This has been driven by a big reduction in absence recorded as illness.
It’s hard to say for sure how things compare with pre-pandemic though. Historical data covers whole terms and we might expect absence to be higher in the winter months than the spring. If we see a further, sustained reduction in absence between now and Easter, though, Spring Term 2022/23 could be the first term since the pandemic where absence returns to “normal” levels. If we don’t, and absence in the second half term remains at similar levels to the first, then they’ll still be some way above.
Aspire Attendance Tracker
Schools can track, analyse and compare their attendance data against 1,000s of other FFT schools using Aspire Attendance Tracker.
Log in to Aspire to access Attendance Tracker – log in here.
Not an FFT Aspire user? Learn more here.
[1] Including sessions coded as “X” – a code used by schools for a portion of last year for pupils required to isolate due to COVID. Sessions coded as “Y” or “#”, usually indicating a full or partial school closure, are not counted as absences.
[3] This DfE publication (pdf) states that some schools may have used the “C” code (an absence which the school has authorised that doesn’t fall into one of the usual categories) in the register when their school was fully or partially closed. If they did this, we count it as an absence, because we can’t distinguish it from a “normal” absence. Additionally, because strike day was a Wednesday, and attendance tends to be highest on a Wednesday, even if schools didn’t use the “C” code for school closures, absence across that four-day week might be higher than if it had been a normal five-day week.


Leave A Comment