The most recent official statistics for exclusions and suspensions, published in July 2023, relate to the 2021/22 academic year.
This is largely because data is collected, via the School Census process, two terms in arrears. This means, for example, that data for the summer term 2022 was collected in the January 2023 School Census. Although the census date is the third Thursday in January, schools have until the middle of February to submit the data. The data is then published some months later.
Aspire Attendance Tracker
Schools can track, analyse and compare their attendance data against 1,000s of other FFT schools using Aspire Attendance Tracker.
Log in to Aspire to access Attendance Tracker – log in here.
Not an FFT Aspire user? Learn more here.
Exclusions and suspensions data for the 2022/23 academic year will only be published next July.
However, we can get a handle on whether they have increased or not by examining school absence codes.
Data
Pupils who are permanently excluded or suspended but who remain on the school roll are marked as code E in registers for up to five days. From the sixth (consecutive) day, alternative provision is supposed to be arranged.
Using attendance data for 2021/22 and 2022/23 supplied by 10,000 schools subscribing to FFT Aspire Attendance Tracker, we can summarise rates of absence due to exclusion and suspension for both 2021/22 and 2022/23.
Sessions missed due to exclusion/ suspension
Firstly, we summarise the percentage of sessions (half-days) missed due to exclusion or suspension.
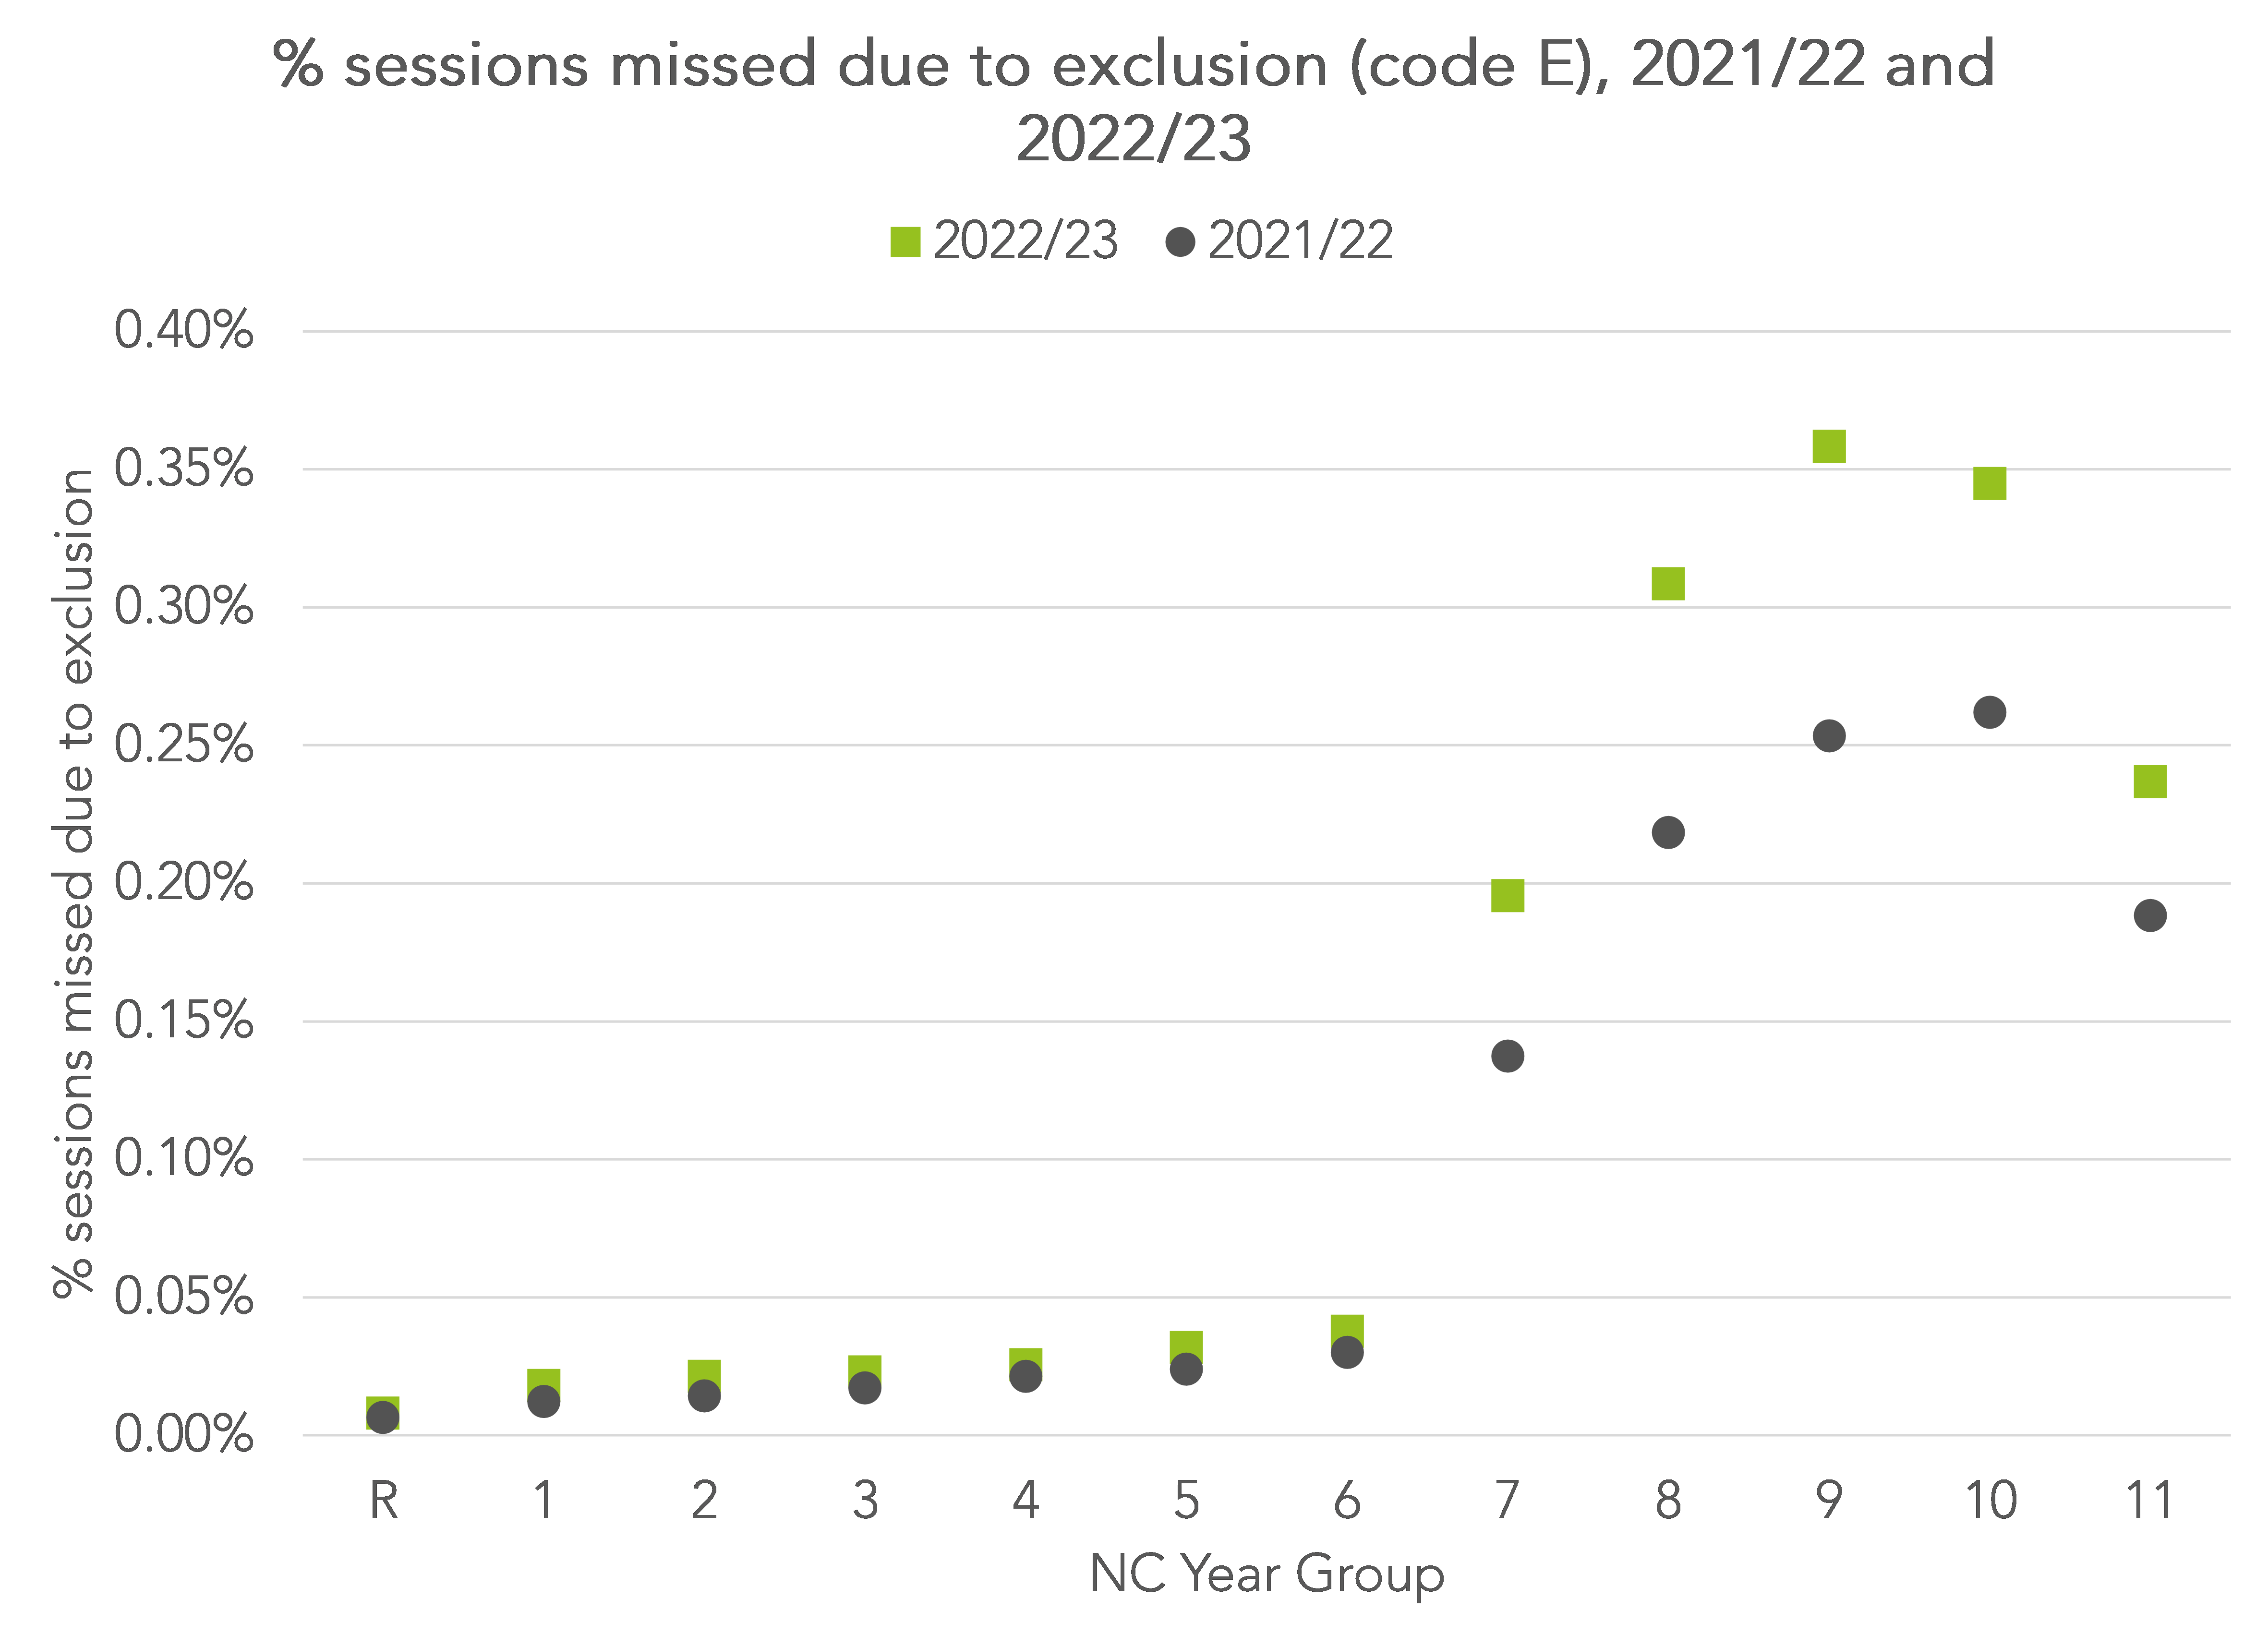
The vast majority of these absences will be due to suspension rather than permanent exclusion. According to official statistics, there were 89 suspensions for every permanent exclusion in 2021/22.
Rates were higher in 2022/23 across all year groups, particularly in Year 9. Pupils in Year 9 missed 0.36% of sessions due to exclusion / suspension in 2022/23 compared to 0.25% of sessions the year before.
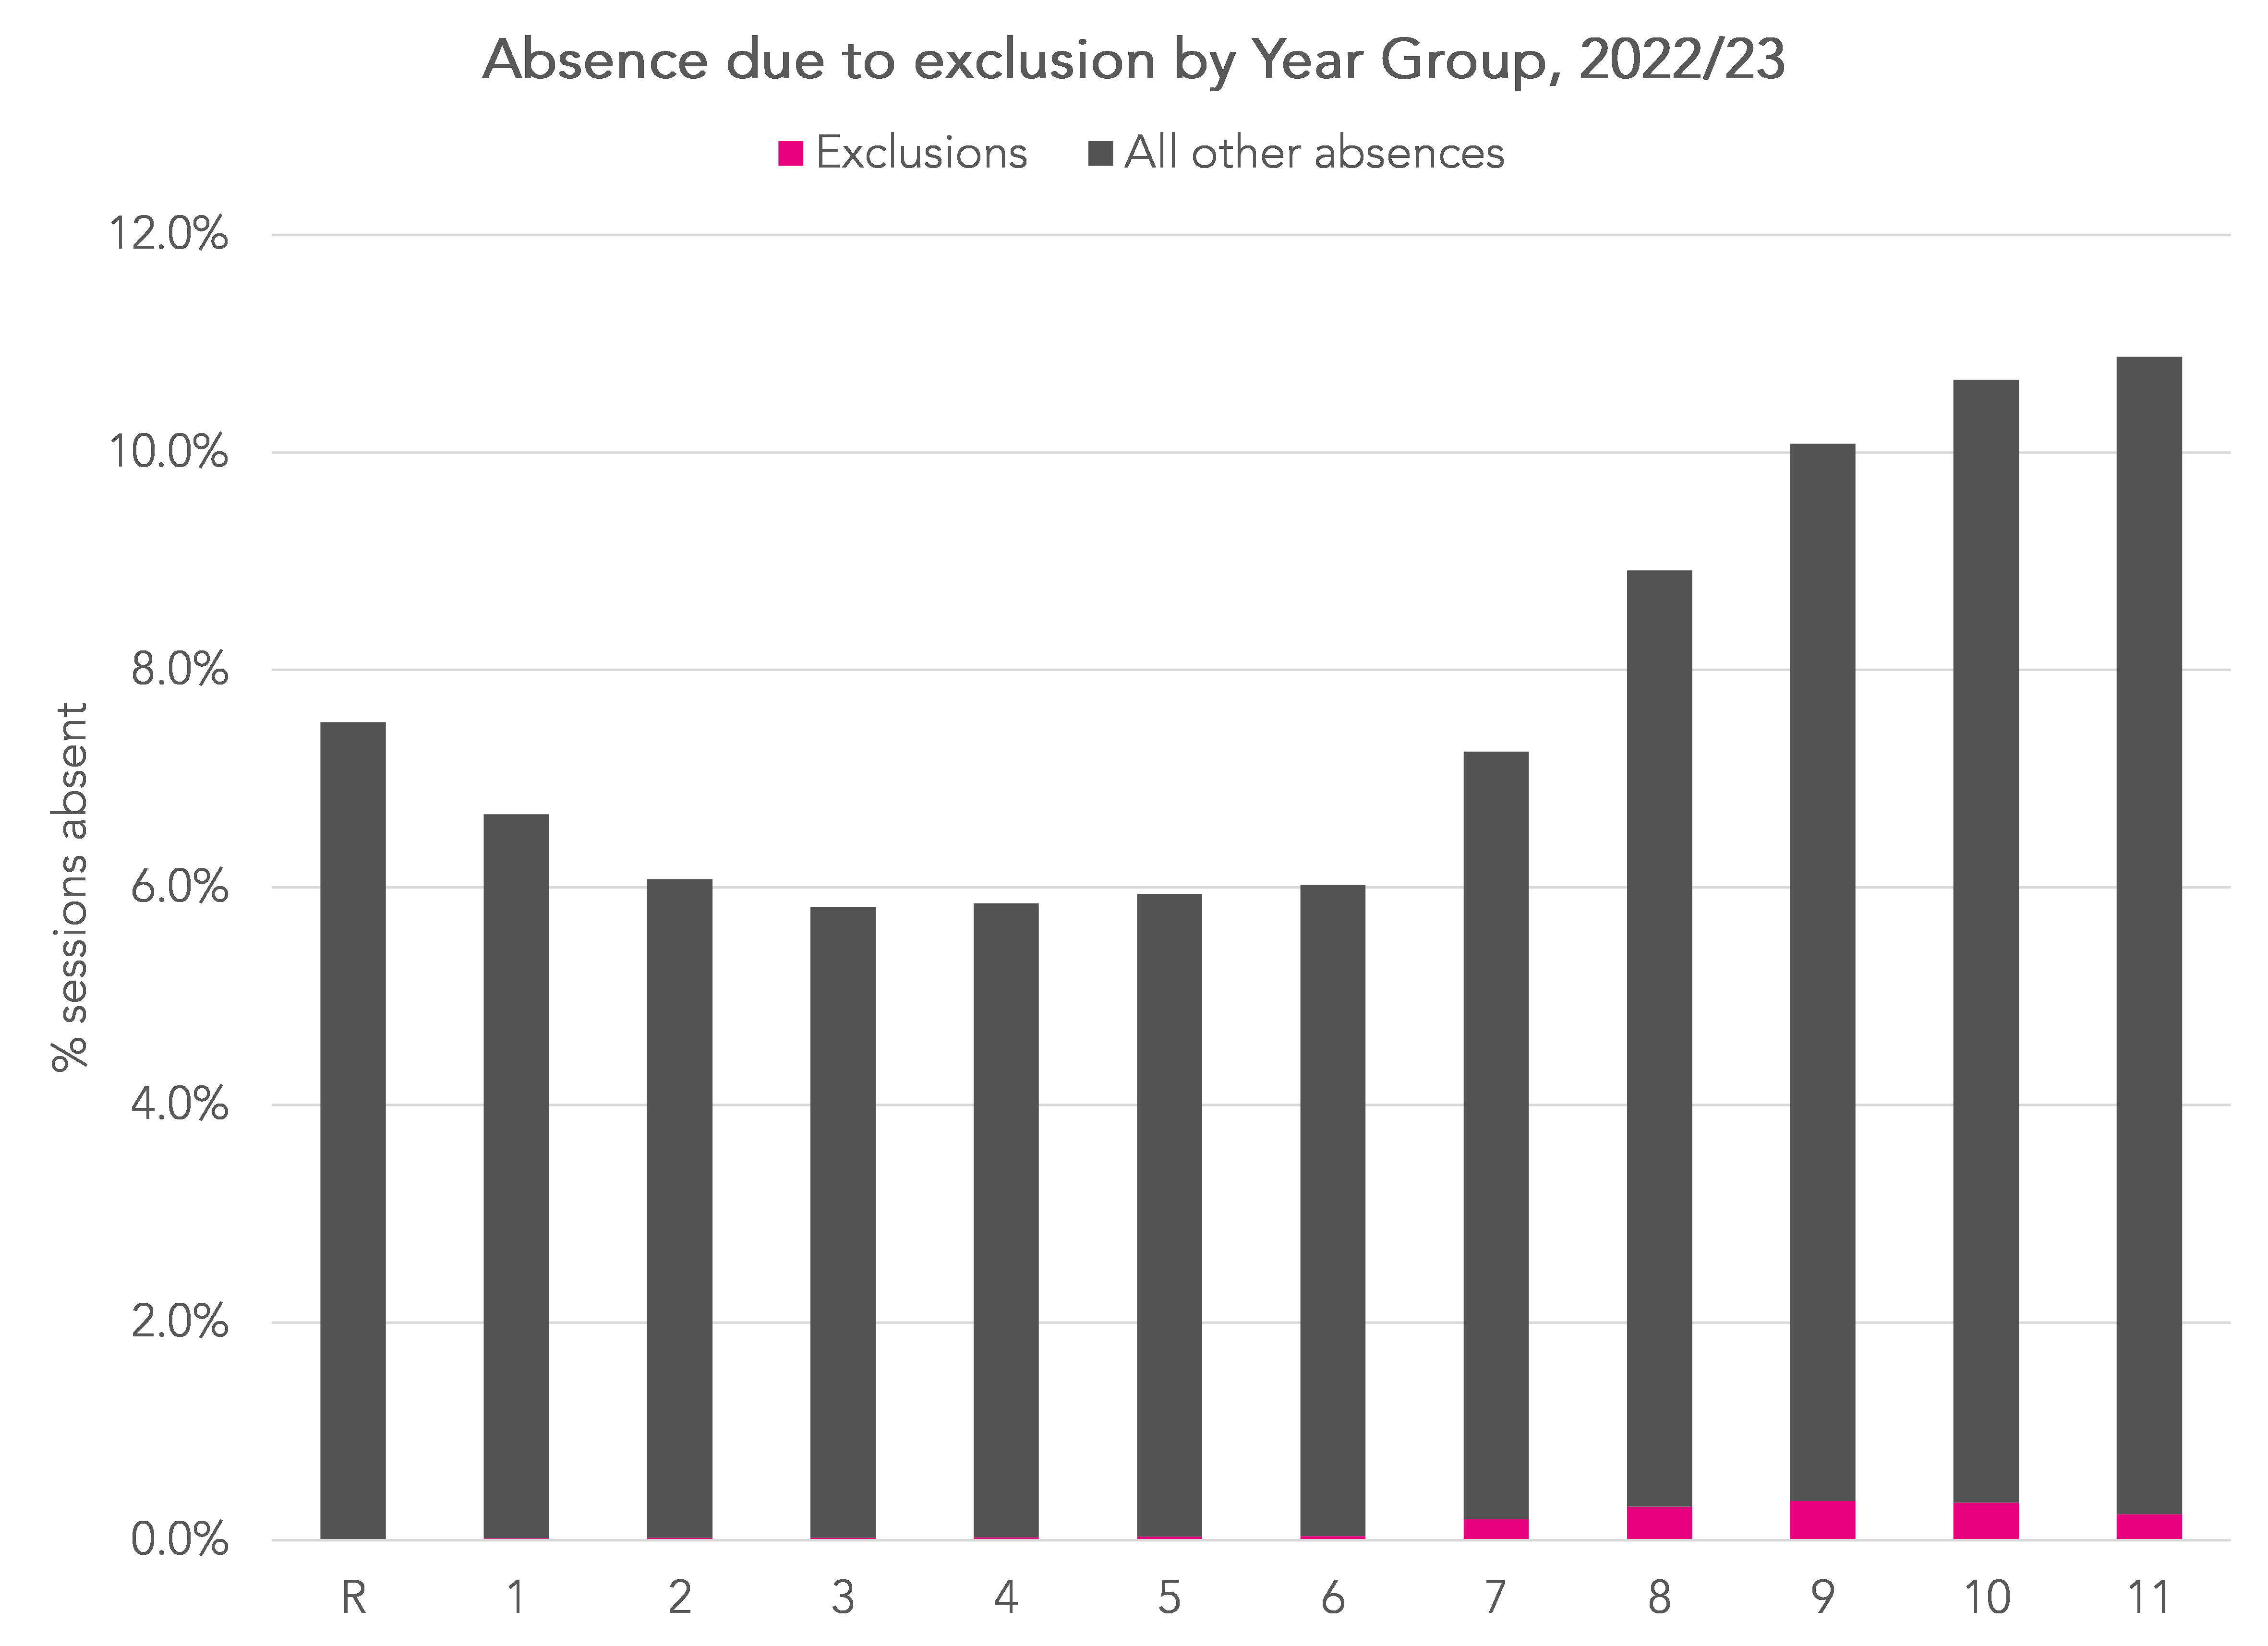
Although this is a relatively large increase, it is worth bearing in mind that absence due to exclusion / suspension is only a small contributor to overall rates of absence as indicated in the following chart.
Pupils experiencing one or more exclusions/ suspensions
The increase in absences for exclusion / suspension may indicate either a) that more pupils experienced exclusion/ suspension b) pupils were suspended more frequently or c) that suspension durations increased. Official statistics for 2022 show that over 70% of suspensions lasted no more than 2 days.
In the chart below, we show the percentage of pupil enrolments that experienced exclusion/ suspension at least once.
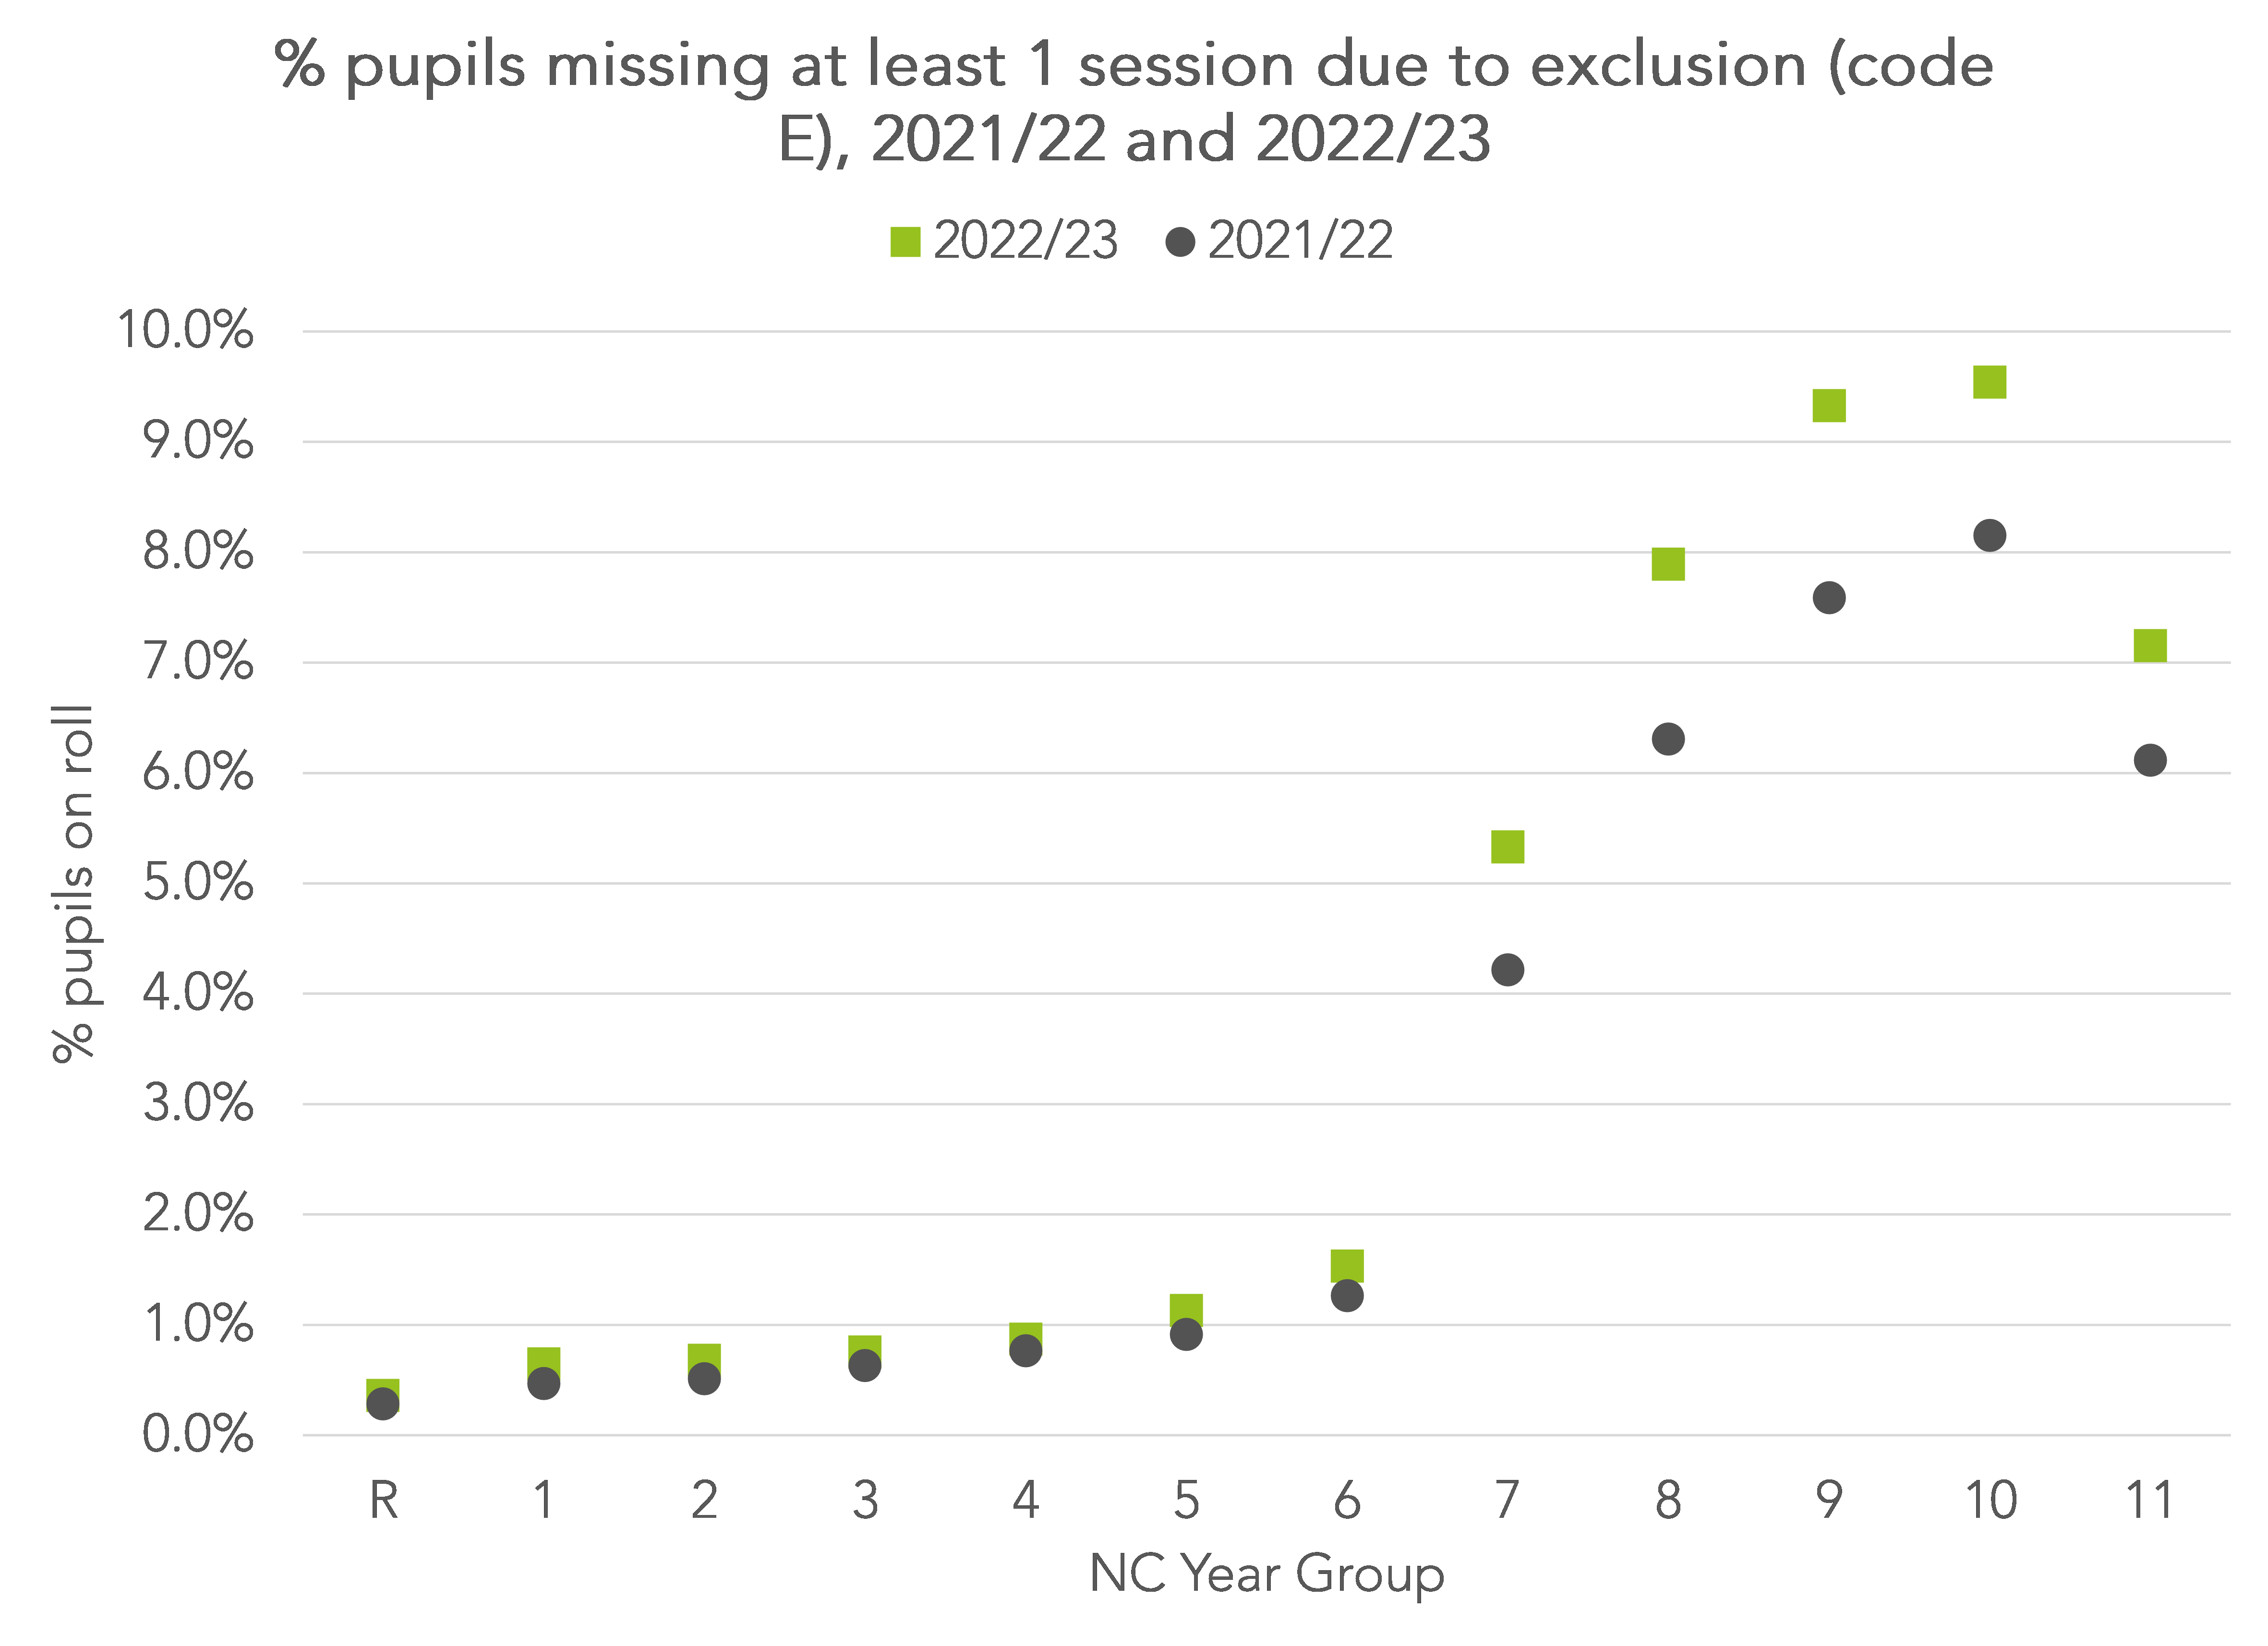
Rates increased across all year groups. Almost one in ten pupils in Years 9 and 10 experienced exclusion or suspension. The risk of exclusion / suspension remained relatively low for pupils in the primary years although there was nonetheless an increase.
Duration of absence spells
As in previous work, we collapse continuous periods of being recorded as absent due to exclusion / suspension into spells of absence with a start date and end date.
We then calculate the rate of absence due to exclusion / suspension by dividing the total number of spells by the total number of pupils on roll. This figure is analogous to the suspension rate published in official statistics.
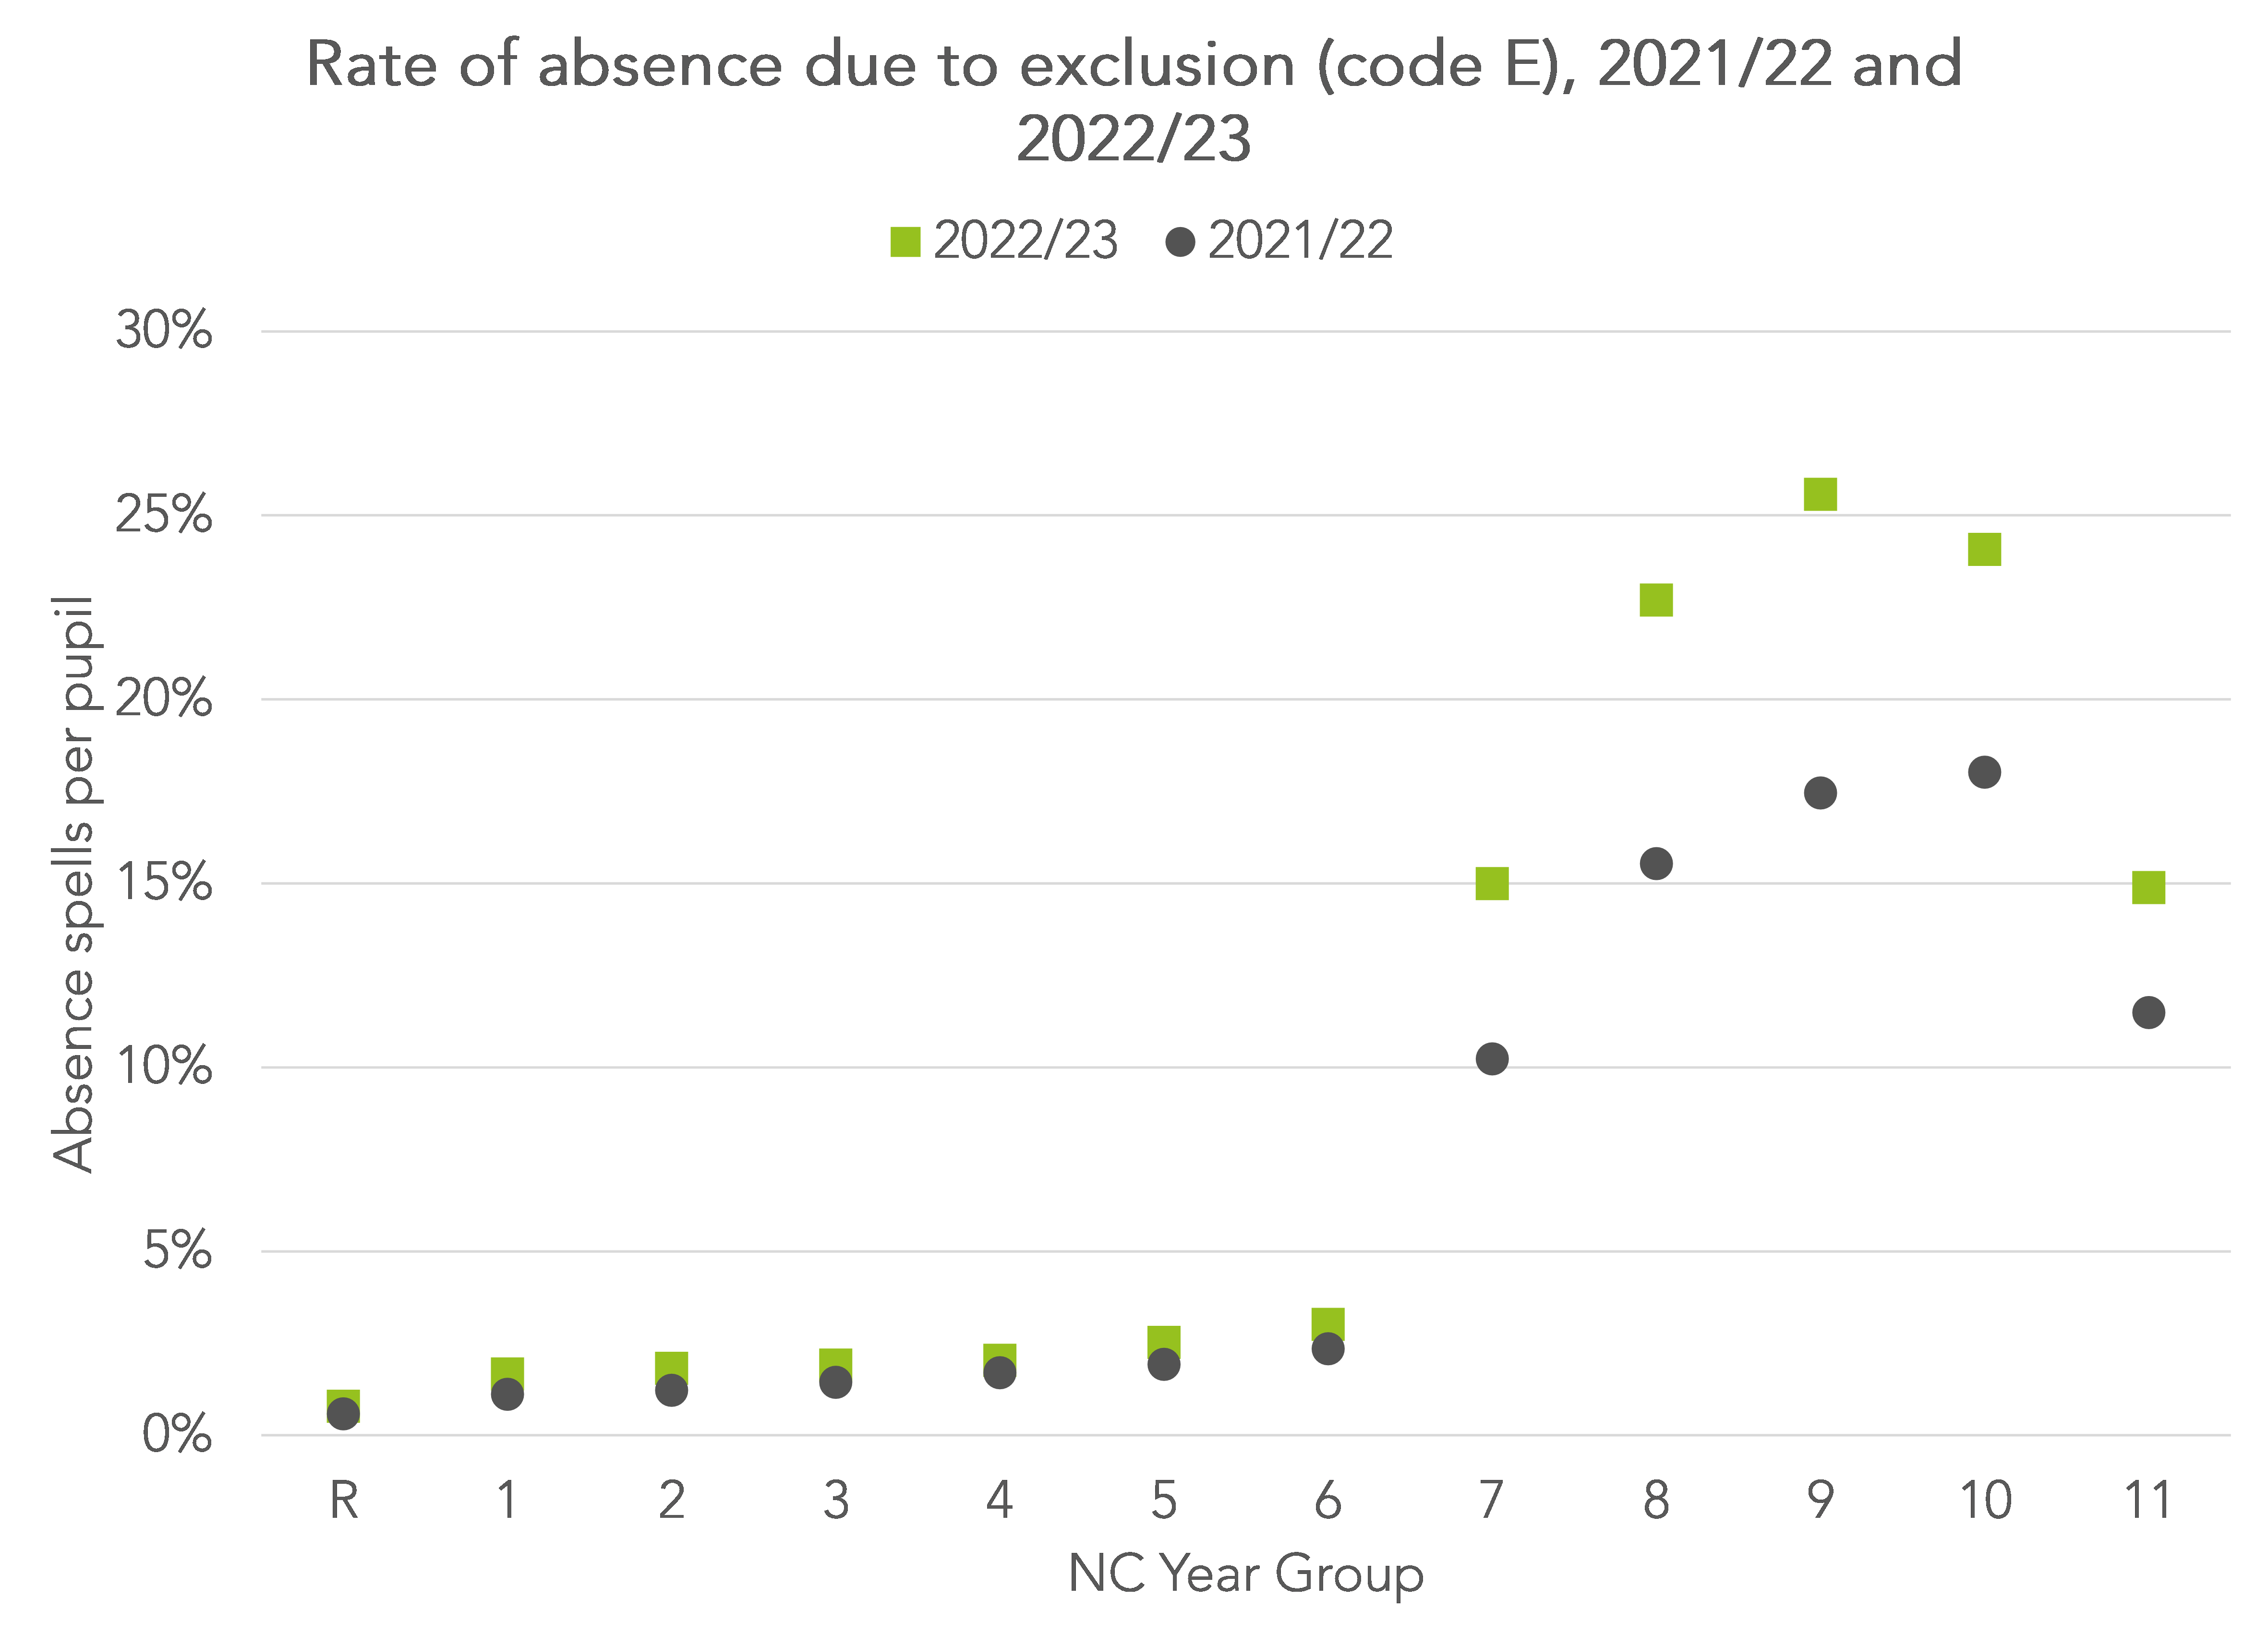
As would be expected from the previous charts, this shows an increase in spells of absence due to exclusion/ suspension in 2022/23.
To finish off, we calculate the duration of each spell. In the chart below, we show the number of sessions missed for each spell of exclusion/ suspension in both 2021/22 and 2022/23.

The duration of spells in 2023 was pretty similar to that in 2022. The majority of spells lasted for no more than 4 sessions (2 days).
After 5 days (10 sessions) alternative provision is supposed to be arranged. Given that there were more spells of absence due to exclusion/ suspension in 2023 than in 2022 this would put pressure on placements in alternative provision (AP) and may be a contributory factor to the increased demand for AP placements reported in Schools Week recently.
We also note that 3% of spells are observed to last for more than 10 sessions (5 days). These may just be recording errors, i.e. the pupils were attending alternative provision (AP) and so should have been coded as B, or it may indicate a lack of available AP placements. We are unable to tell from the data at hand.
Summing up
Analysis of attendance codes suggests that there was an increase in absence due to exclusion/ suspension in 2023 compared to the previous year.
Given that suspensions greatly outnumber exclusions this would tend to suggest that there was an increase in suspensions in 2022/23.
Comparing the number of spells of absence due to exclusion/ suspension in 2023 to the number in 2022 suggests an increase of about 33%, and even higher among pupils in Years 8 and 9.
Want to stay up-to-date with the latest research from FFT Education Datalab? Sign up to Datalab’s mailing list to get notifications about new blogposts, or to receive the team’s half-termly newsletter.


Hi Dave,
It may have been challenging to suspend students who were not in school at the time, for example due to isolation, school closures etc in 2021/22. So, whilst it appears to be the case that suspensions increased from 2021/22 to 2022/23, it may be more apt to ask whether suspensions decreased during the 2021/22 year compared to normal levels. How do the rates in 2022/23 compare to pre-pandemic levels in, say, the 2018/19 academic year?
Best wishes,
Dave
Hi Dave. Many thanks for these very fair points. The honest answer is I’m not sure as we only started collecting attendance data in 2019/20. However, the official statistics show that suspensions in 2021/22 exceeded the rate of 2018/19 (certainly in secondary), so I think it would be fair to say that they are higher still in 2022/23.
Hi Dave. What is your hypothesis for the anticipated increase? If this is an upwards trend, it would be good to understand what is potentially driving it. Thanks, Oliver.