Schools Week recently wrote about the case of The Diocese of Bristol Academies Trust (DBAT). This 15 school trust is closing its doors after its sole secondary school was rebrokered following an inadequate Ofsted rating.
The trust’s CEO was quoted as saying that trusts with a high number of primaries and low number of secondaries were exposed to “a vulnerability”. With primary pupil numbers set to fall over the next few years, the funding models for trusts in this position may be based around reliance on their secondary schools’ numbers. So losing a secondary school could be disastrous.
Of course, this wasn’t the only reason for the closure, and funding is an increasing concern for MATs across the board.
But it does seem like a good excuse to review the composition of MATs in terms of school phase.
We’ll be using data from Get Information about Schools downloaded in January 2024.
Some background
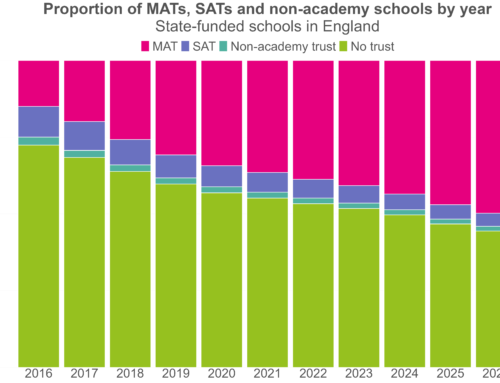
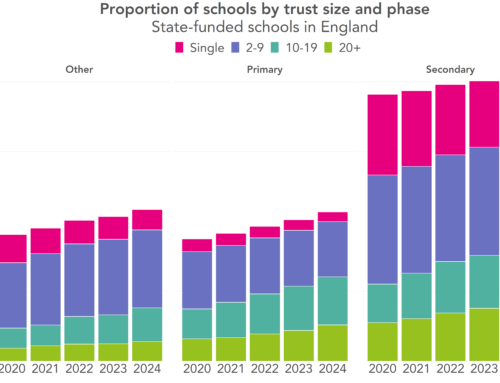
Before we start looking at the composition of MATs, let’s have a quick look at some background. The chart below shows the proportion of state schools in England by phase and academy status.

Secondary schools are more likely to be academies than other schools: 81% of state-funded secondary schools are academies, compared to 42% of primaries, 40% of special schools and 49% of alternative provision schools.
Primary academies are more likely to be part of a multi-academy trust, particularly a large trust, than secondary academies, as shown below.
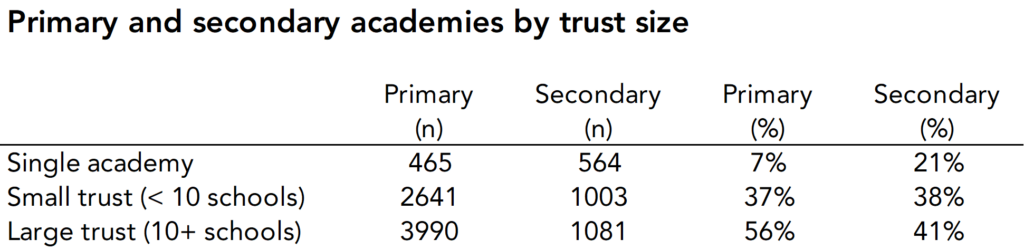
In total, there are more than 7,000 primary schools in MATs, compared to just over 2,600 secondary schools.
The composition of MATs
As we’ve seen, even though primary schools are less likely to be academies than secondary schools, there are still far more primaries than secondaries in MATs. Let’s look at how they are split between MATs.
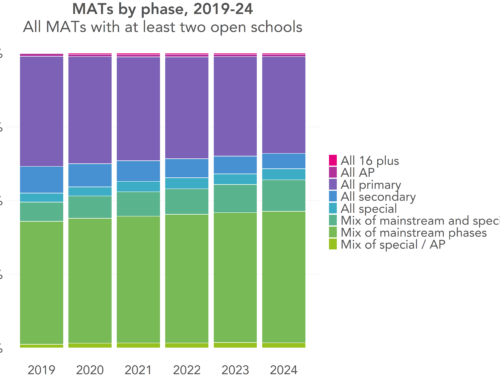
The table below shows the composition of MATs with at least two open schools. We’ve defined large MATs as those with ten or more schools.
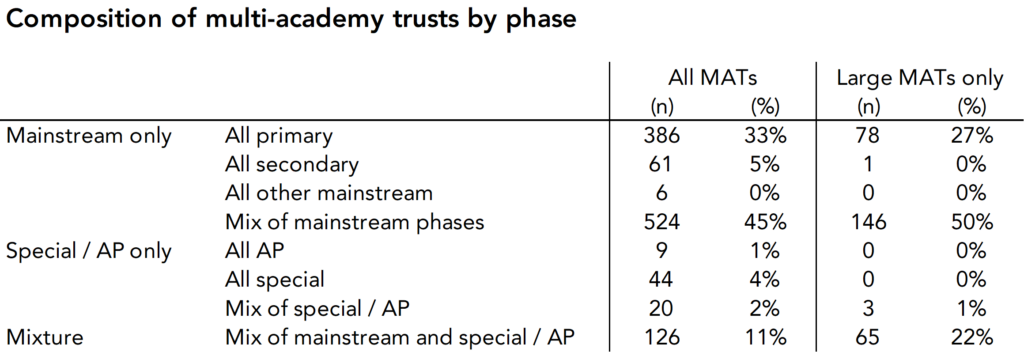
A third of MATs are primary only, and a further 45% are a mix of primary, secondary and / or other mainstream schools. A minority (7%) consist solely of special and / or alternative provision schools, and 11% include both mainstream and special / AP schools.
Larger MATs (those with ten or more schools) are more likely to include a mix of phases or school types, but even so more than a quarter are primary only.
Primaries vs secondaries in MATs
Finally, we’ll try to get a sense of how many trusts are made up of a high number of primaries and a low number of secondaries.
We’ll focus on trusts that include at least one primary and at least one secondary, and that don’t include any special or AP schools.
The table below shows these trusts broken down by the number of primary schools that they have.
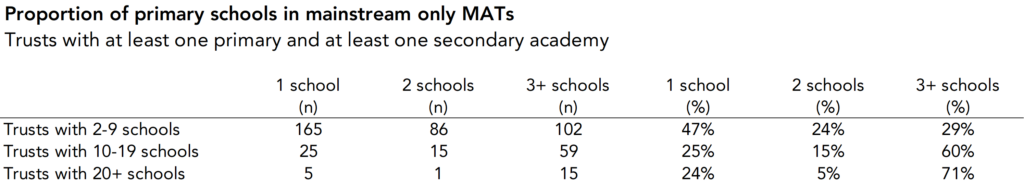
Of the large trusts (those with ten or more schools), 46 include just one or two secondary schools, so could be in a vulnerable position if those schools were to close or leave the trust.
Since they have fewer schools overall, smaller MATs are of course much more likely to have just one or two secondary schools than larger MATs. Smaller MATs are already under increasing pressure to expand or merge: while losing a secondary school might place them in a more vulnerable position, arguably so would losing any school.
Summing up
The number, size and composition of MATs is constantly evolving. Pre-pandemic, there were just over 150 large MATs with 10 or more schools (as we wrote in this piece). In the data we used for this piece, there were nearly 300.
But this snapshot of their composition shows that a sizeable minority of MATs either consist entirely of primary schools, or include just one or two secondary schools. And these MATs may be more vulnerable to funding issues as primary numbers fall.
Leave A Comment