What do court cases, speed dating, baseball pitches and school inspections have in common? They all involve humans making repeated judgements about whether something meets a certain standard: reasonable doubt, marriage potential, foul throws, and inspection grades.
Prior research suggests that human judgments can be influenced by prior judgements. This is known as sequential bias. For example, we might judge court cases relative to our expectations. We know that not everyone is marriage material, so a string of attractive potential matches at a speed dating event might lead the next person to be judged more negatively. This is norm referencing. Alternatively, sequential bias might result from understanding the high stakes consequences of a decision. When a baseball umpire makes a marginal decision against a team, they will face impassioned protests. They might be reluctant to make two such decisions in a row.
In new research, funded by the Nuffield Foundation, Christian Bokhove, John Jerrim and I investigate whether Ofsted judgements suffer from such ‘sequential bias’. More precisely, we study whether the grade awarded by a lead inspector in their last inspection seems to influence the grade awarded by that same lead inspector in their next inspection. Given recent discussions about the reliability of the school inspection process this seems a pertinent topic.
We stitch together information on lead inspectors and outcomes across a decade. We then look at whether schools with otherwise similar characteristics (e.g., pupil intake, results) get judged differently depending on the lead inspectors’ prior inspection judgement. To strip out fixed differences in harshness/leniency across inspectors, we analyse data for each school inspector separately.
The figure below shows our results for primary schools, for which we have a larger sample. The top panel shows how the odds of an ‘Outstanding’ in the current inspection varies depending on the grade the inspector awarded in the last inspection. The second, third and fourth panel show the same for odds of a ‘Good’, ‘Requires Improvement’ and ‘Inadequate’ in the current inspection.
Within each panel, the top line shows how the odds of the grade in the current inspection varies if the inspector awarded an ‘Outstanding’ (relative to ‘Good’) in the last inspection. The middle line shows how the same for ‘Requires Improvement’ relative to ‘Good’ and the bottom line for ‘Inadequate’ relative to ‘Good’. An odds ratio above 1 means it increases the odds of receiving the grade in question; an odds ratio below 1 means the opposite.
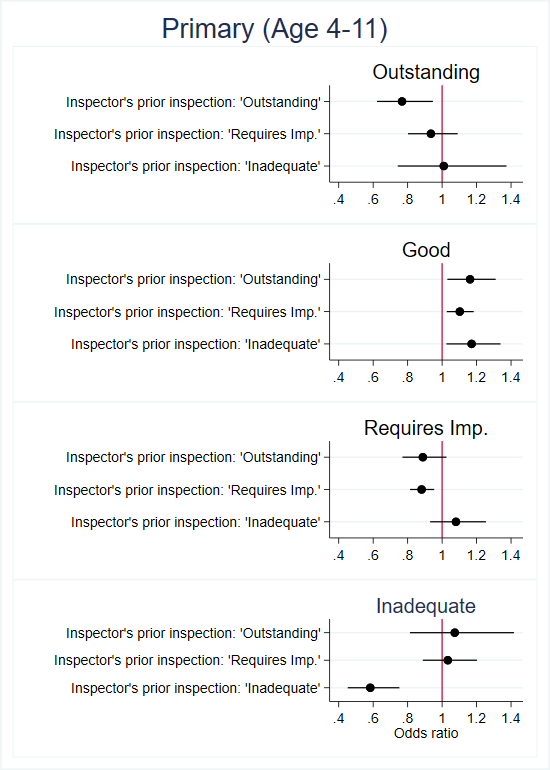
Perhaps the clearest finding is in the bottom panel. When an inspector reaches an ‘Inadequate’ judgement in their prior inspection, the odds of reaching an ‘Inadequate’ in their next inspection is around 40% lower. Given that such a judgement often results in Headteachers losing their job, this is plausibly explained by recognising the consequences of the decision. Inspectors might just not be able to stomach doing it twice in succession. However, as Inadequate judgements are rare, this will only impact a very small fraction of Ofsted’s entire inspection load.
Another notable finding is that a ‘Good’ judgement in the current inspection is (slightly) more likely when the inspector reaches any judgement other than ‘Good’ in the prior inspection. Given that about two thirds of inspections during this period resulted in a ‘Good’, this is plausibly explained by norm referencing. After awarding one of the rarer grades, an inspector might expect to award the modal grade in their next inspection.
Is this really evidence of sequential bias? It’s possible that Ofsted choose the sequence of schools that they assign to an inspector in ways that would generate such patterns even in the absence of sequential bias. For example, they might try to avoid sending inspectors to two low-performing schools in a row. When we checked in the data, schools with strong exam results were no more or less likely to be inspected after a school with weaker exam results.
A second concern relates to whether we are really making apples-with-apples comparisons. We can statistically equate our comparisons across a range of characteristics, including: pupils with English as an additional language, pupils on free school meals, pupils with special educational needs, whether the school is all-boys/all-girls/mixed, and achievement at age 7 and 11 (if a primary school). However, there may be other characteristics of these schools that we are comparing that differ without us knowing e.g., behaviour standards.
In conclusion, we find some limited evidence of sequential bias in primary schools. However, we don’t find the same patterns in our smaller sample of secondary schools. Even among primary schools, until we get greater clarity about how inspectors are assigned to schools, and more complete data on the inspection process, we have to remain somewhat cautious about these findings. We suggest that improving transparency in Ofsted’s school inspection process, as well as making data available to independent researchers, could contribute to further insights.
Read the full paper here.
Want to stay up-to-date with the latest research from FFT Education Datalab? Sign up to Datalab’s mailing list to get notifications about new blogposts, or to receive the team’s half-termly newsletter.


One of the many problems with ANY form of inspection is that it can ONLY increase the variation in performance of the product or system being inspected.