It has always been quite a challenge to analyse written text. One popular approach for ‘document analysis’ is to do a lexical analysis, for example by counting particular words. Another approach is to take documents and then analyse the content manually with coding and theming.
The former approach is quite scalable, but gives little insight into the actual content of long documents. The latter approach is very time-consuming and therefore not feasible with large collections of text.
These challenges were on our mind when we set out to analyse the content of more than 60,000 school inspection reports as part of our project, Inspecting the inspectorate: new insights into Ofsted inspections.
Data
The number of inspection reports that Ofsted has published over the last decades is a very large corpus and an interesting collection of documents for several reasons. Firstly, the reports are publicly available, and almost every school will have had an inspection in their lifetime, some more than others. Secondly, the documents are the result of a process of scrutiny by inspectors, a process we have blogged about many times. For an overview see here. Finally, the inspection process is influenced by factors like policy changes so one would expect that such changes might be seen in the content of the inspection reports.
We looked at 63,899 inspection reports for primary and secondary schools in England, to see how they had changed over time, with specific attention for two cut-off moments in the inspection process in the last 20 years: (1) a document dispelling myths about what inspectors in England are looking for and (2) the introduction of the 2019 Education Inspection Framework (EIF).
We first had to obtain the inspection reports, so we wrote code to ‘scrape’ all the reports in PDF format from the Ofsted website.
Our approach
The first approach we used was called ‘topic modelling’. We used computational methods for automatically extracting topics from sets of documents. LDA finds topics that documents belong to on the basis of words in the document, assuming that documents with similar topics will use similar words. In a second approach, we checked whether the tone of reports changes over time, in the form of a sentiment analysis. Finally, we also looked at “semantic similarity” around 2014 and 2019.
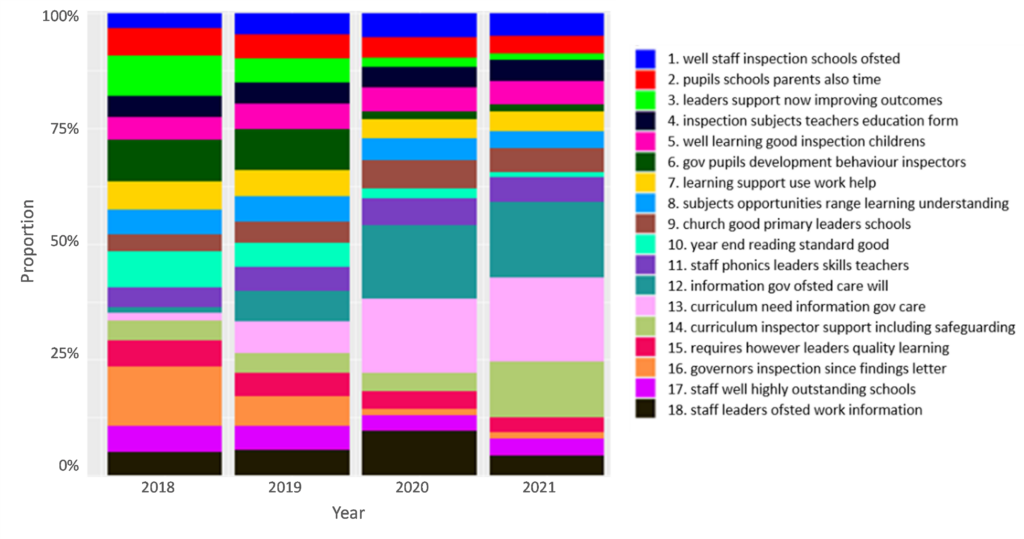
What did we find? Before and after publishing the myths document (10,544 reports with 2,097 unique terms) there was limited change in sentiment and topics in the reports. If anything, the semantic similarity reduced slightly. However, the introduction of the EIF in 2019 did lead to an increase of certain themes and topics from 2018 to 2022 as demonstrated in the figure.

Notable topics in the 11,245 reports with 1,944 terms, are Topics 12 (blue-green), 13 (pink) and 14 (pale green), with overall more emphasis on curriculum. This aligns with an increased emphasis on the ‘Quality of Education’ in the new framework. Other notable topics were leadership and subject specialism, including themes of reading and phonics, and an emphasis on specific subjects. Framework changes also included an increased emphasis on leadership, especially in the context of supporting teachers in schools. The semantic similarity of inspection reports also increased with the introduction of the EIF.
Analysis of sentiments
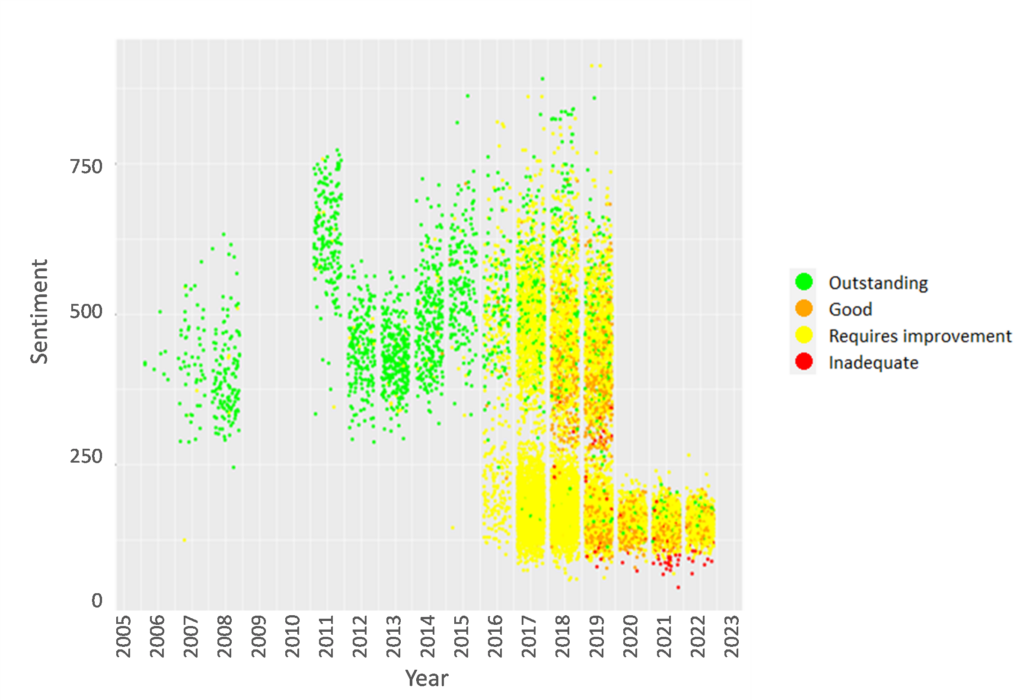
An additional analysis of the language in the most recent inspection reports shows that, since reports became much shorter in 2020, only the reports for Outstanding and Inadequate schools demonstrate ‘sentiments’ commensurate with the judgement, respectively very positive and very negative, something which can be seen in the figure.
The y-axis of the graphs shows the total ‘sentiment’ score for a report, with every datapoint denoting an inspection report. The figure shows that ‘outstanding’ reports in green are typically older because standing policy was that these schools were not inspected for a while. However, reports for schools deemed Good and Requires Improvement (RI) show much more ambiguity in their language, suggesting that their reports are not always commensurate with the judgement. One reason for this might be that the inspectors want to highlight less positive things for Good schools, to signal areas for improvement, and more positive things for RI schools, to show that some aspects of a school are good.
Summing up
All in all, our novel analysis with computational research methods sheds light on the content of school inspection reports. The myths didn’t change inspection report content, which we argue is good because the document was clarifying pre-existing policy. The new inspection framework did change the content. This is good, in that the process is clearly responsive to changes in policy. The sentiment analysis shows shorter reports recently, that overall are lower in sentiment score, but in the case of RI and Good, with a tone that is not always in line with the judgement.
Want to stay up-to-date with the latest research from FFT Education Datalab? Sign up to Datalab’s mailing list to get notifications about new blogposts, or to receive the team’s half-termly newsletter.


Leave A Comment