The latest Department for Education statistics on schools and pupils show that there were 333 state-funded alternative provision (AP) schools[1] in January 2024.
This is less than 10% of the total number of state-funded mainstream secondary schools, of which there were 3,452[2].
So it would stand to reason that pupils who attend AP schools have to travel further to get there than pupils who attend mainstream secondary schools, unless there was some other reason why pupils who attend AP just so happen to live close to AP schools.
In this article, we examine how far pupils who travel to AP do so to get to school. We then examine whether there is any relationship between distance travelled and absence. We finish off by examining differences in absence between mainstream and AP schools for a group of pupils who attend both.
Data
We use data from the 2023 January School Census, and limit our analysis to pupils of secondary age (aged 11 to 15 on 31 August 2022).
We use data on all pupils on roll, including subsidiary registrations. Pupils who are dual-registered will be counted twice, once at their “main” school and once at their “subsidiary” school. We will come back to pupils who have subsidiary registrations at AP schools later in the article.
For each pupil registration at each school we measure the distance they travel to school. These are not precise measurements as we only have access to the lower super output area in which pupils live. Hence we measure the distance from LSOA centroids to schools.
We measure distances in a number of different ways. The simplest is the straight-line (or “crow-flies”) distance. However, we also calculate other distances using OpenStreetMap (OSM) data. These are
- footpath distance– the shortest distance following routes in OSM that are legally (English law) traversable on foot (including roads with pavements, public footpaths, bridleways, etc.);
- road distance – the shortest distance[3] following routes in OSM that can be traversed by car (with allowances for some foot-pathing at either end in order to reach the road network, where required);
- public transport distance– the shortest distance following routes identified in OSM as having public transport (bus, train, tram, etc.) services on them[4], with foot-pathing at either end and to move between such services (for example moving around a train station or between services of different types).
Once we have these three distances, we select the shortest as the final “distance”[5].
Around 3% of secondary age pupils in 2023 did not have a recorded LSOA or were resident outside England. We leave these pupils out of our analysis. We also ignore pupils whose recorded LSOA is an implausibly long way (100km+) from school.
Distance travelled
Let’s first look at the simple straight-line distances that secondary age pupils in AP schools travel to school compared to secondary age pupils attending mainstream schools.
Firstly, let’s look at pupils at AP schools
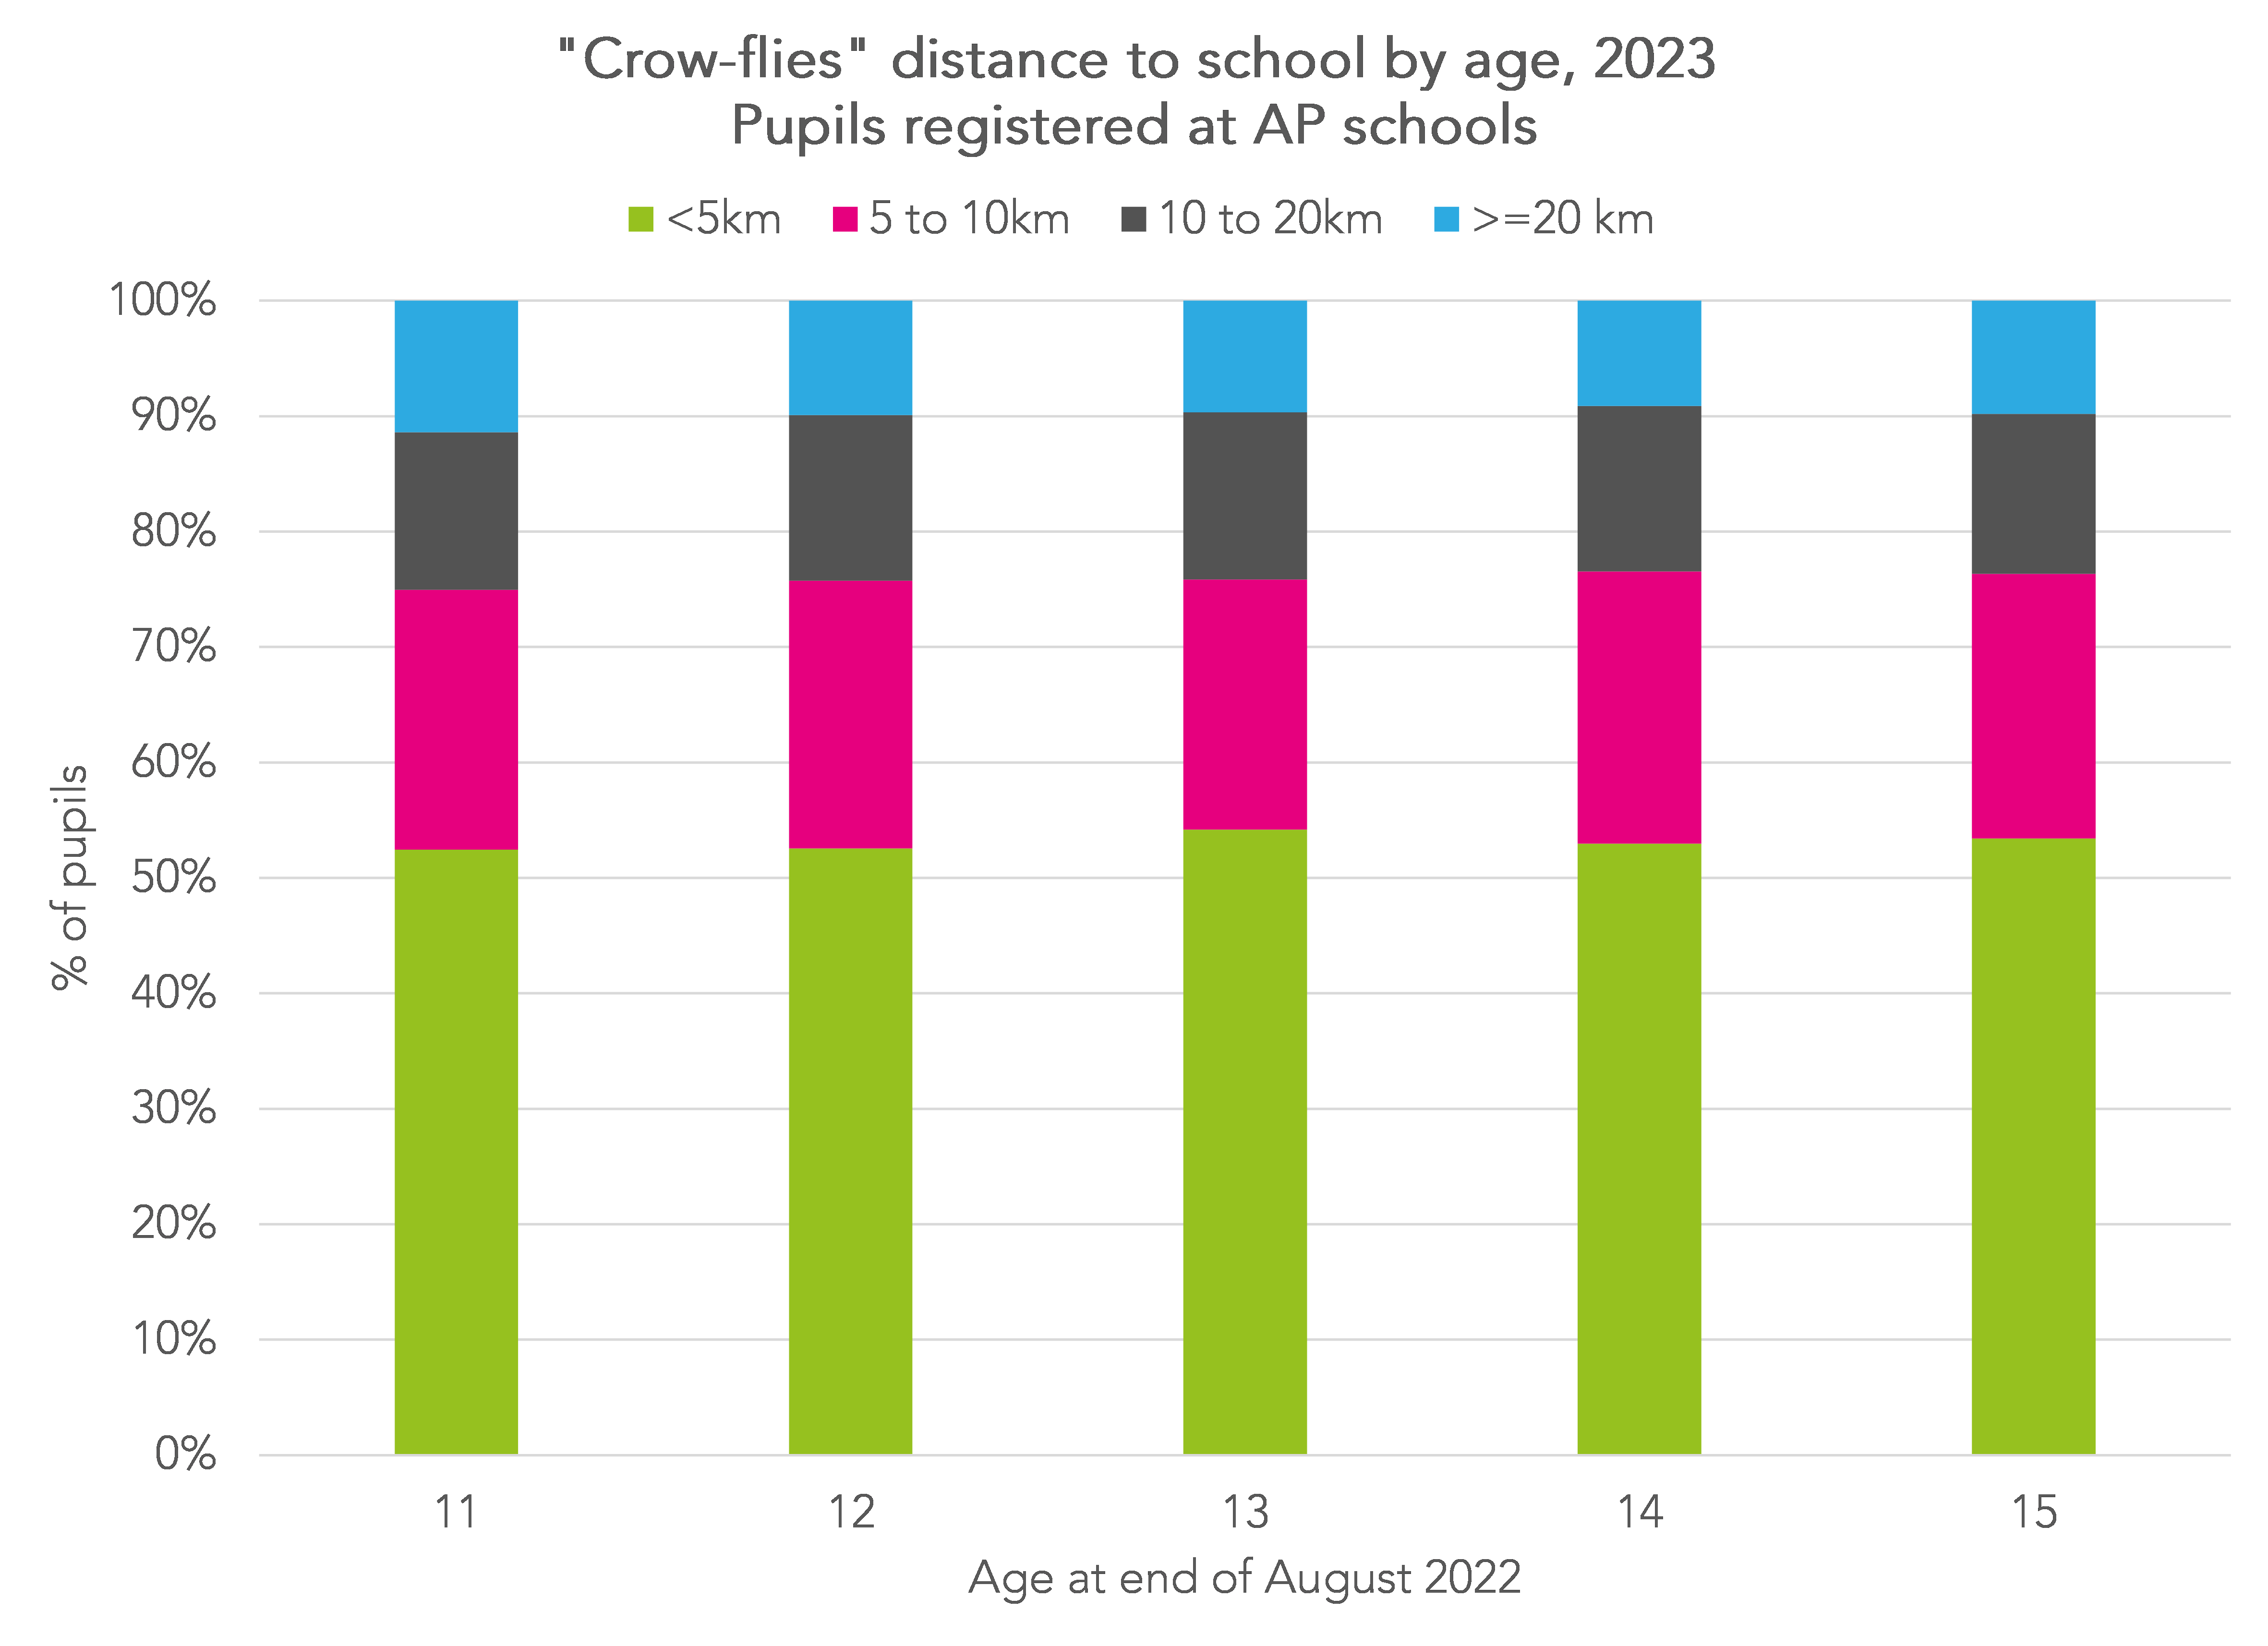
Just over half of the pupils who go to AP schools live less than 5km away as the crow-flies although in practice journeys could be longer. However, a quarter live 10km away or more, including around 10% living 20km away or more.
A similar chart for pupils attending mainstream schools is as follows.
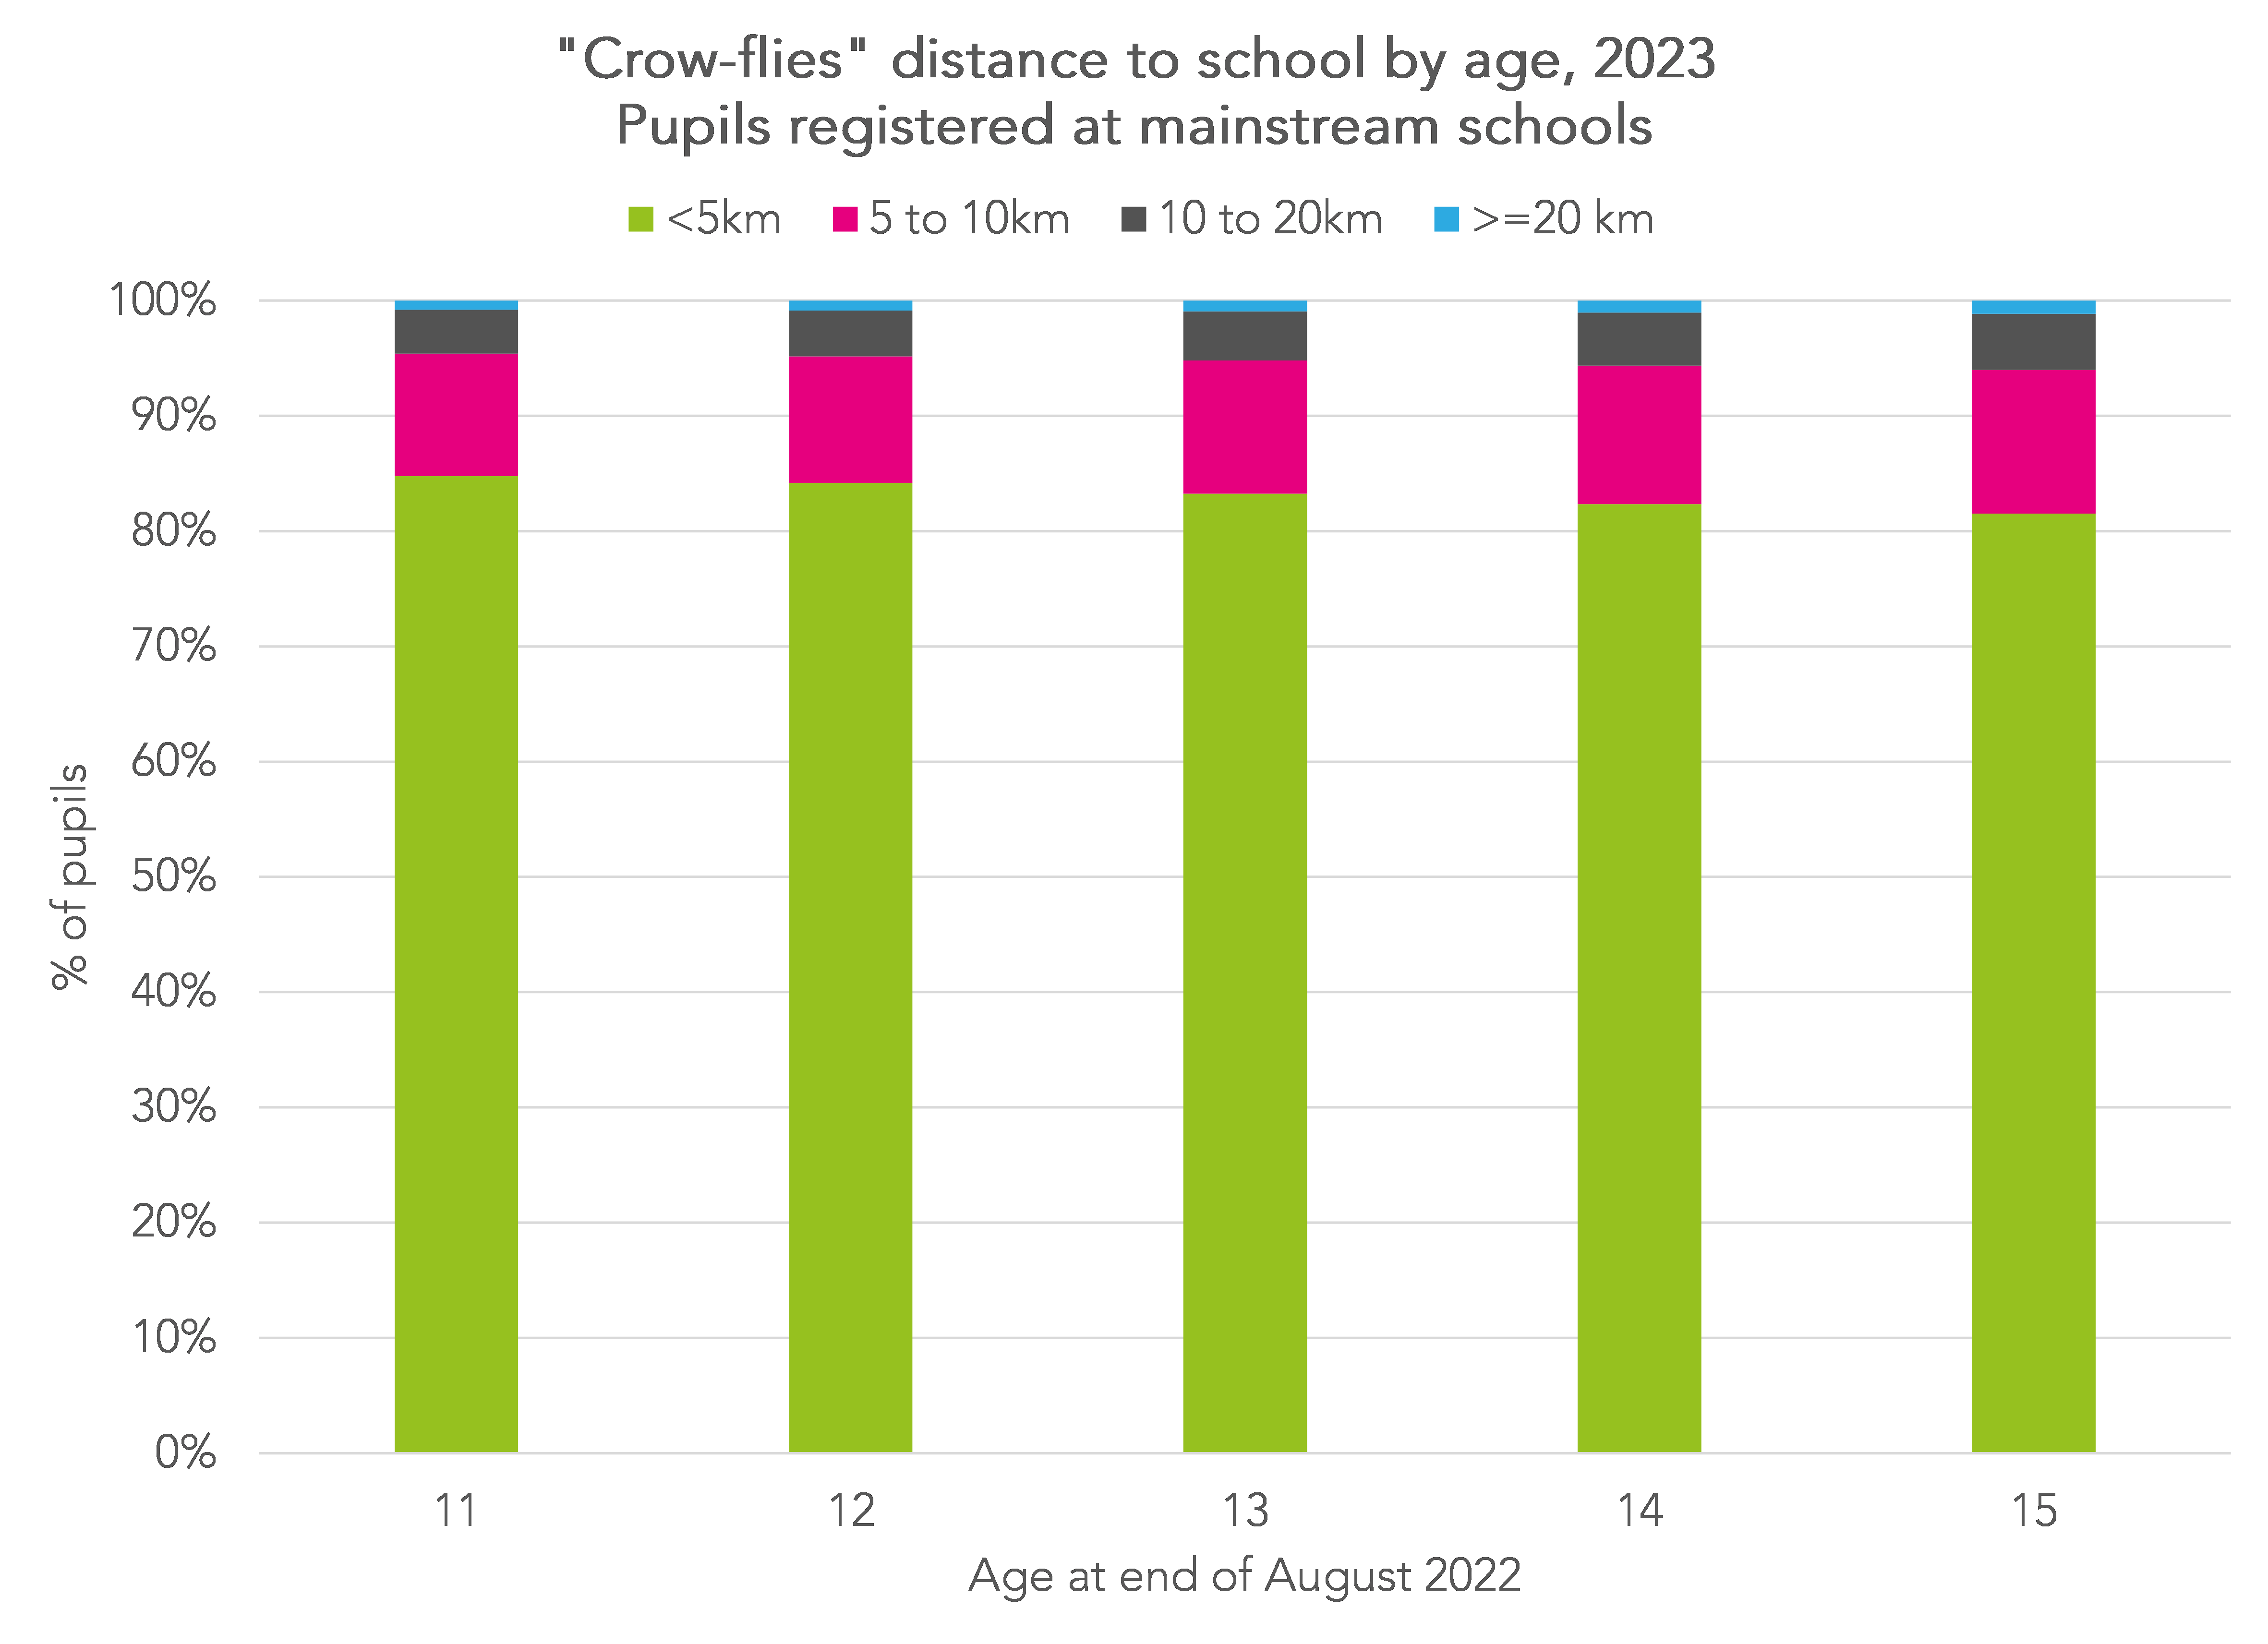
Here we see that 80% to 85% of pupils live less than 5km away. Just 1% are observed to be travelling more than 20km.
On average, pupils attending AP schools live 8km away as the crow-flies whereas pupils attending mainstream schools live 3km away. These figures will obviously vary across the country but we park that for now.
If we use travel distances rather than crow-flies distances, we don’t see a huge amount of change for AP schools.
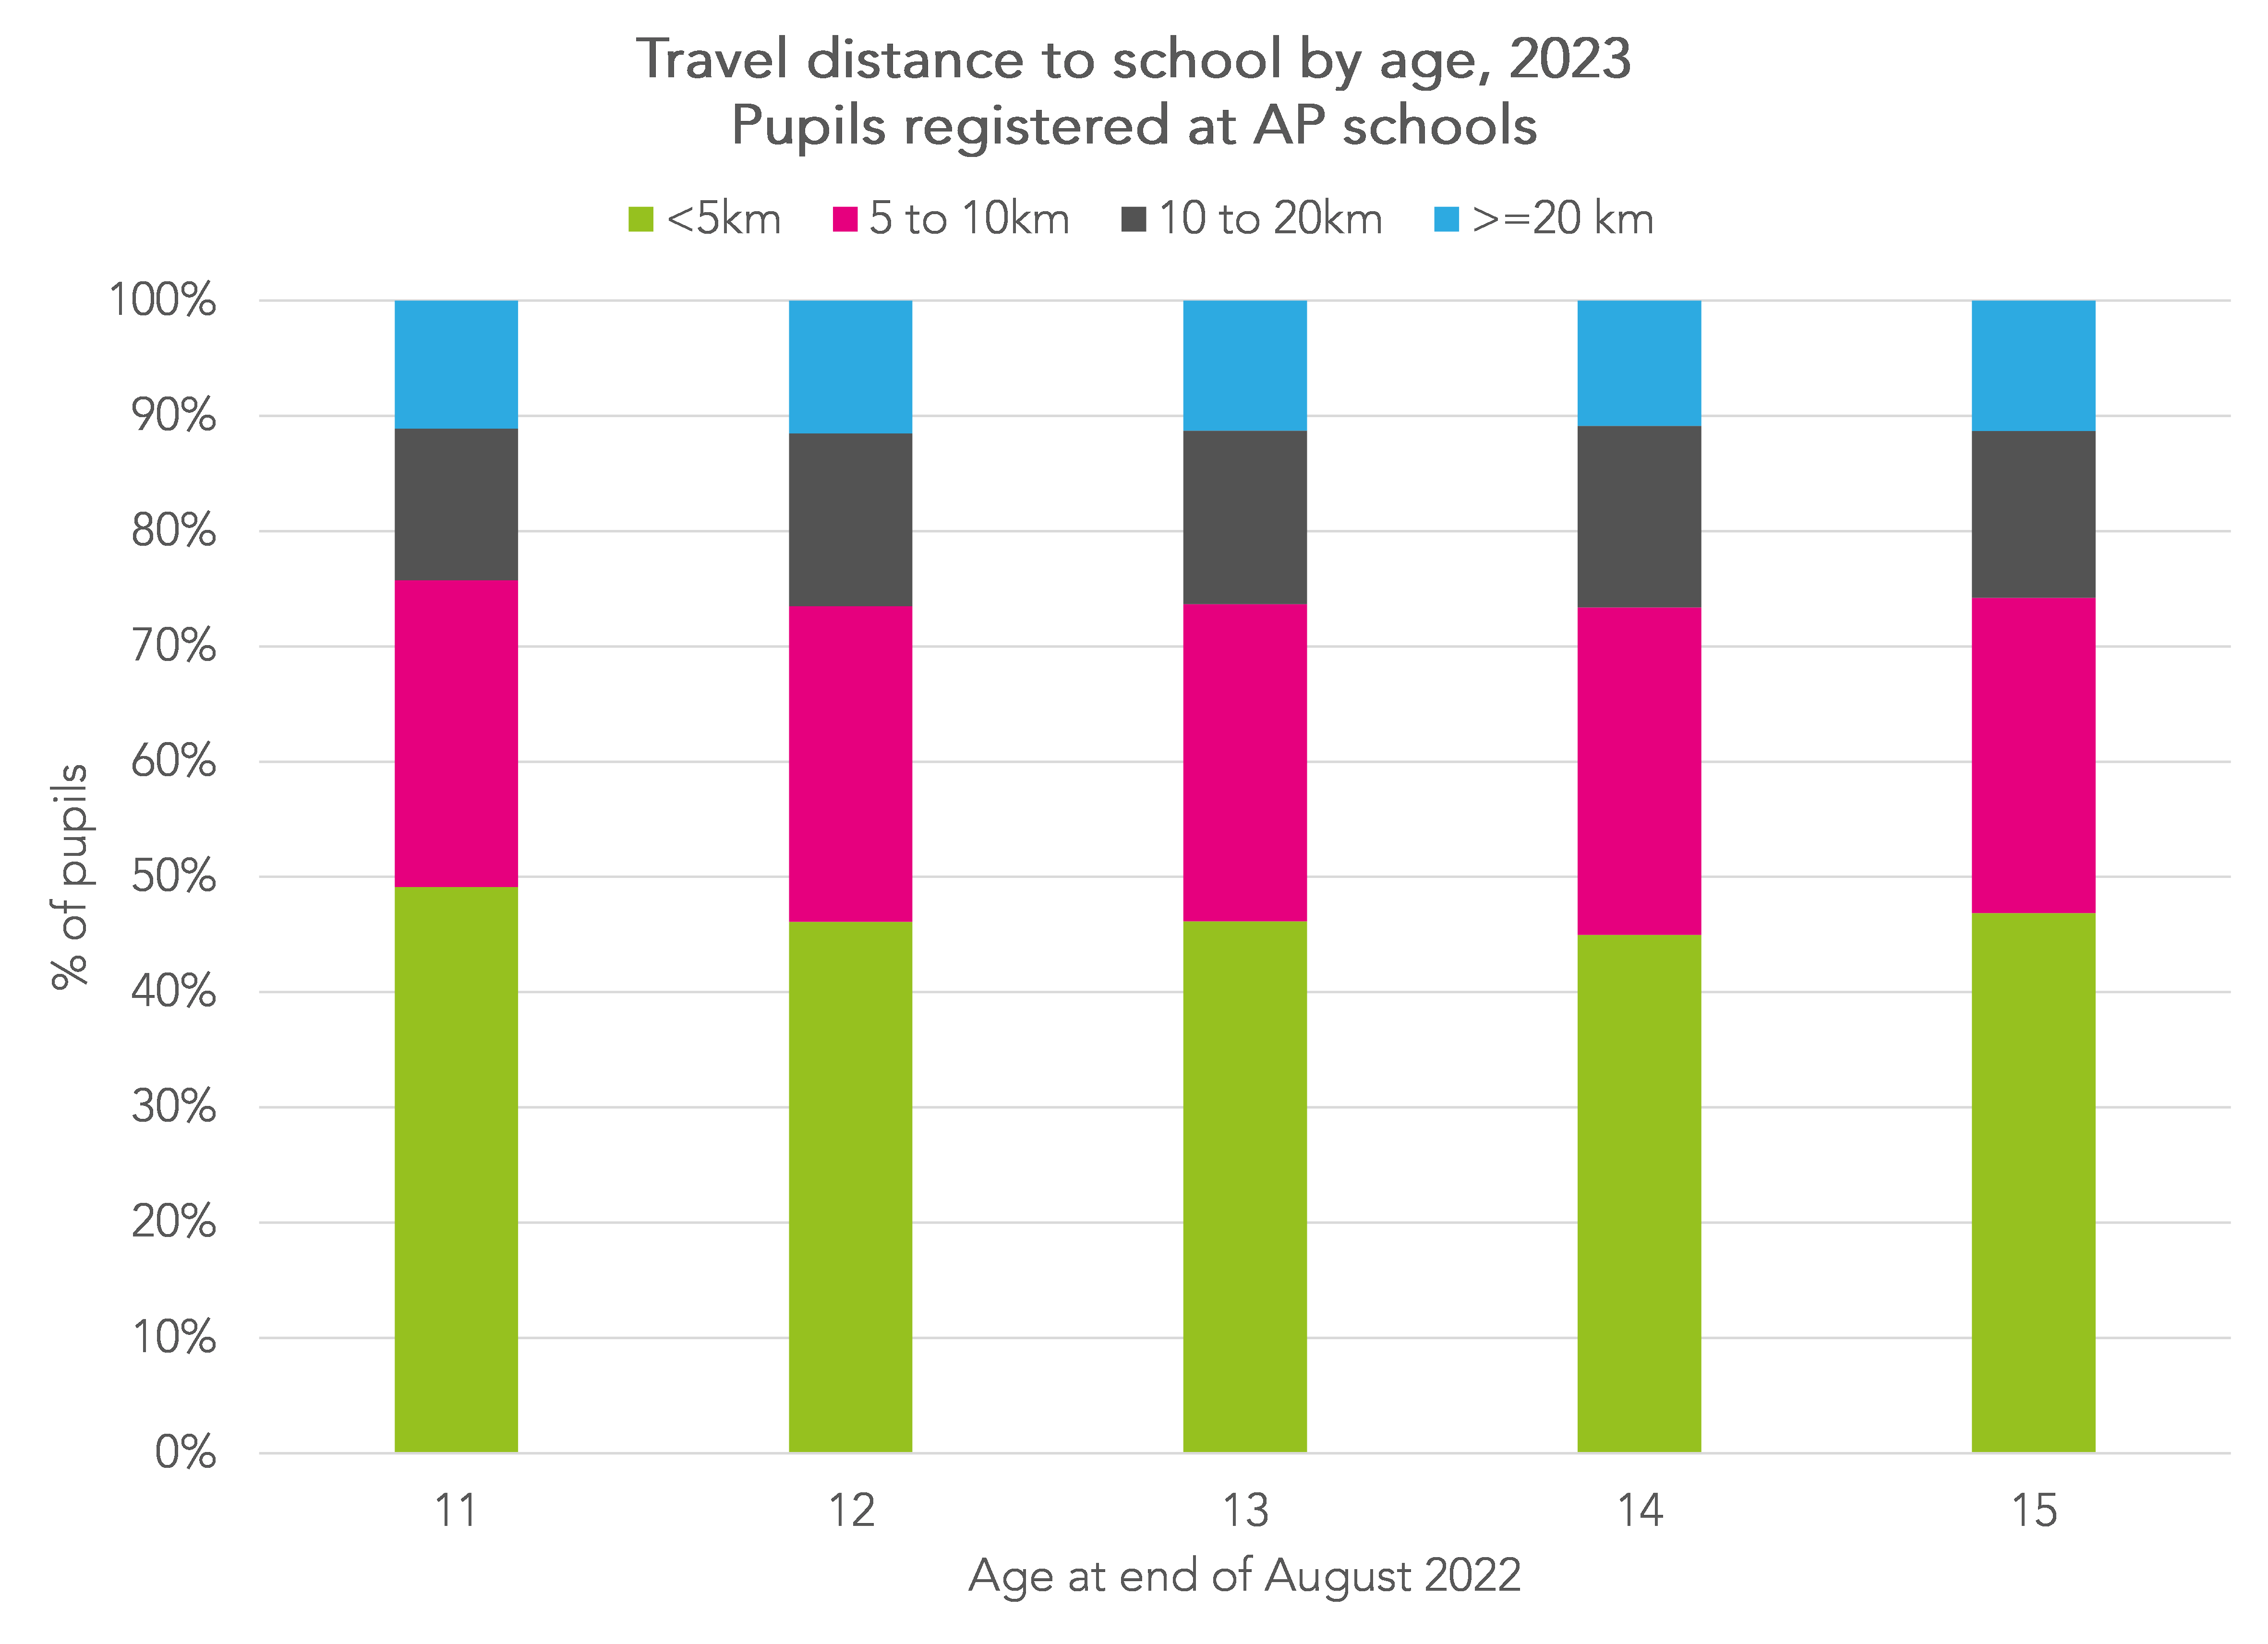
When switching from crow-flies to travel distances, the average home to school distance increases from 8km to 9km.
Absence
We’ve seen before, looking at mainstream schools, that pupils who live further away from their school tend to be absent more often. Does this also happen in the AP sector?
We also know that absence tends to be high in the AP sector. In 2022/23, pupils at AP schools missed 42% of sessions and 38% of pupils were severe absentees, i.e. missed at least 50% of sessions.
We link absence data from the National Pupil Database from 2022/23 to our travel distances for pupils attending AP schools.
For each AP school, we divide pupils into 5 evenly sized bands based on travel distance.
We then summarise absence rates by band.
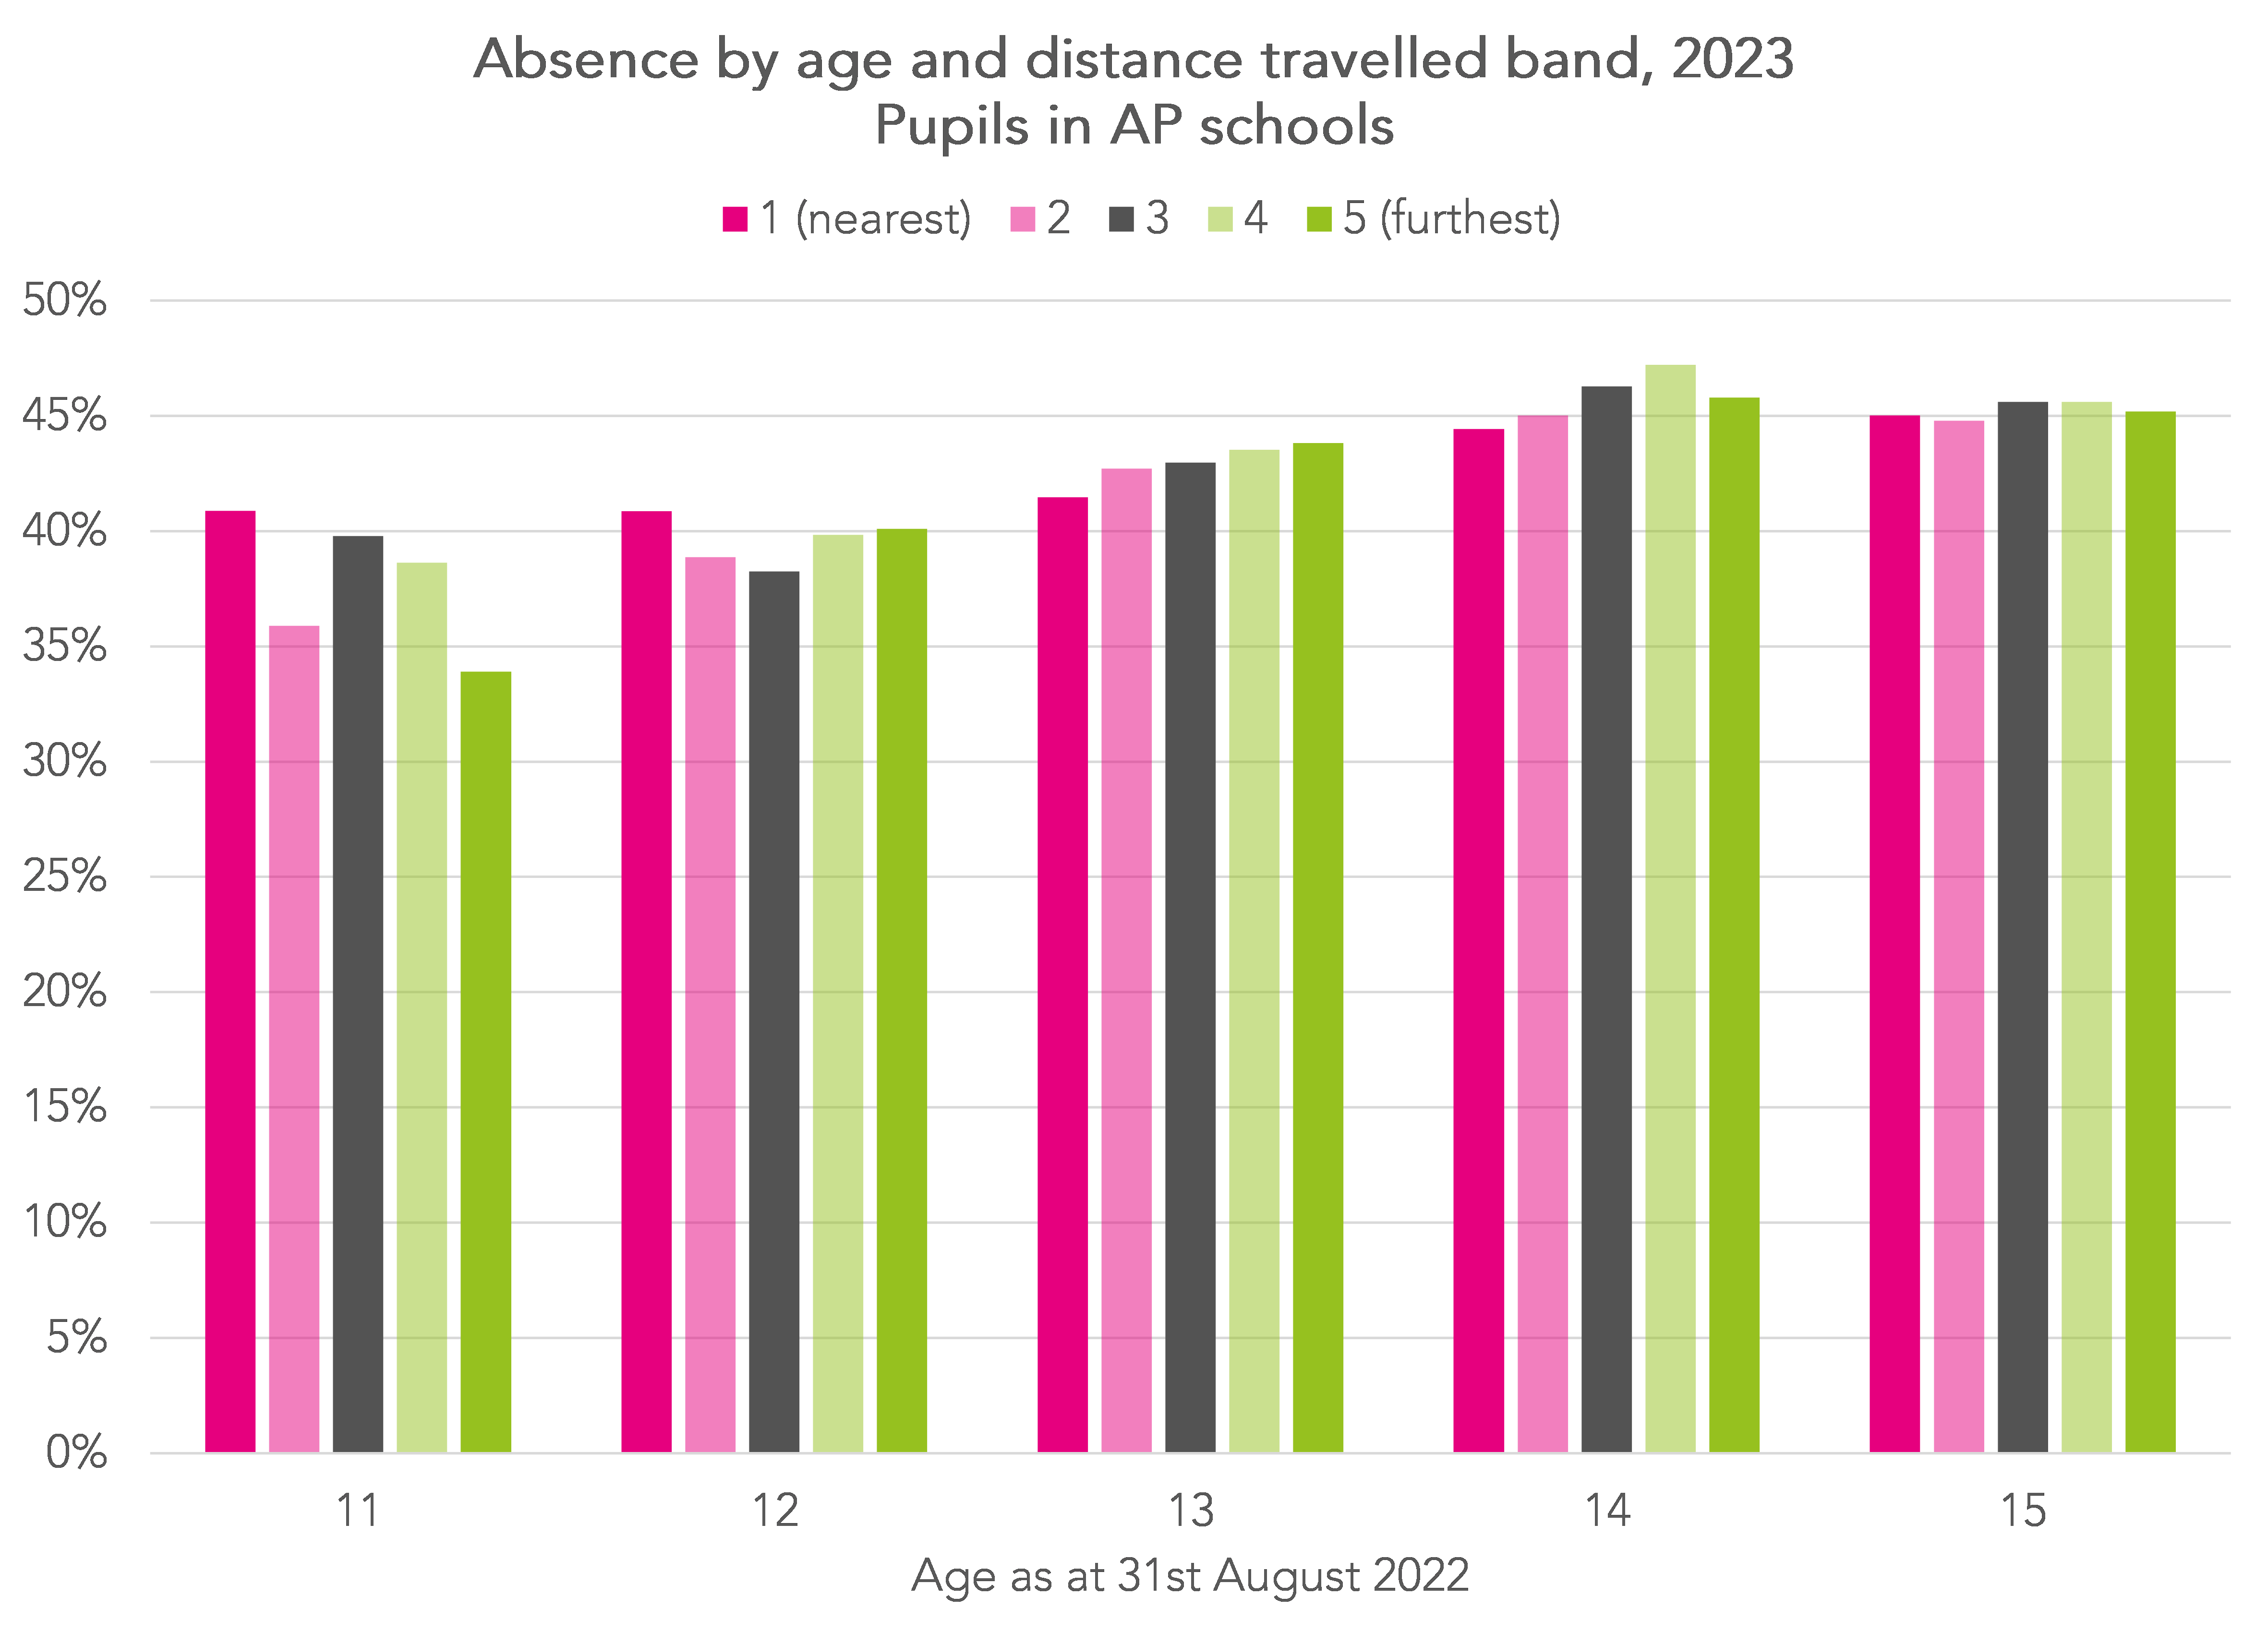
Perhaps surprisingly, for each year group there is very little difference in absence by distance travelled.
We obtained (though do not show here) similar results summarizing rates of severe absence instead of overall absence.
Dual registered pupils
Pupils with a dual registration at an AP school are an interesting group which we’ve written about before.
They are of interest here because (in theory) they attend both AP schools and mainstream (or special) schools. In other words, they form their own comparison group and we can see how far they are travelling to their schools and how their absence varies in the AP and mainstream (or special) sector.
Going back to the 2023 January School Census, we find 9,612 secondary age pupils with a subsidiary registration at an AP school and a “main” registration at a mainstream or special school. We’ve also written before about pupils who have a subsidiary registration but no “main” registration.
A comparison of absence rates at AP schools and other schools for this group is compounded by pupils being expected to attend for different numbers of sessions (half days). For some, AP attendance might have just been a short-term intervention while others may have attended longer-term.
Of the 9,612, we find that only 5,792 were expected to attend at least 20 sessions at both their AP and their other school. In fact, 2,335 were not expected to attend their mainstream school at all during 2022/23 according to the absence data (in other words have 0 possible sessions).
But for the 5,792 pupils we calculate their average absence in AP schools and their average absence in their mainstream/ special school.
We find that these pupils tend to attend AP schools more often than other schools. Average absence rates were 41% in AP and 51% in other schools. 62% of the pupils attended their AP school more often than their mainstream/ special school.

In terms of distance travelled, we compare the straight-line distances for pupils’ journeys to AP schools and their other schools.
On average, these pupils travel 3km to their main school but 9km to their AP school.
Summing up
There are 333 AP schools in England, less than 10% the number of state-funded mainstream secondary schools.
Given there aren’t many AP schools, it stands to reason that pupils who are placed in them will tend to have a longer journey. This is exactly what we see. On average, secondary age pupils travel 9km to AP schools and 3km to mainstream schools.
However, distance does not seem to be a factor in absence rates in the AP sector.
One area that would be worthy of further research is an analysis of the relationship between local authority policies towards paying transport costs for AP pupils and their absence. A quick internet search finds, for example, that Lincolnshire spent over £1 million on transport costs to AP schools in 2018/19. But it seems some LAs don’t fund transport unless a pupil has an EHC plan.
Although we have examined distance travelled to AP, we have done this in terms of distance and not in terms of travel time. This may also be a worthwhile strand of future research. How easy is it for pupils to get to AP schools?
To finish on a positive note, we found that dual-registered pupils who attended both an AP school and a mainstream (or special) school were absent less often when they were due to attend AP schools.
This perhaps puts the high absence rates in AP schools in some perspective.
- Pupil referral units and alternative provision academies/ free schools
- I make the comparison between AP and secondary schools as most pupils in AP schools are secondary-age
- When determining shortest distance by road, we account for one-way roads, but not other traffic management, such as turning restrictions
- We can identify OSM “ways” that are used by public transport, but not which services go between which places (or how frequently); we may therefore produce a route from a combination of such ways that no service actually follows (this is in general only a problem for train services)
- When selecting “shortest”, in order to better emulate what people are likely to actually do, we ignore routes that involve more than 4km on foot and add extra “cost” to walking so that where travelling by footpath is only slightly shorter than road, we select road distance, for example.
Want to stay up-to-date with the latest research from FFT Education Datalab? Sign up to Datalab’s mailing list to get notifications about new blogposts, or to receive the team’s half-termly newsletter.


Hi Dave
It would be great if you could add the absence rate for students enrolled at APs as well…59% for dual rolled is a really useful figure
Hi Liam. Been meaning to publish some more general stuff on absence in AP. Figure for 22/23 was 42%. NB: absence for subsidiary rolled was 41% (i.e. attendance was 59%).