In October 2016 the then Conservative Government announced that certain parts of the country were to be designated “opportunity areas”. These areas would share an extra £60m in funding, with their schools partnered with those in other parts of the country, and links developed with local businesses in the hope of raising children’s aspirations.
There ended up being 12 of these, selected broadly by considering levels of social mobility, attainment and progress, and capacity to improve. These were:
Blackpool, Bradford, Derby, Doncaster, Fenland and East Cambridgeshire, Hastings, Ipswich, Scarborough, Norwich, Oldham, Stoke-on-Trent, and West Somerset.
This programme ended in September 2022, to be replaced by a broader scheme encompassing 55 “Education Investment Areas” (EIAs). A subset of these were designated “Priority Education Investment Areas” (PEIAs). There were 24 in total: the original 12 opportunity areas, along with a further 12 areas identified as having particularly low Key Stage 2 and Key Stage 4 attainment and particularly high disadvantage. These were:
Halton, Hartlepool, Knowsley, Liverpool, Middlesbrough, Nottingham, Portsmouth, Rochdale, Salford, Sandwell, Tameside, and Walsall.
In March, we found out that the Education Investment Area scheme would not continue. So we thought it would be a good time to look back and see what, if anything, has changed for these areas.
Data
We’ll be focussing on the original 12 opportunity areas and, from 2022 onwards, the additional 12 PEIAs. Where we look at changes over time, we’ll tend to compare 2016, 2022, and 2024, to line up with the identification of opportunity areas, PEIAs, and the most recent datasets, respectively.
We’ll use the following, publicly available datasets:
School characteristics
Let’s start by getting a feel for the types of schools we’re going to be talking about. Below, we summarise the numbers of schools by type in 2016, 2022, and 2024. We compare the original opportunity areas with the other PEIAs, and with all other areas.
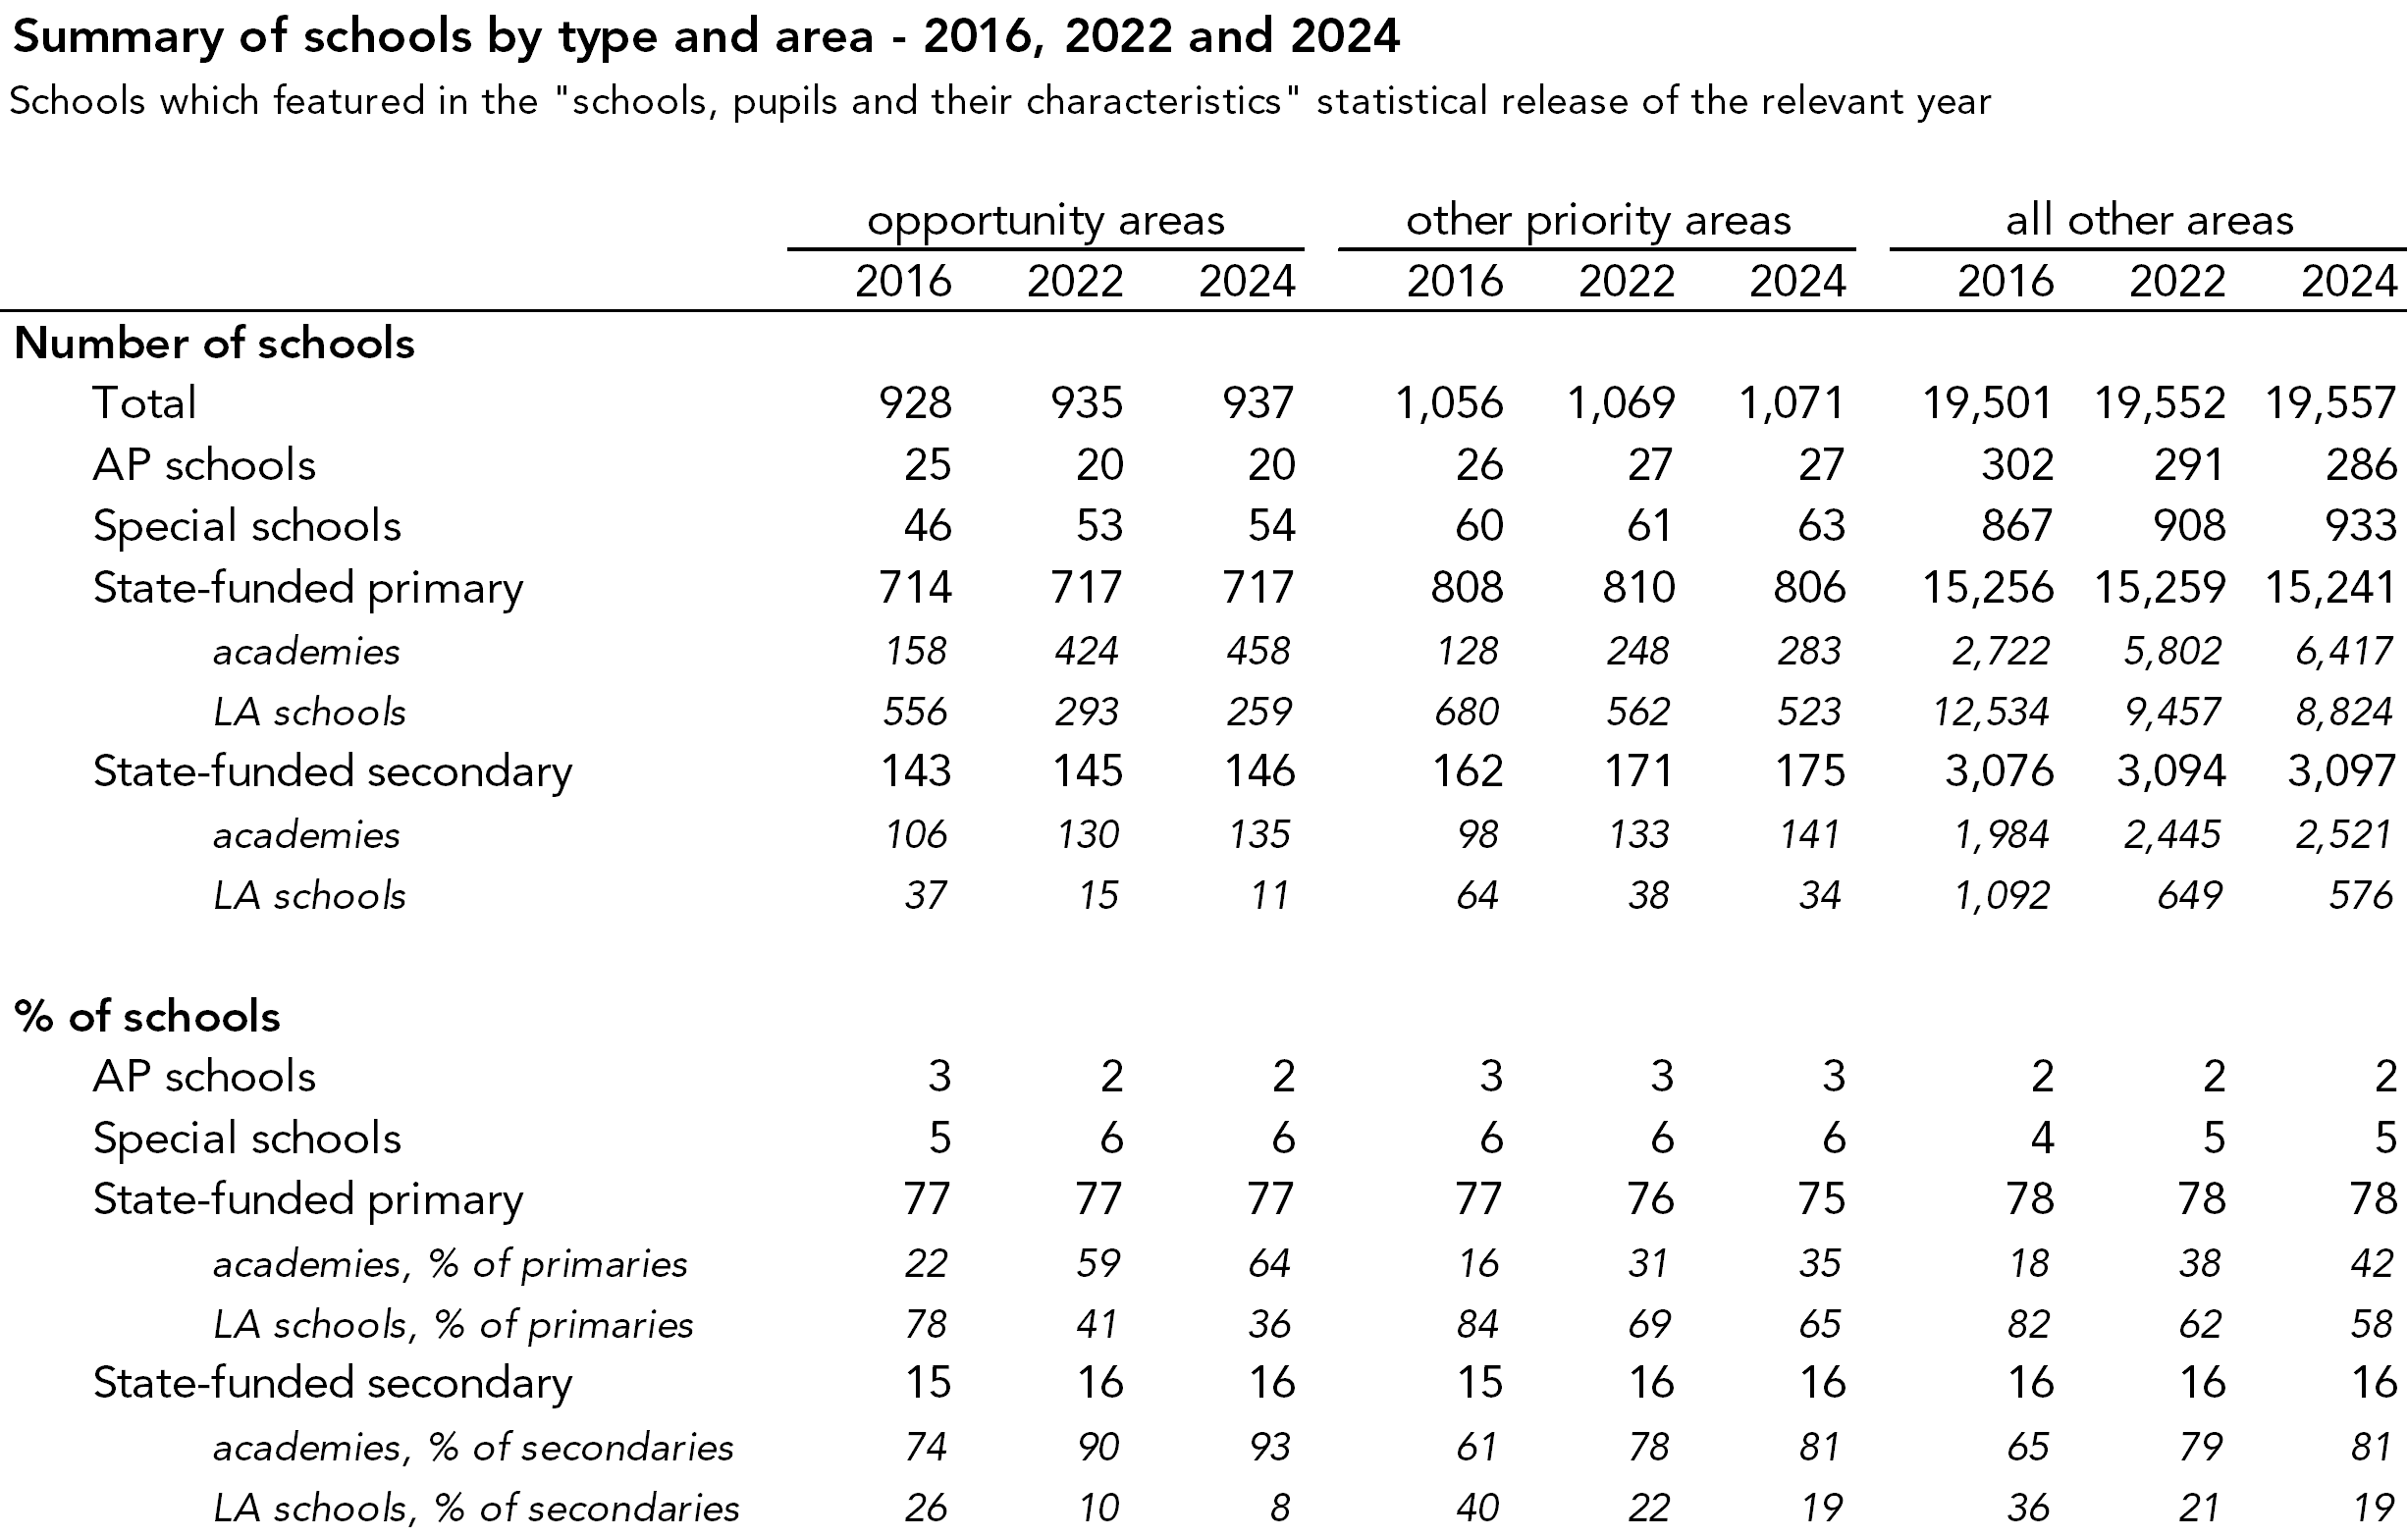
Opportunity areas and other PEIAs had a slightly higher proportion of non-mainstream schools than other areas – around 8% vs 6% of schools in the most recent year.
The biggest difference though is in the governance of mainstream schools. While the proportion of mainstream schools which were academies increased nationally between 2016 and 2024, there was a bigger increase in opportunity areas than elsewhere.
This meant that, in 2016, schools in opportunity areas were slightly more likely to be academies than those in other areas, but by 2024 they were much more likely to be academies. The vast majority of this increase came between 2016 and 2022.
The same is not true for schools in other PEIAs, however. In 2016 (before these areas had been identified) they were slightly less likely to be academies than schools in other areas, and this remained broadly true in 2022 and 2024.
Pupil characteristics
Now let’s look at pupil characteristics in these areas. Below we plot the percentage of pupils in mainstream schools who were eligible for free school meals (FSM) and whose first language was believed to be other than English (EAL).
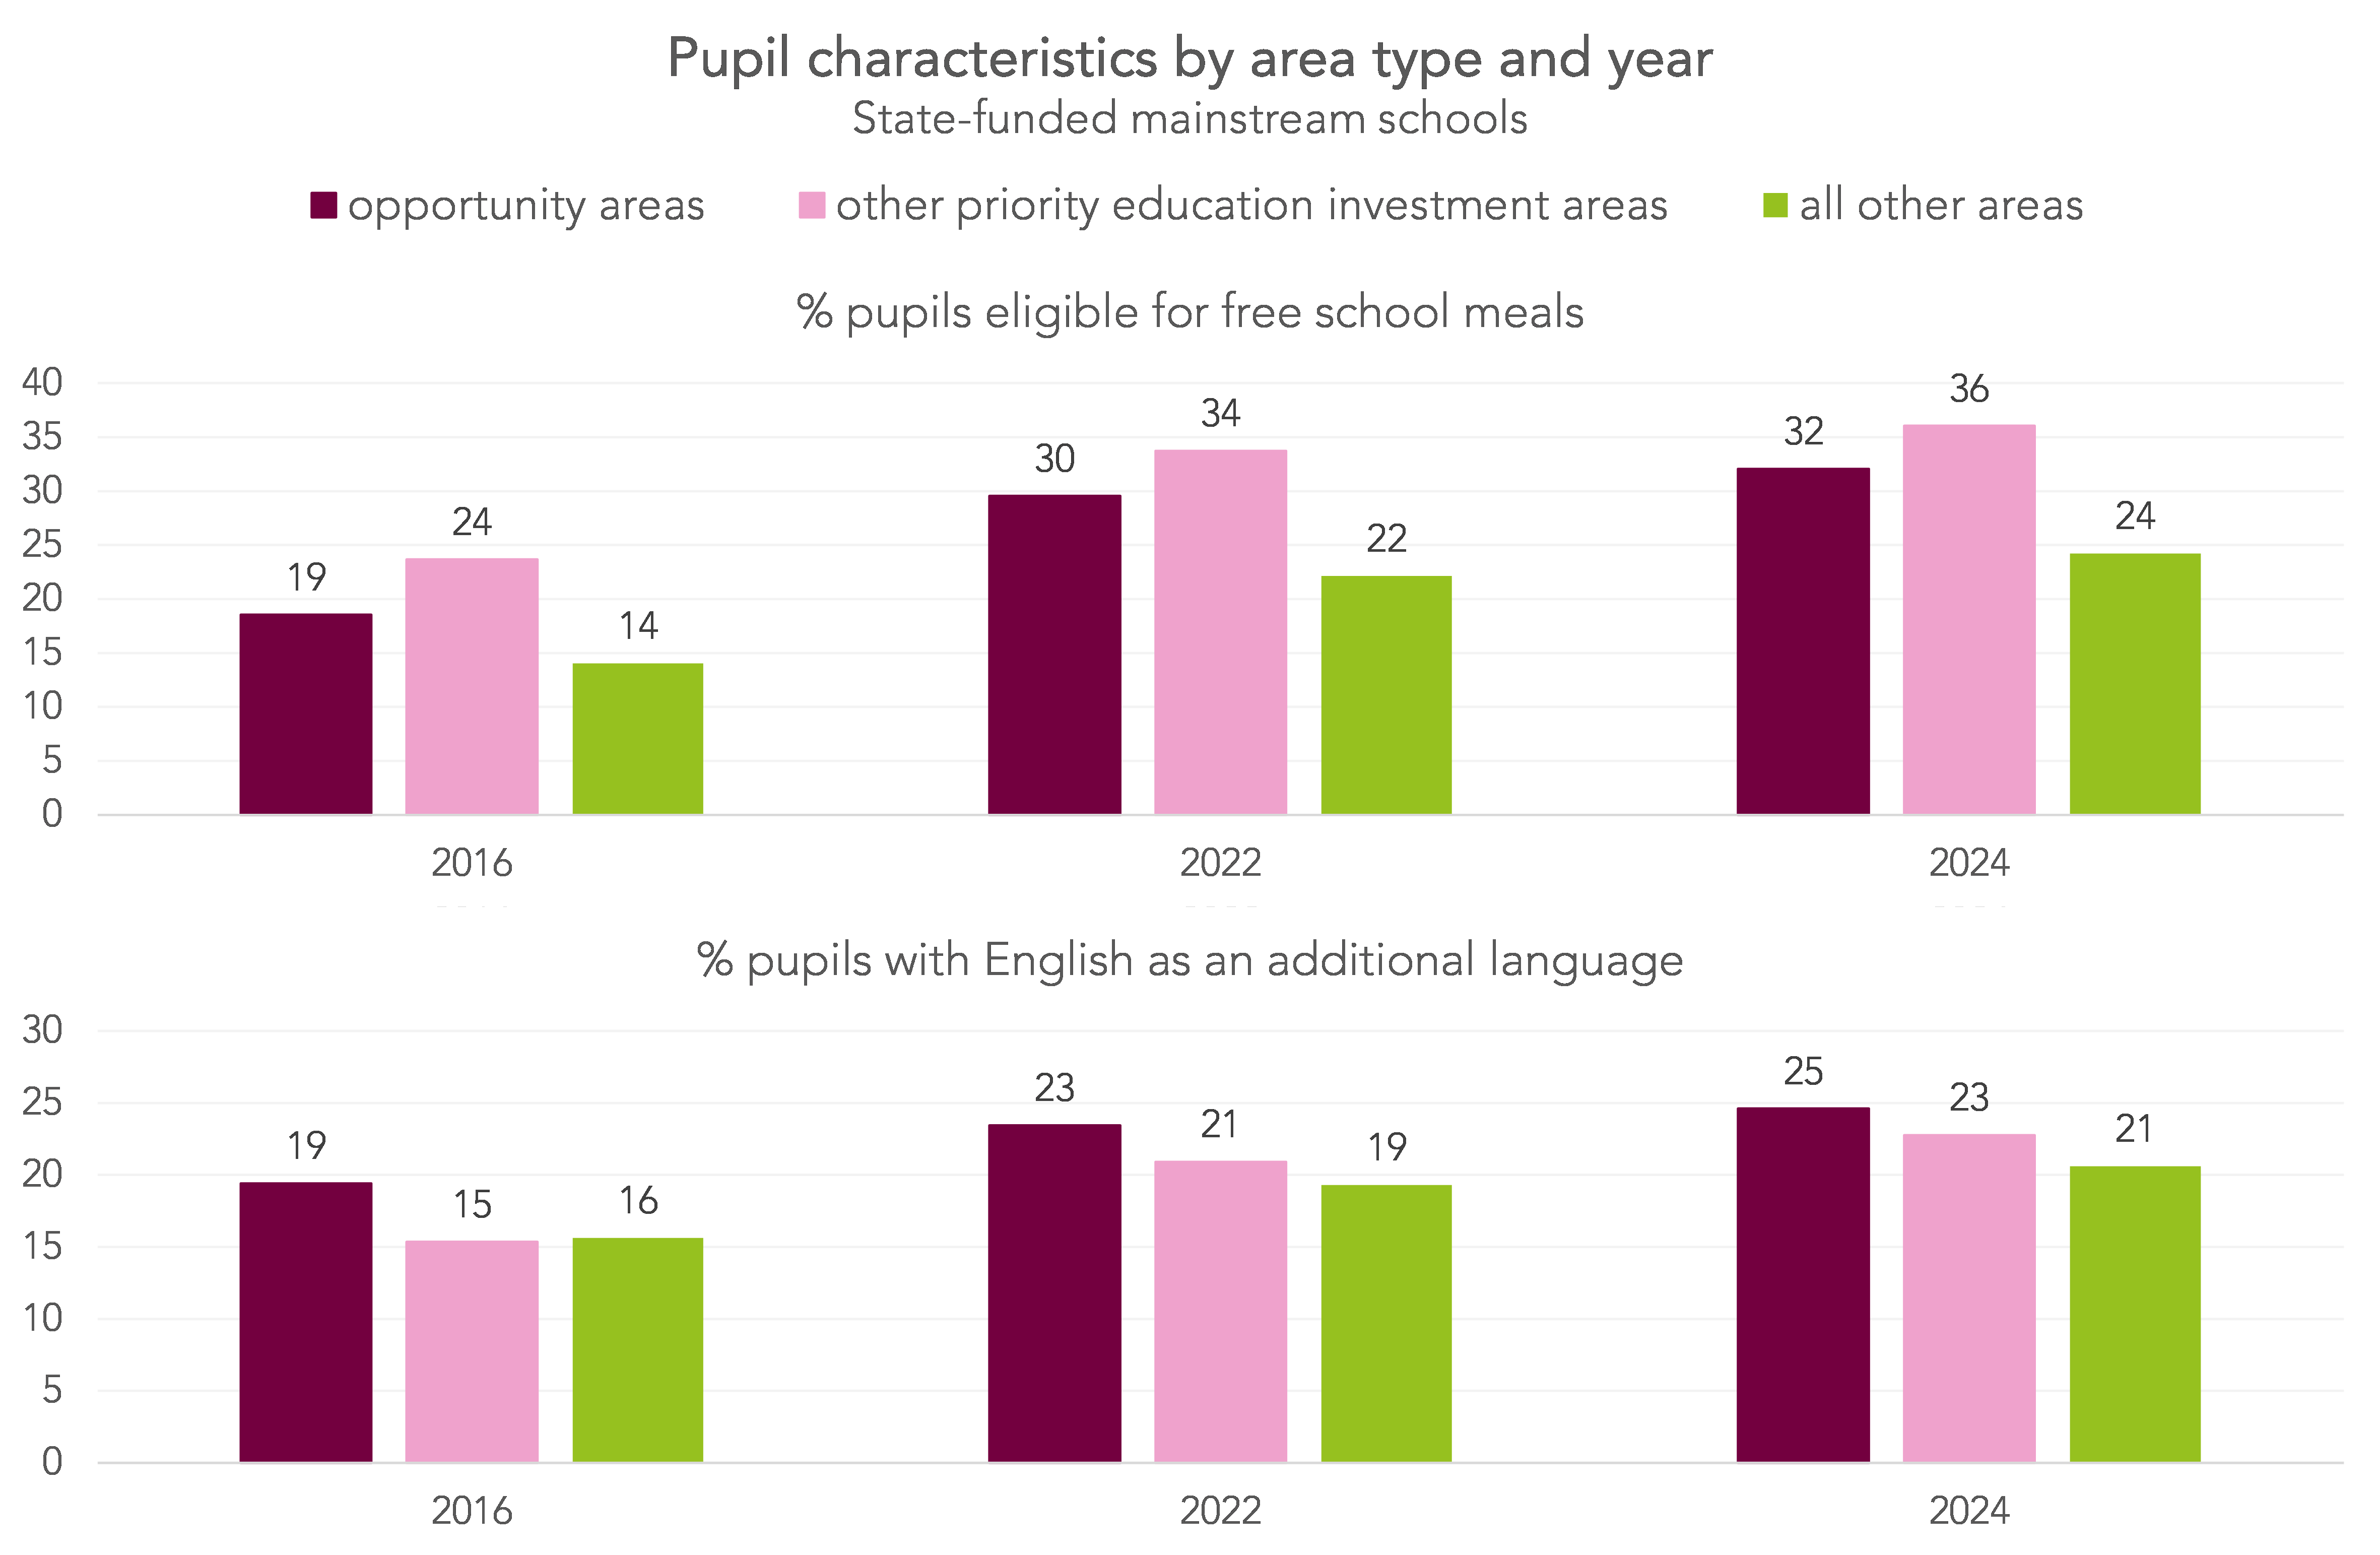
In each year, the additional PEIAs had the highest percentage of pupils eligible for FSM, followed by the original opportunity areas, then all other areas. Although it may seem it, this is not a surprising result. The selection criteria for the original opportunity areas did not explicitly include levels of disadvantage, whereas those for the additional PEIAs did.
The proportion of pupils eligible for FSM increased in all areas over time, largely due to eligibility protections put in place during the rollout of Universal Credit. The increase between 2016 and 2022 was slightly greater, in percentage point terms, in opportunity areas and other PEIAs than in other, non-priority investment areas.
The additional PEIAs had a similar proportion of pupils with EAL as non-PEIAs. Opportunity areas tended to have a slightly higher proportion of pupils with EAL than both of the other area types.
We provide the breakdown for individual areas here (xlsx).
Key Stage 4 outcomes over time
We’ll move on now to changes in academic outcomes over time, starting with Key Stage 4. Below, we plot the average Progress 8 score over time of state-funded, mainstream, non-selective schools by area type[1].
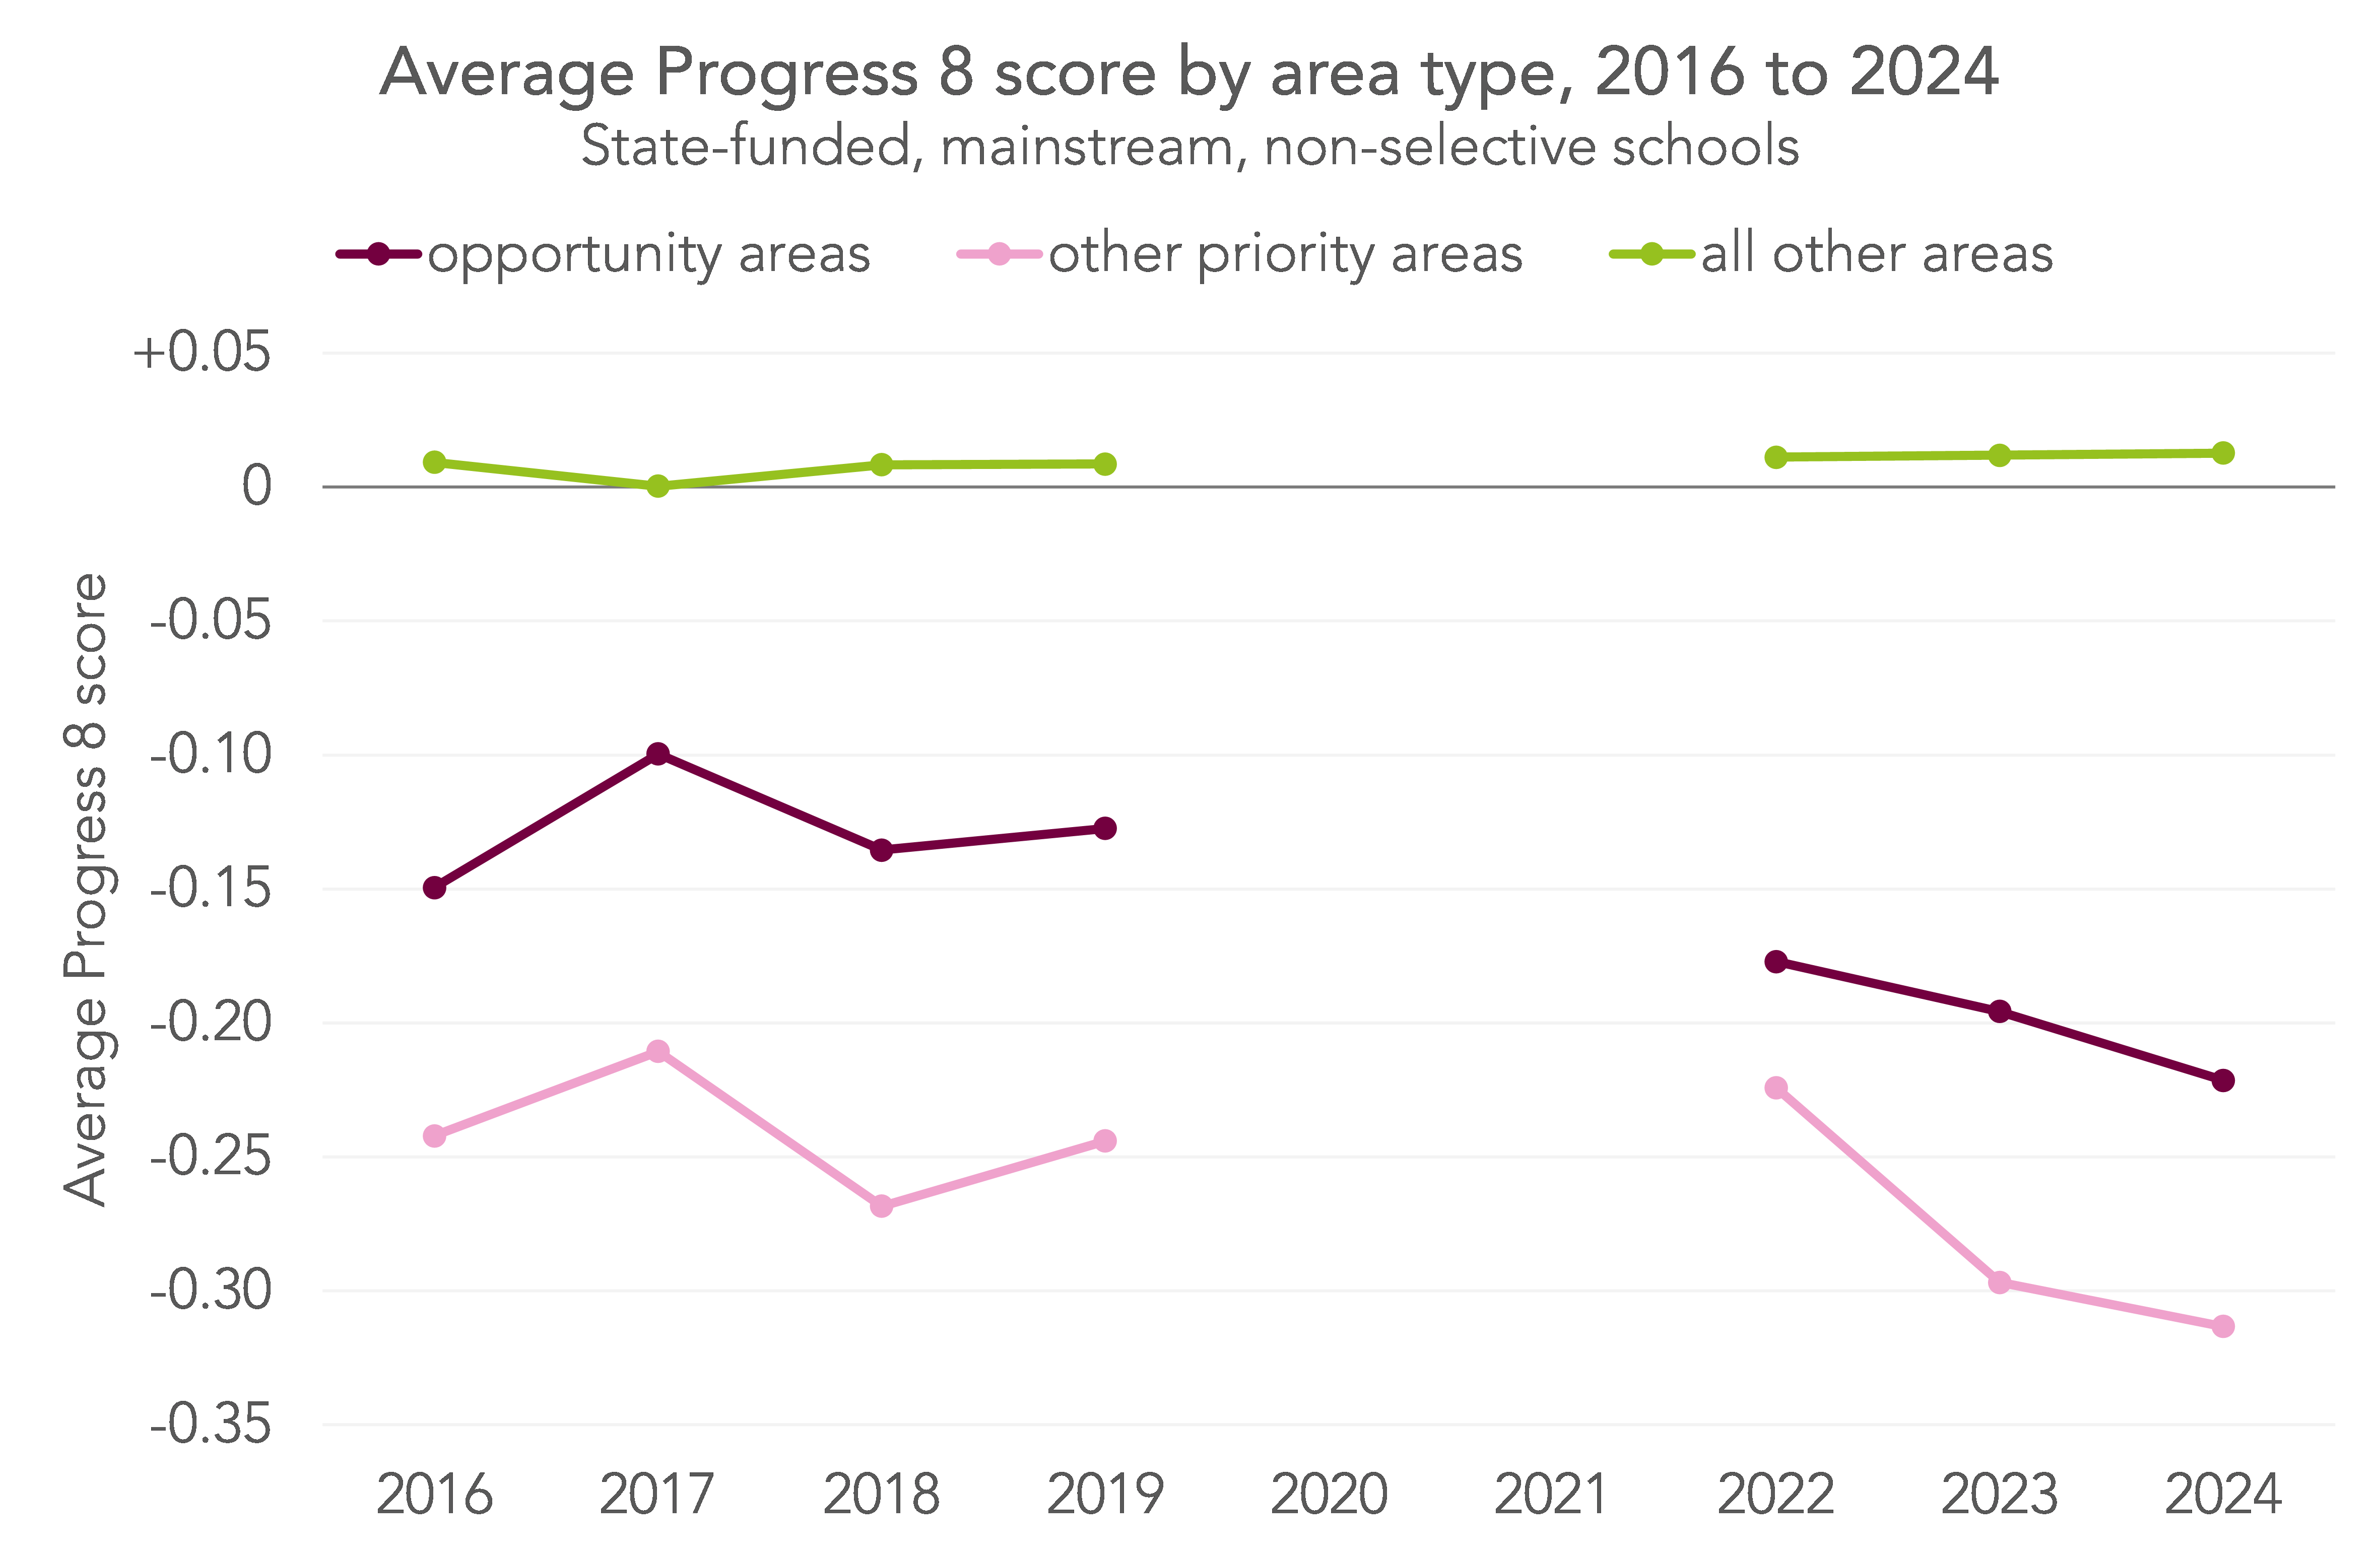
Overall, Progress 8 tended to be higher in opportunity areas than other PEIAs, but lower than in non-PEIAs.
There was a small improvement in Progress 8 for schools in opportunity areas between 2016 and 2019. However, scores in 2022, after the pandemic, were lower, and they dropped slightly in each successive year. Overall, Progress 8 in opportunity areas fell from -0.15 in 2016 to -0.22 in 2024.
In other PEIAs, scores were slightly higher after the pandemic than before, though fell more sharply thereafter. Progress 8 in other priority investment areas fell from -0.22 in 2022 to -0.31 in 2024.
So we’ve seen that, as a group, both the original opportunity areas and the additional PEIAs saw their Progress 8 scores decrease slightly between the time they were identified and the most recent set of Key Stage 4 exams. But what happened in each area individually?
Below, we plot each opportunity area by its average Progress 8 score in 2016 (the x-axis) and 2024 (the y-axis). Any areas plotted above the grey dotted line saw their score increase between 2016 and 2024, and any below saw their score decrease.
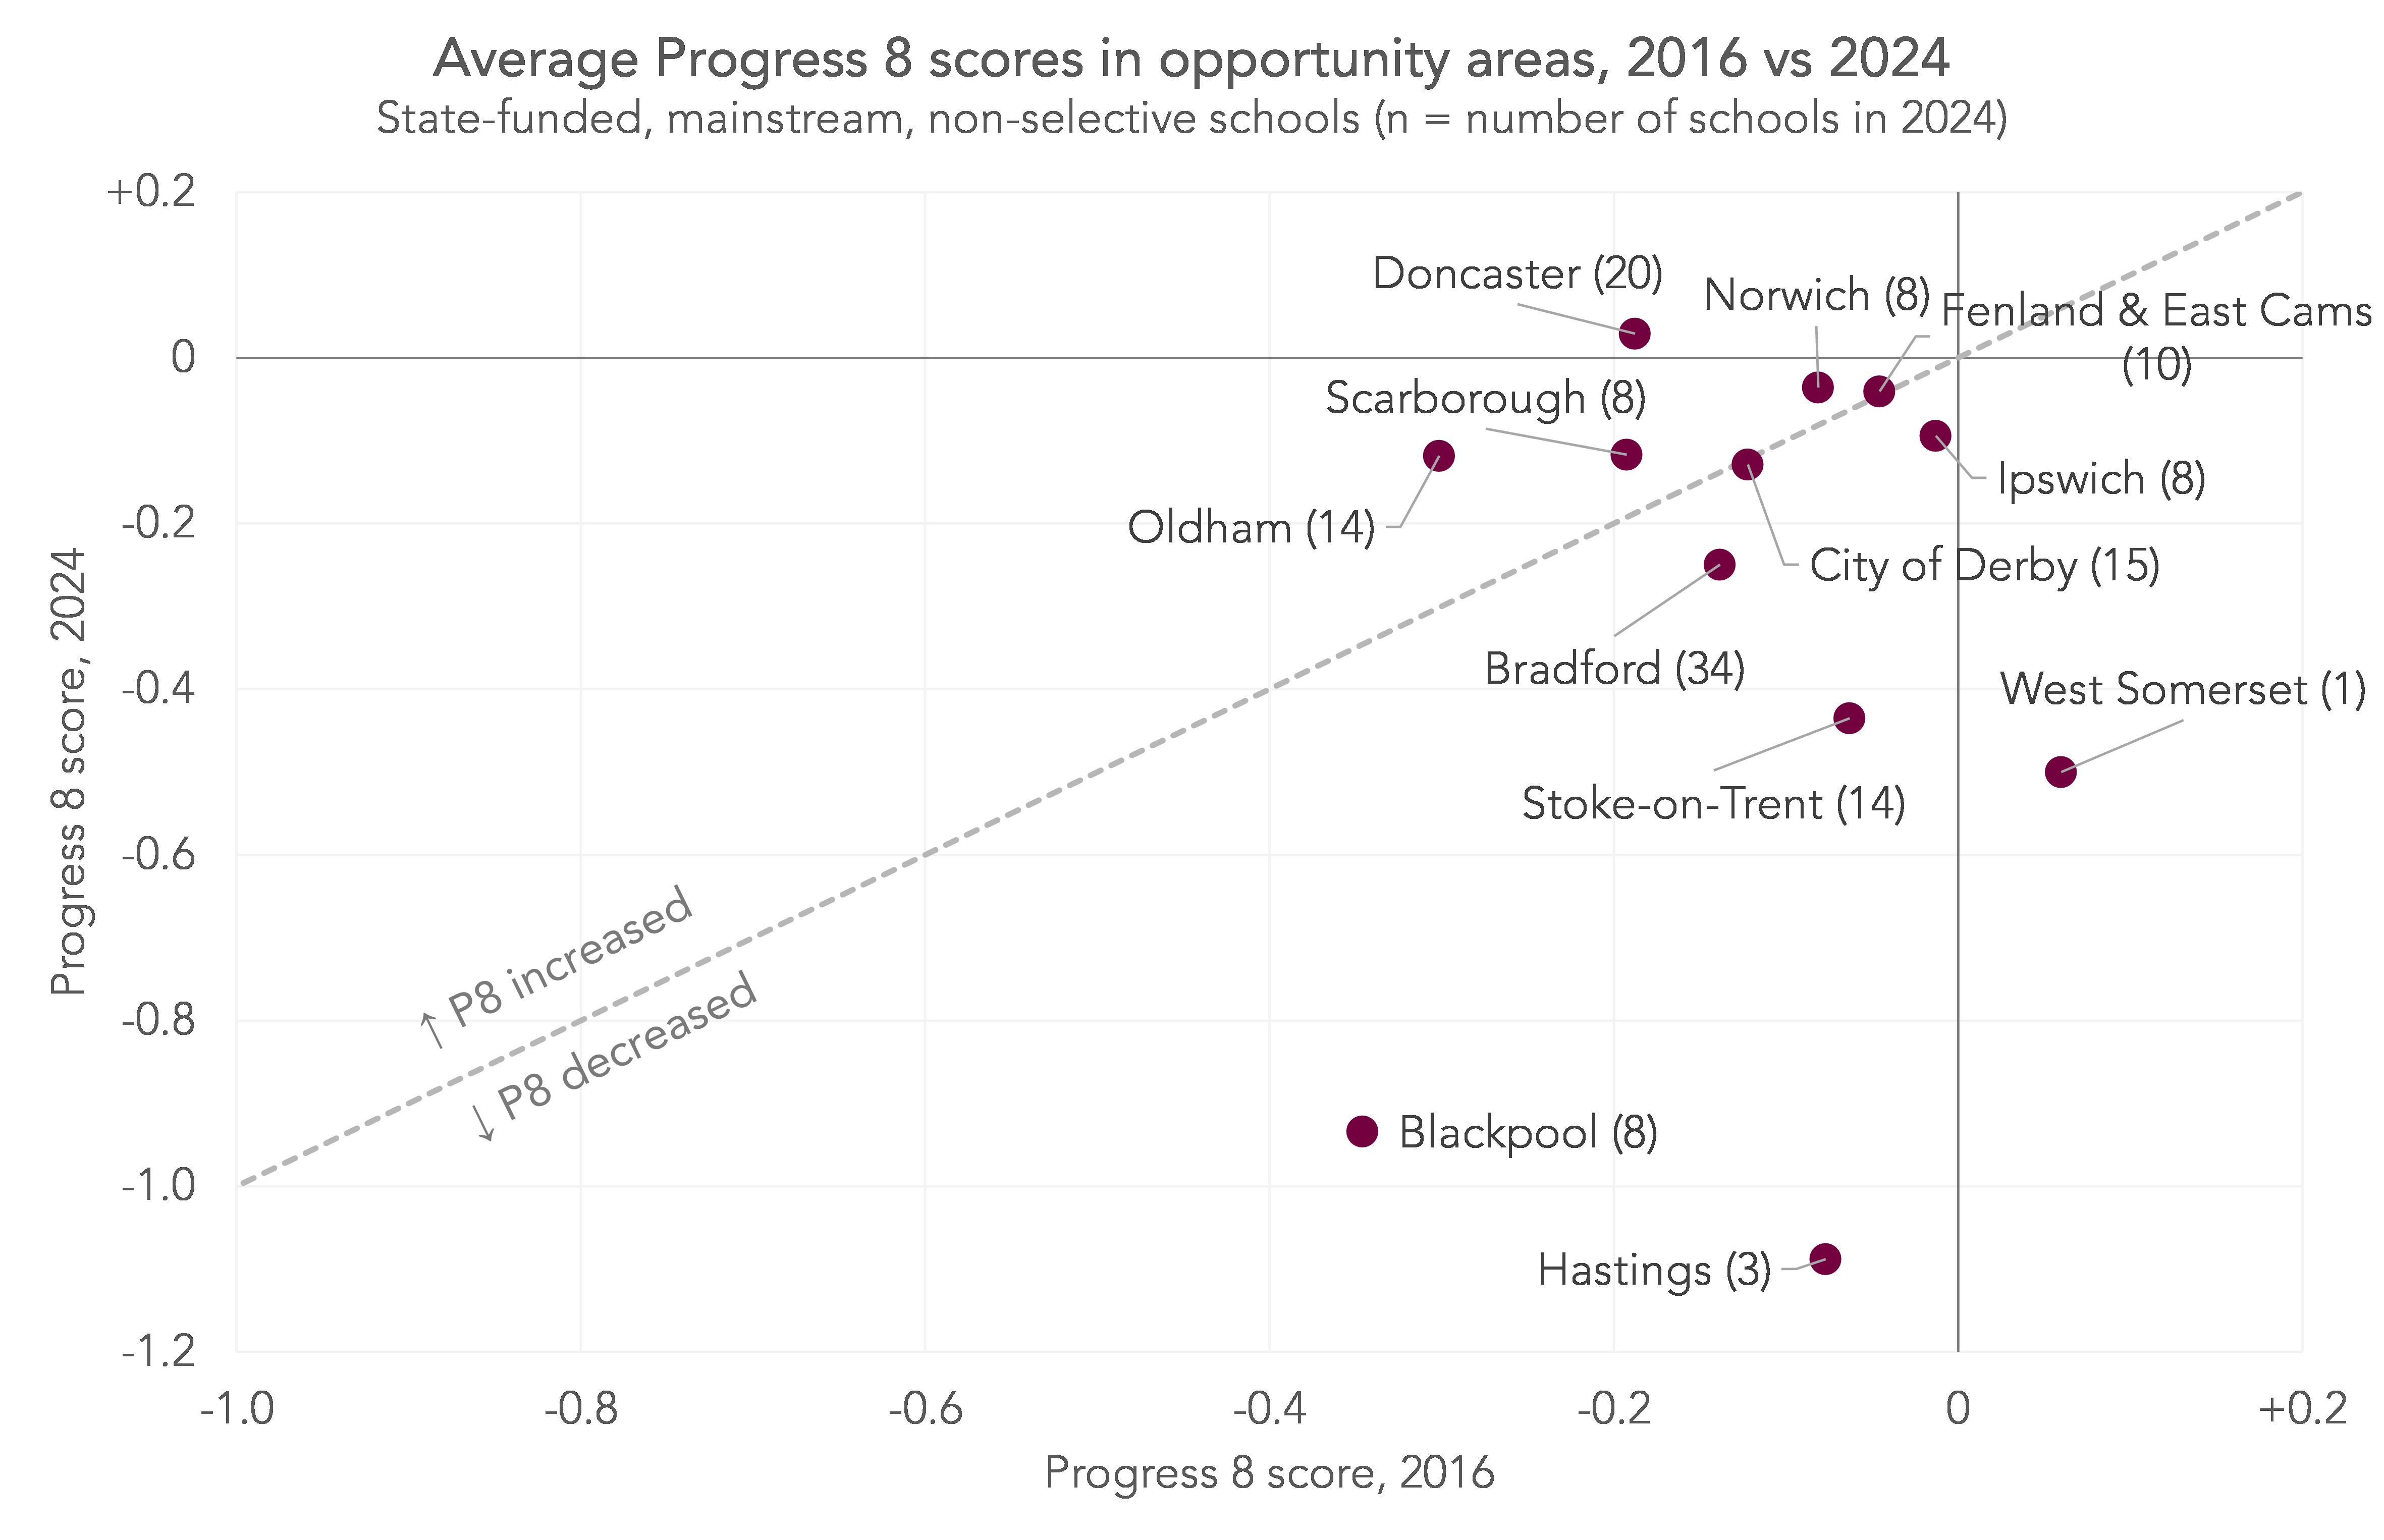
In contrast to the picture for opportunity areas as a whole, half of the areas actually saw their scores stay the same or increase (we’ve included Derby in this, which technically saw its score decrease by 0.01.) The biggest positive changes were in Doncaster (an increase of 0.22, from -0.19 in 2016 to +0.03 in 2024) and Oldham (an increase of 0.18, from -0.30 to -0.12).
Of the areas where Progress 8 worsened, Bradford and Ipswich saw the smallest drops (around 0.1 for each, from -0.14 to -0.25 for Bradford, and from -0.01 to -0.09 for Ipswich). The biggest negative change by far came in the three Hastings schools which, collectively, saw their score fall from -0.08 in 2016 to -1.09 in 2024. Blackpool also saw a large drop (of 0.59, from -0.35 to -0.93), as did the single West Somerset school (a fall of 0.56, from +0.06 to -0.50).
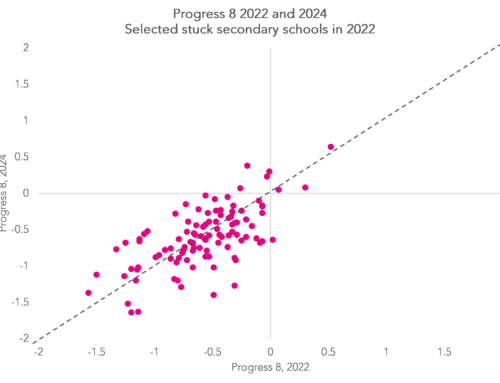
We can also plot the same information for the other PEIAs, comparing Progress 8 scores in 2022 and 2024.
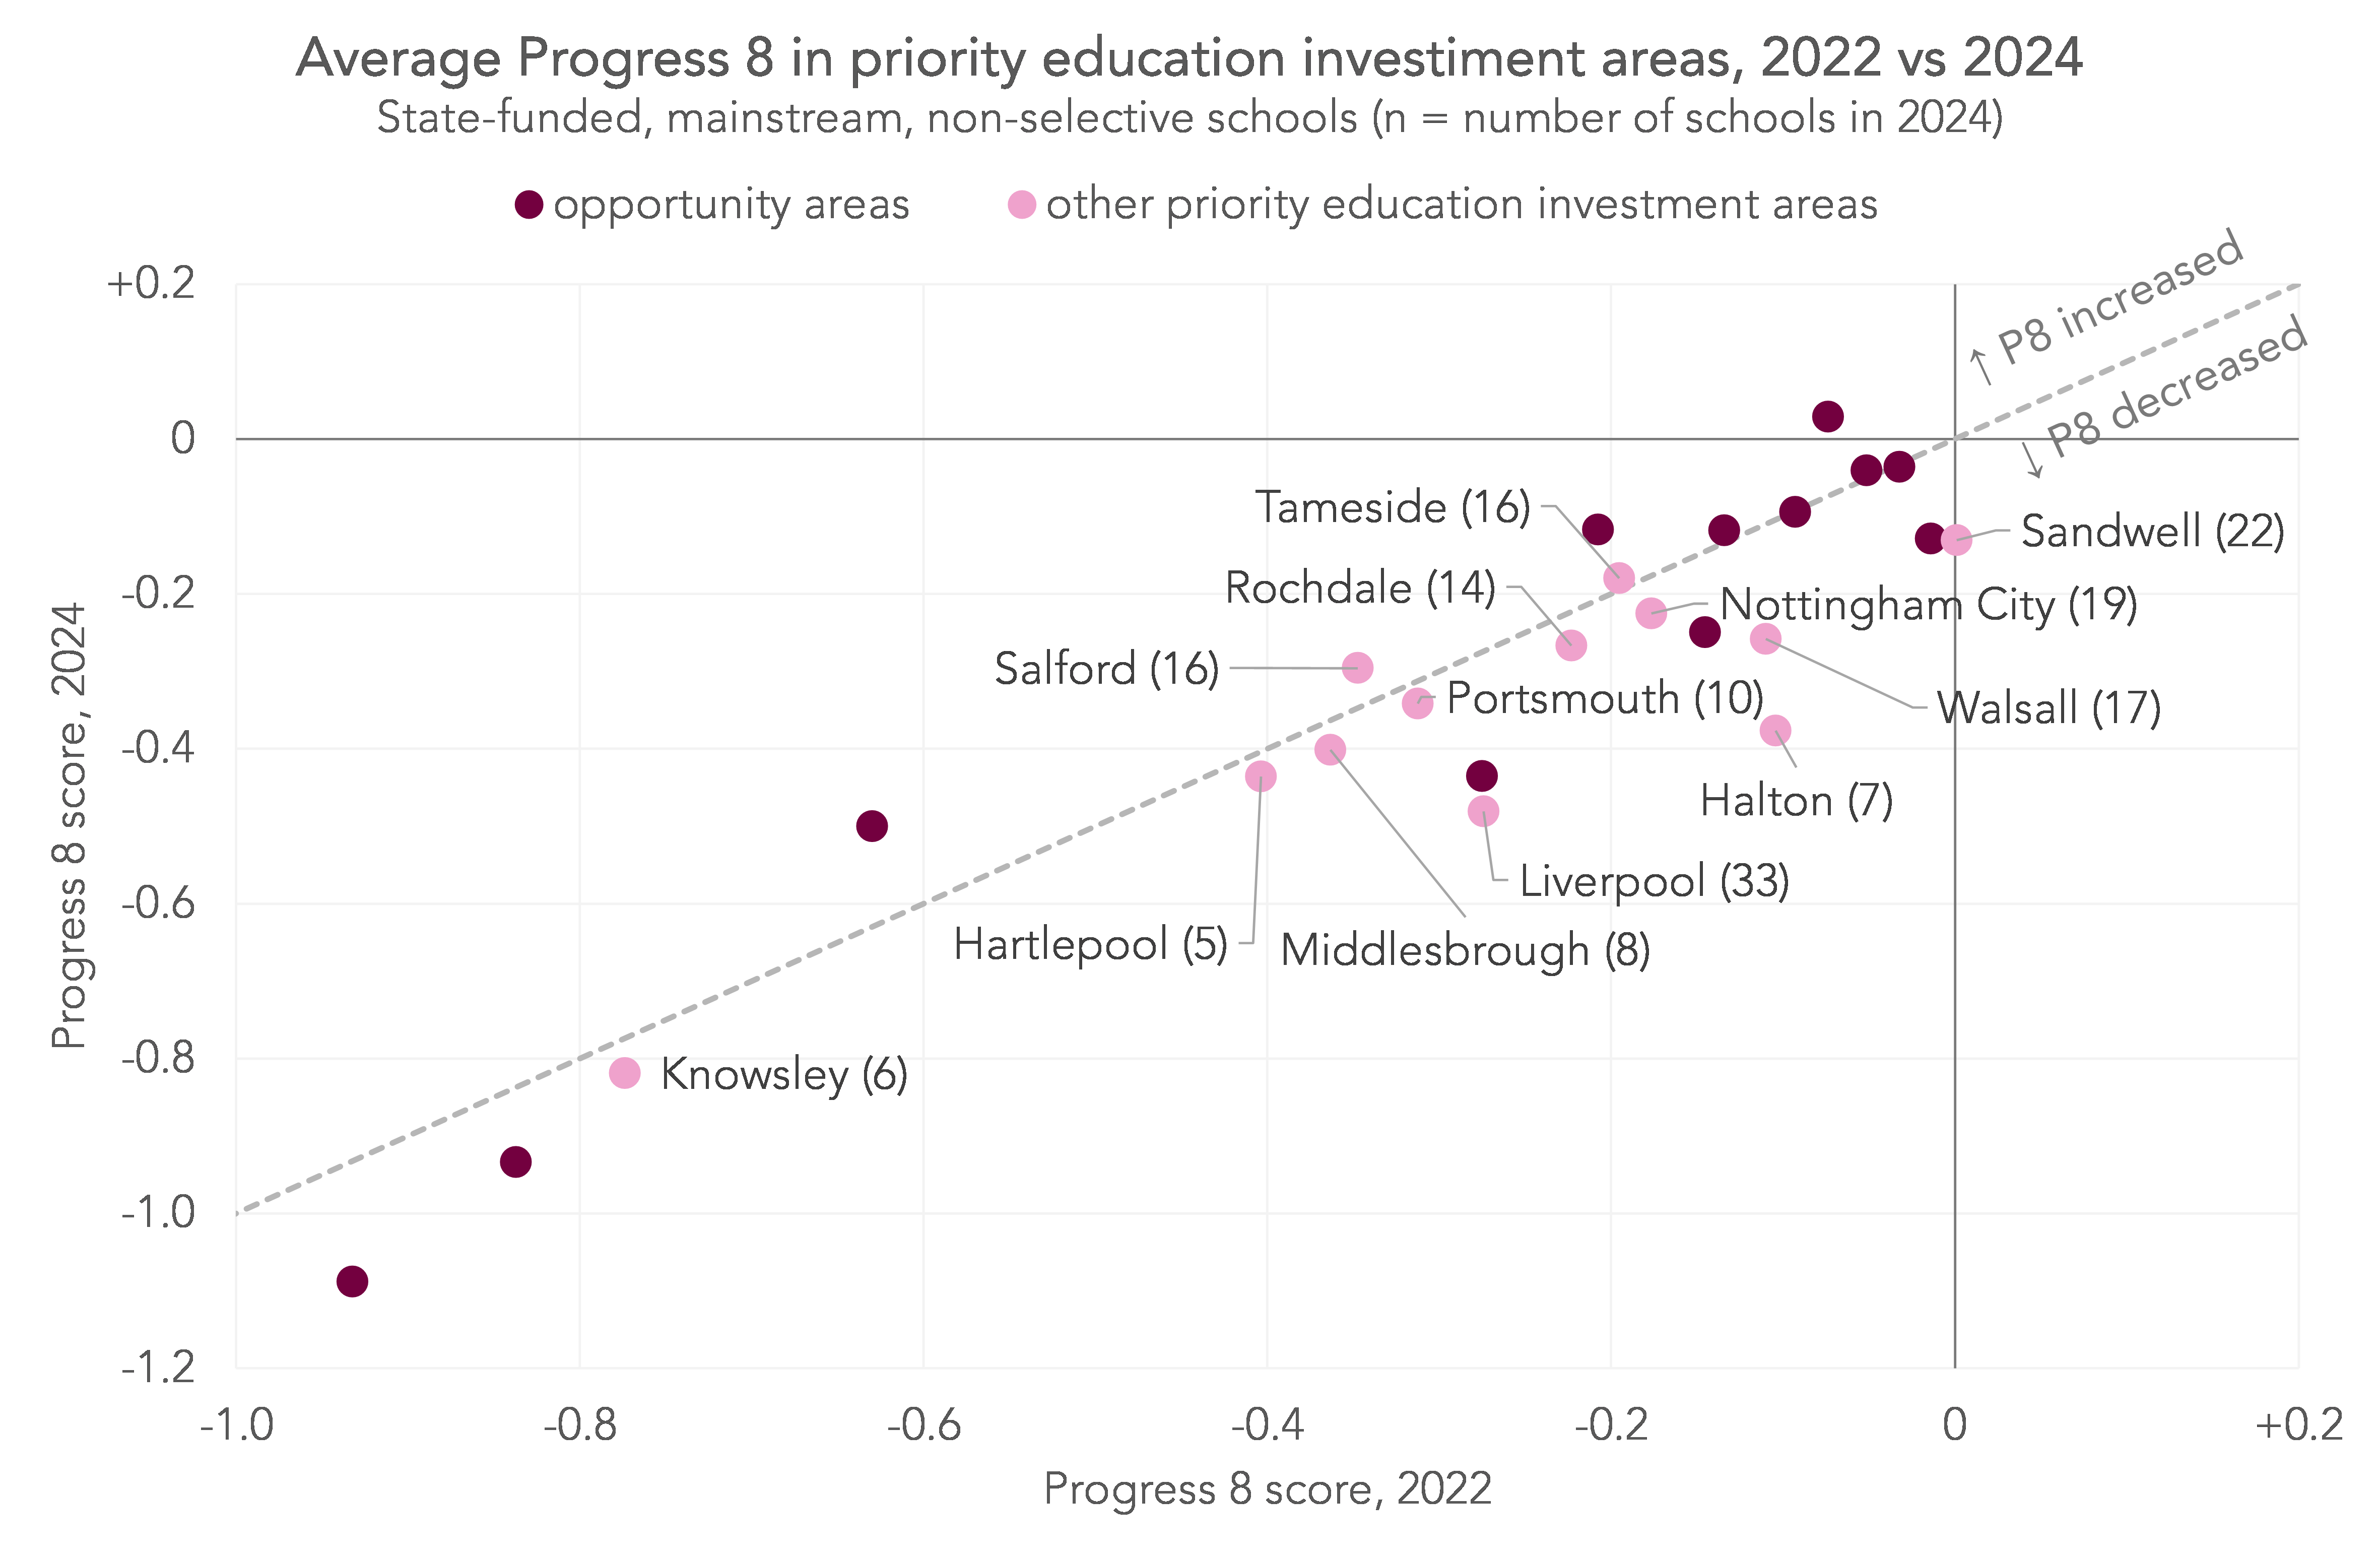
As we’d expect over a narrower timeframe, the magnitude of changes is smaller. Seven of the additional PEIAs saw scores in 2024 within 0.05 in either direction of their 2022 scores. Two of these – Salford and Tameside – were positive changes. The remaining five areas all saw drops of 0.1 or more. The biggest falls were in Halton (a fall of 0.27, from -0.10 to -0.38) and Liverpool (down 0.21, from -0.33 to -0.48).
Key Stage 2 outcomes over time
Now let’s look at changes in Key Stage 2 outcomes over time. Here we focus on the percentage of students meeting the expected standard in Key Stage 2 reading, writing (teacher assessed), and maths.
Below we plot this metric over time for opportunity areas, the additional PEIAs, and all other areas. Note that here, we start our time series in 2017 rather than 2016. We do this because 2016 was the first year in which the new, current version of the Key Stage 2 tests was administered, and scores tend to be substantially lower when tests are taken for the first time. (Nationally, 54% of pupils met the expected standard in all three subjects in 2016, and 62% in 2017.)
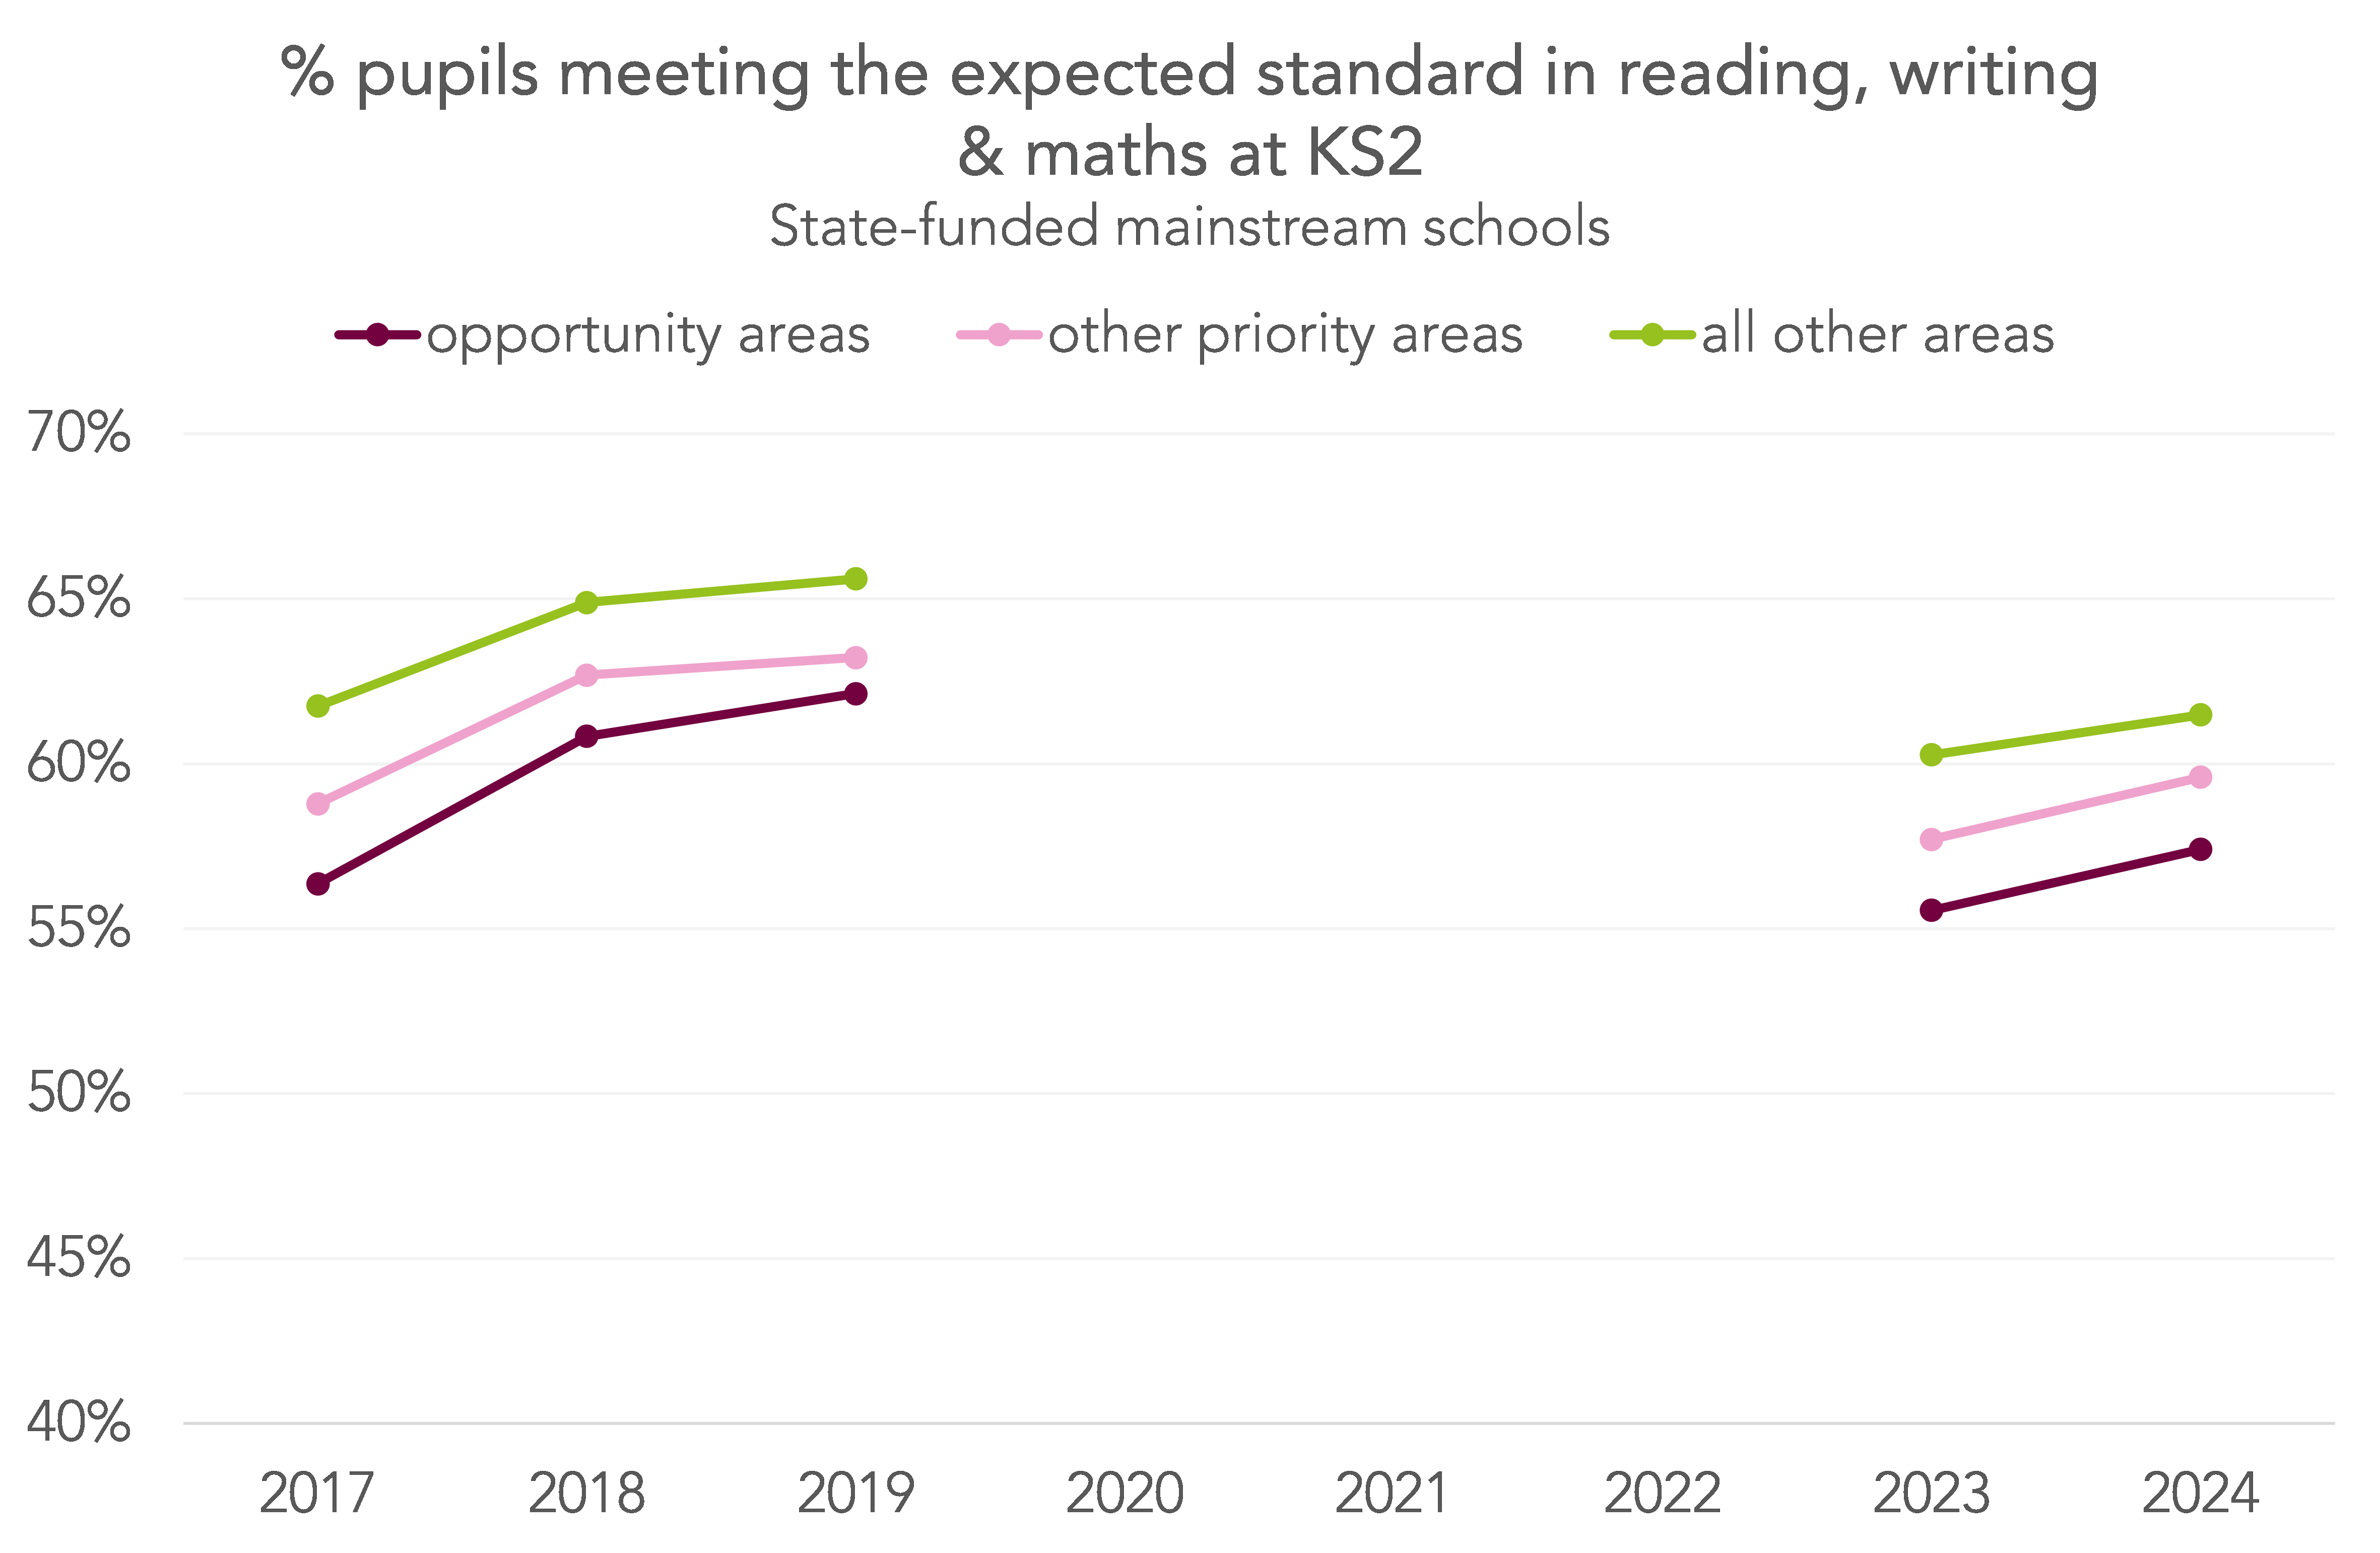
The overall picture for opportunity areas and other PEIAs looks a little more positive here than at Key Stage 4. We can see that the broad shape of all of the lines is similar, but between 2017 and 2019, the gap between opportunity areas and all non-PEIAs narrowed from 5.4 percentage points to 3.5 percentage points. There was also a slight narrowing of the gap post-pandemic, between 2023 and 2024[2], for both opportunity areas and other PEIAs.
Again, we can look at each area individually. For opportunity areas, we’ll compare the proportion of pupils meeting the expected standard in the three subjects in 2017 (on the x-axis) with 2024 (on the y-axis). We also add a green point for the national proportion, which was around 61% in both years.
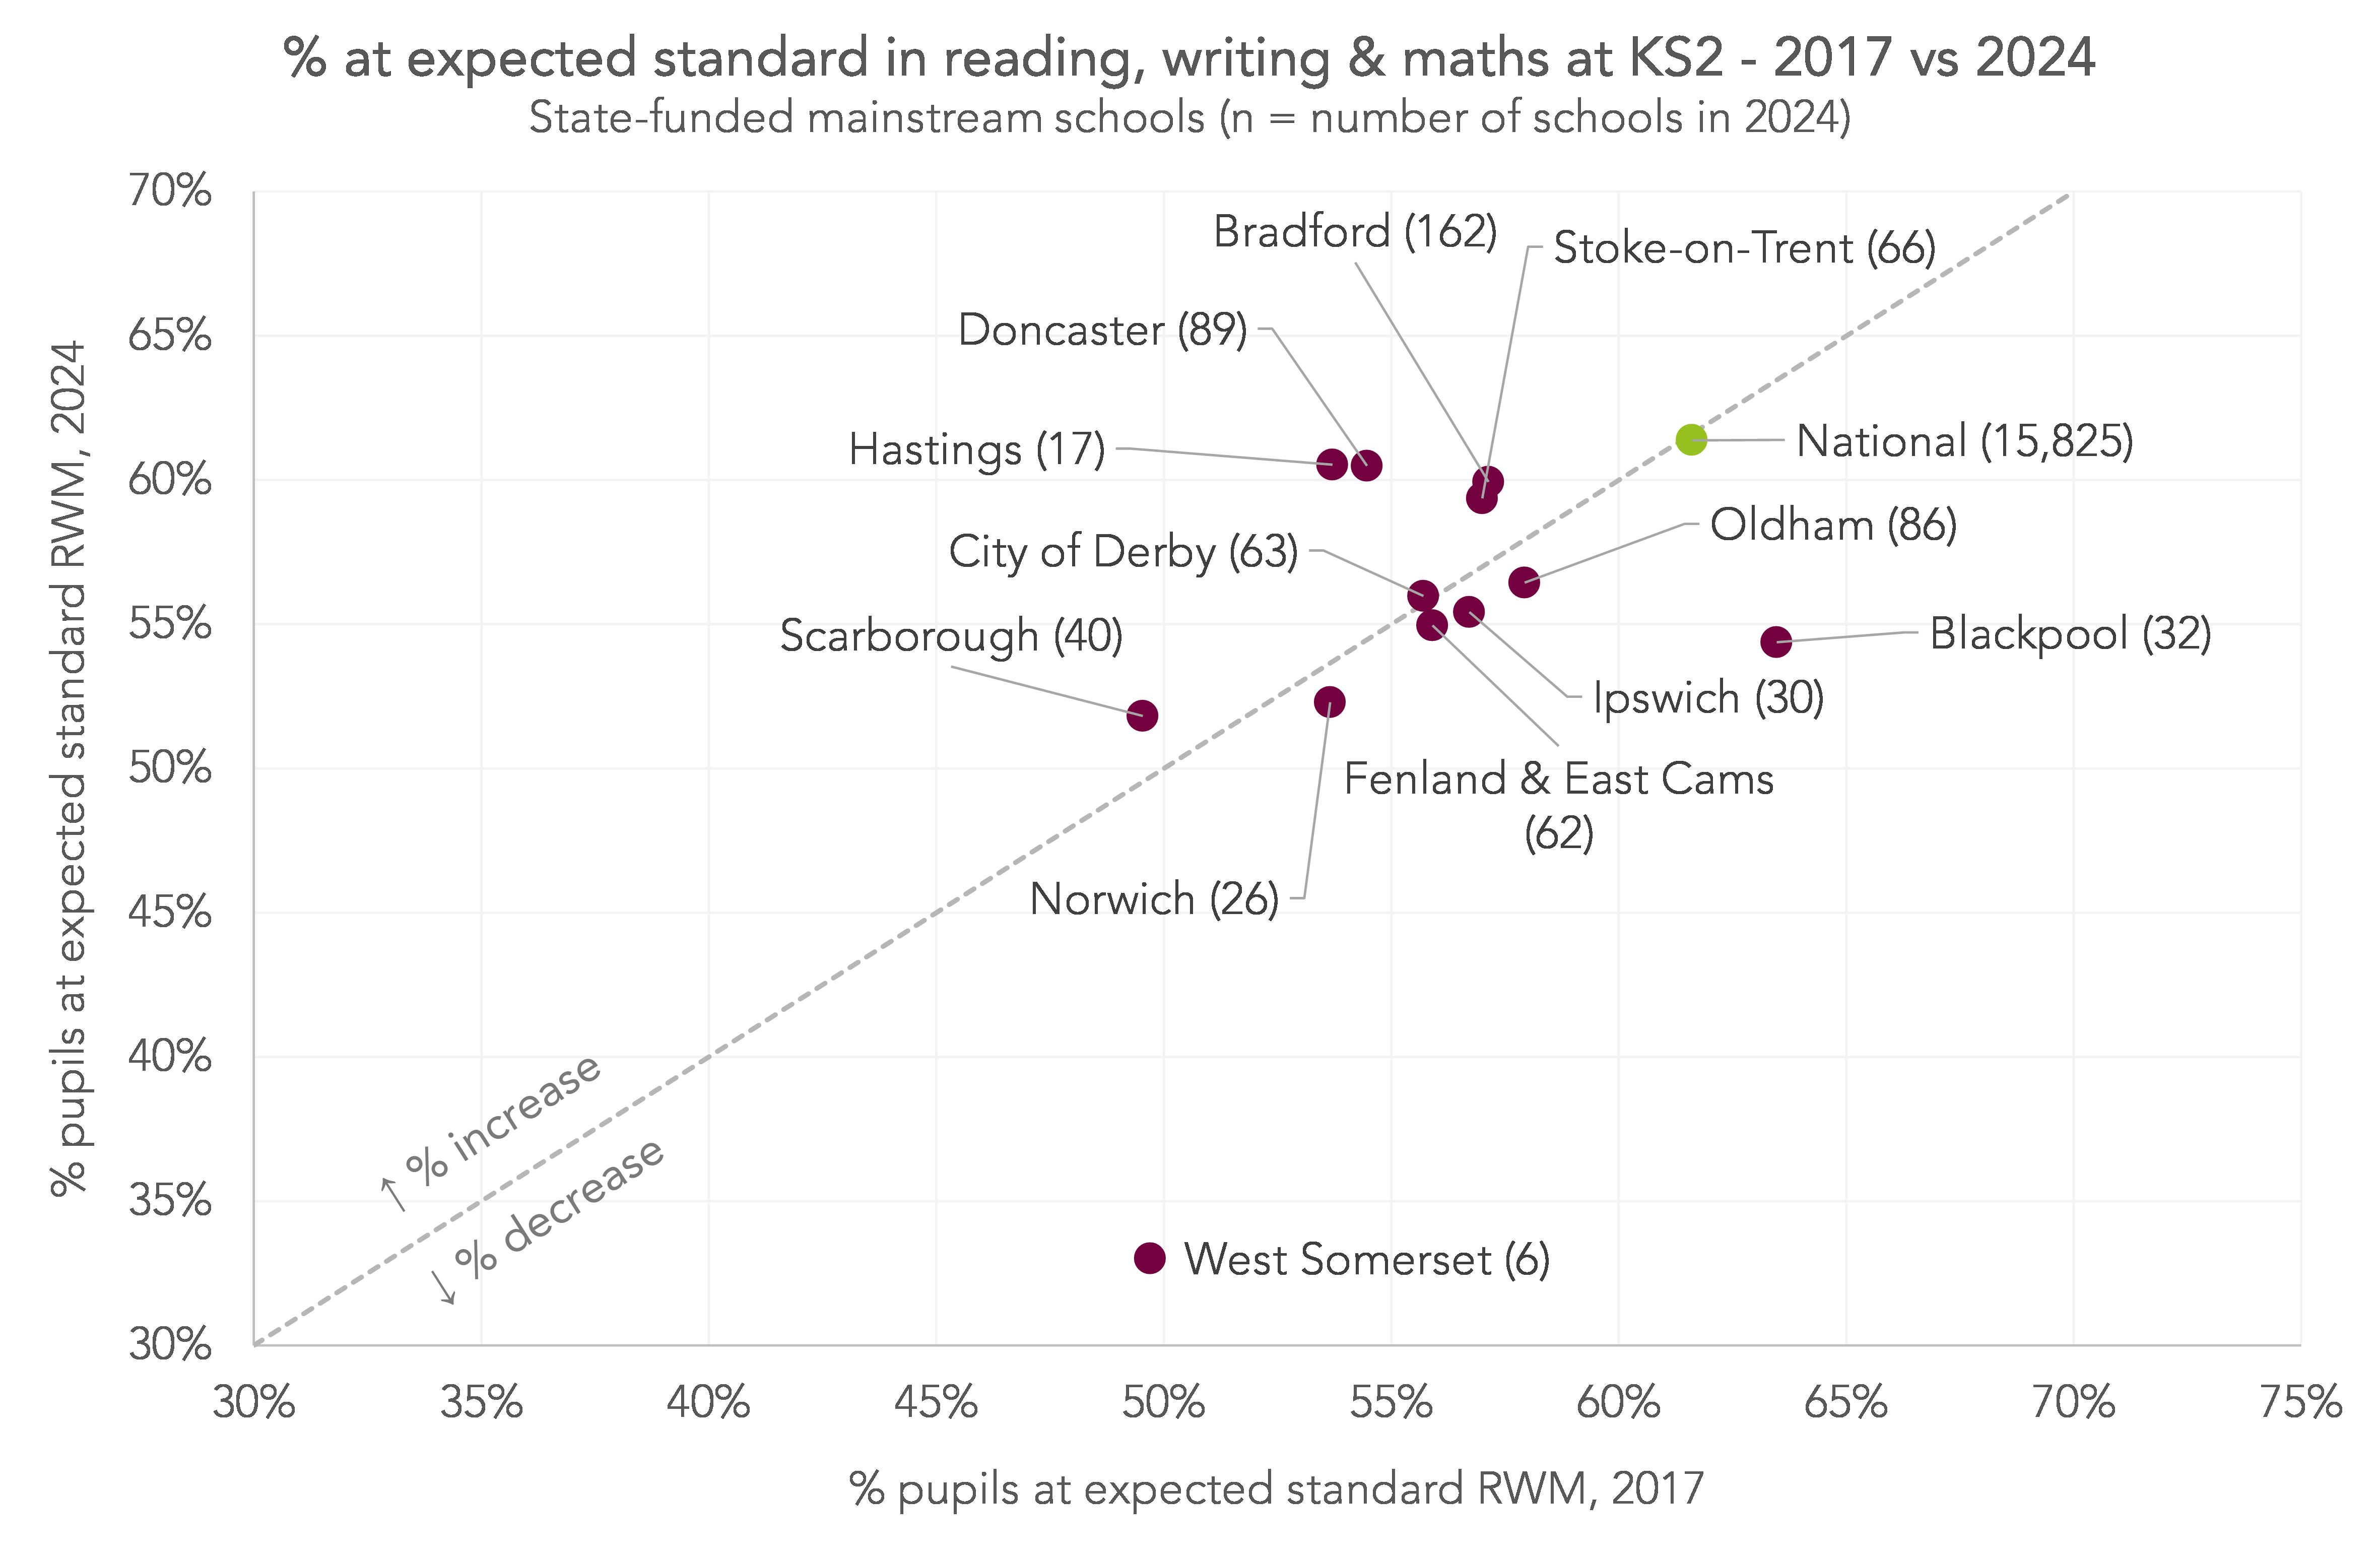
Half of opportunity areas saw increases and half saw decreases. In contrast with changes at Key Stage 4, Hastings was the area with the biggest increase at Key Stage 2: 60.5% of pupils reached the expected standard in 2024, up 6.8 percentage points from 53.7% in 2017. Doncaster wasn’t far behind with an increase of 6.0 percentage points, from 54.5% to 60.5%. The biggest fall came in the handful of West Somerset schools (down 16.7 percentage points, from 49.7% to 33.0%). Blackpool, the only opportunity area with an above average percentage of pupils meeting the expected standard in 2017, was the area with the second biggest fall (down 9.1 percentage points, from 63.5% to 54.4%).
To finish, we’ll look at how scores in the other PEIAs changed. Here, we’re only able to compare 2023 and 2024, as Key Stage 2 results were not published in 2022. As results increased nationally between the two years, we add a second line to the chart representing the national increase. Areas above this line increased their proportion by more than the national increase, and vice versa.
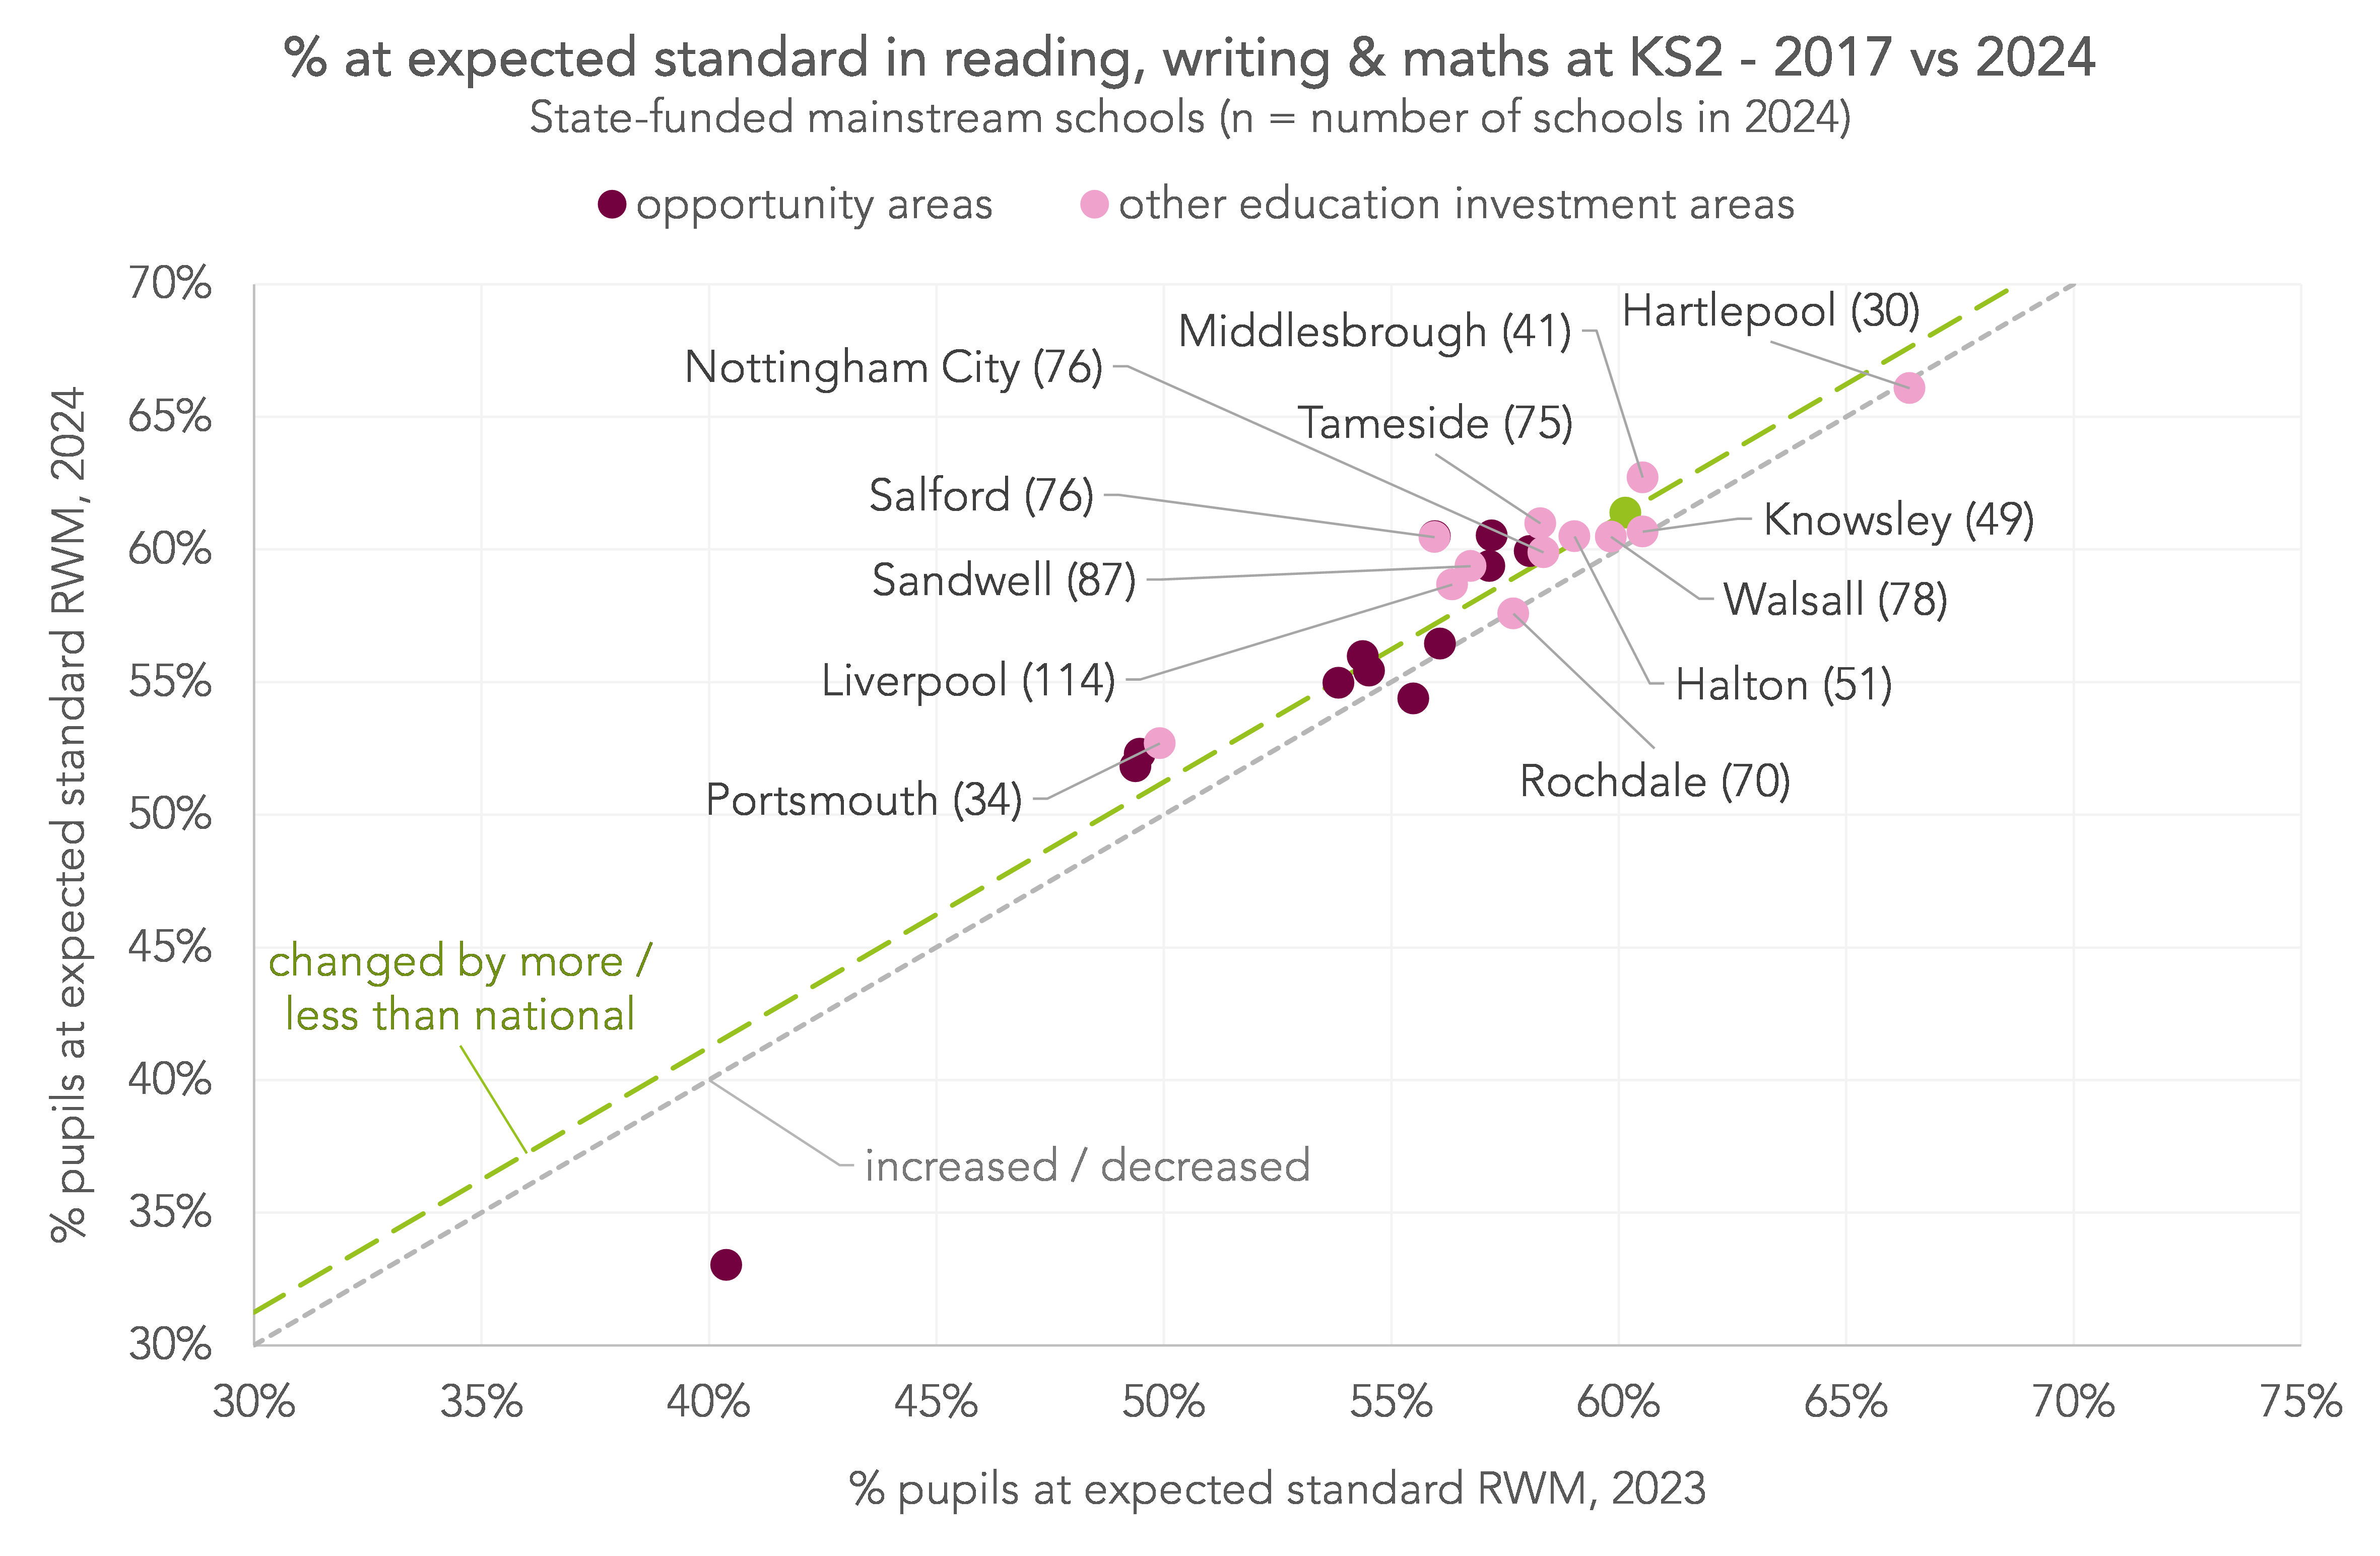
As we’d expect when looking at changes over a single year, most areas are quite tightly clustered around the two diagonal lines, indicating that not much has changed.
None of the additional PEIAs saw decreases in the percentage of pupils meeting the expected standard. Eight of the twelve areas saw increases which were either in-line with or above the national increase. The biggest positive change was in Salford, where there was an increase of 4.5 percentage points, from 55.9% in 2023 to 60.5% in 2024.
Summing up
Overall, pupils in the original twelve opportunity areas saw a slight improvement in Progress 8 scores between 2016 and 2019, but a fall post-pandemic meant than scores were lower in 2024 than 2016. There were particularly large drops in Hastings and Blackpool, but small increases in Doncaster and Oldham. Scores also fell between 2022 and 2024 in the additional PEIAs, most notably in Liverpool and Halton.
At Key Stage 2, the proportion of pupils in opportunity areas reaching the expected standard in reading, writing and maths was broadly similar in 2017 and 2024, in-line with the national picture. Blackpool saw quite a large drop, but Hastings saw the biggest increase of any opportunity area.
The period of time we’re looking at not only includes a pandemic, but also big changes to assessment and accountability arrangements. And, although attainment and progress are important, there were other things the policy aimed to improve that we haven’t looked at, for example, teacher recruitment and retention. We therefore can’t draw any conclusions from this as to whether opportunity areas or education investment areas “worked” as a policy.
Want to stay up-to-date with the latest research from FFT Education Datalab? Sign up to Datalab’s mailing list to get notifications about new blogposts, or to receive the team’s half-termly newsletter.
[1] In 2024, there was one selective school in an opportunity area (Stoke-on-Trent), and three in other PEIAs (one in Liverpool and two in Walsall). Of all pupils reaching the end of KS4 in mainstream schools that year, 0.5% of those in opportunity areas, 1.5% of those in other PEIAs, and 4.7% of those in other areas attended selective schools.
[2] Key Stage 2 performance tables were not published in 2022, the first year KS2 tests were conducted after the pandemic.

Thanks for the analysis Katie. Really interesting. In addition to KS2 and KS4, Oldham Opportunity area also had a focus on Early Years. Did you take a look at the data from that phase?
Hi Tony. Thanks, that’s useful context. We didn’t look at early years as part of this analysis, but those figures are available at local authority level here (they require a bit of stitching together due to changes to the tests over the time period). Looks like Oldham improved its rank position among other local authorities in terms of the percentage of pupils with a good level of development, though still remains some way below average (with the caveat that the range of scores is very narrow).