This week marks the launch of the next generation of FFT’s data analytics system – Aspire.
Amongst a whole host of improvements and new features, one of the most significant updates is a brand-new Target Setting module incorporating FFT’s well known ‘estimates’ data.
After 20 years, we still get asked more questions about FFT estimates than anything else. So we thought it would be a good time to talk about where the estimates actually come from, and some of their uses and limitations.
What is an FFT estimate?
For the uninitiated, an FFT estimate is a grade assigned to each pupil. Schools use these grades to benchmark the performance of pupils who will take their exams in future. For example, if a group of 15 pupils have FFT estimates of 5 grade 6s and 10 grade 7s, 15 grade 7s would be seen as positive performance. 15 grade 6s, less so.
The single grade “FFT estimate” actually summarises a distribution of grades. A particular pupil is estimated to have an x% chance of achieving a grade 9, a y% chance of achieving a grade 8, and so on. The single grade estimate is the mid-point of that distribution.
How are estimates calculated?
In short, we look at the range of results achieved by similar pupils who took GCSEs in the same subjects in the past.
When we say “similar pupils” we mean pupils with the same prior attainment, gender and month of birth.
And when we say “range of results” we mean the percentage of grade 9s achieved, the percentage of grade 8s achieved, etc..[1]
The estimates currently in Aspire use 2019’s GCSE results. This is obviously not the most recent data available but, given that Ofqual’s stated ambition is to return to pre-pandemic standards this year, it is the most appropriate. We plan to update the estimates next Autumn when we receive Key Stage 4 data for 2023.
Historically, we produced Key Stage 4 estimates using only Key Stage 2 results as the measure of prior attainment. We use results in Key Stage 2 tests (reading, GPS, maths) and teacher assessment in writing.
But because Key Stage 2 tests were cancelled in 2020 and 2021 we include two further flavours of Key Stage 4 estimate based on CAT4 and Key Stage 1. Clearly, Key Stage 1 results are from a long time ago. However, they correlate with Key Stage 4 results more than you might think (although less well than Key Stage 2 results).
Whatever the measure of prior attainment, we always put it on a standardised scale before we use it in our model. This is how we can generate estimates for 2023’s GCSE cohort, whose Key Stage 2 results take the form of scaled scores, using data from 2019’s GCSE cohort, whose Key Stage 2 results took the form of national curriculum levels.
How can you estimate a pupil’s grade in creative subjects from their Key Stage 2 English and maths score?
The reason that we’re able to produce estimates in general is because GCSE performance is correlated with Key Stage 2 attainment. That means that, on average, pupils with higher Key Stage 2 results tend to get higher GCSE grades, and pupils with lower Key Stage 2 results tend to get lower GCSE grades.
This correlation exists for all GCSE subjects, including those where you might assume prior attainment isn’t relevant. It is, however, stronger in some subjects (for example, maths) than others (for example, art). We generally see correlations of around 0.8 for maths and 0.6 for art and drama.
The obvious explanation for this is that different subjects rely on different skills. But another contributing factor is that some subjects are harder to grade consistently than others (see link (pdf)) – this uncertainty reduces the correlation.
You’ll notice this phenomenon when you look at estimates for the same group of pupils across multiple subjects – subjects with a wider range of estimates have stronger correlation with prior attainment. If there were no correlation, all pupils would have the same estimates.
Limitations
The model that we use to create estimates is relatively simple. One of its strengths is that any two pupils with the same prior attainment, gender and date of birth will have the same estimate for a given subject. It isn’t influenced by their personal circumstances or expectations of them.
However, this is one of its limitations too, because we know that, on average, particular groups of pupils have lower outcomes than others. We show some examples in the chart below.
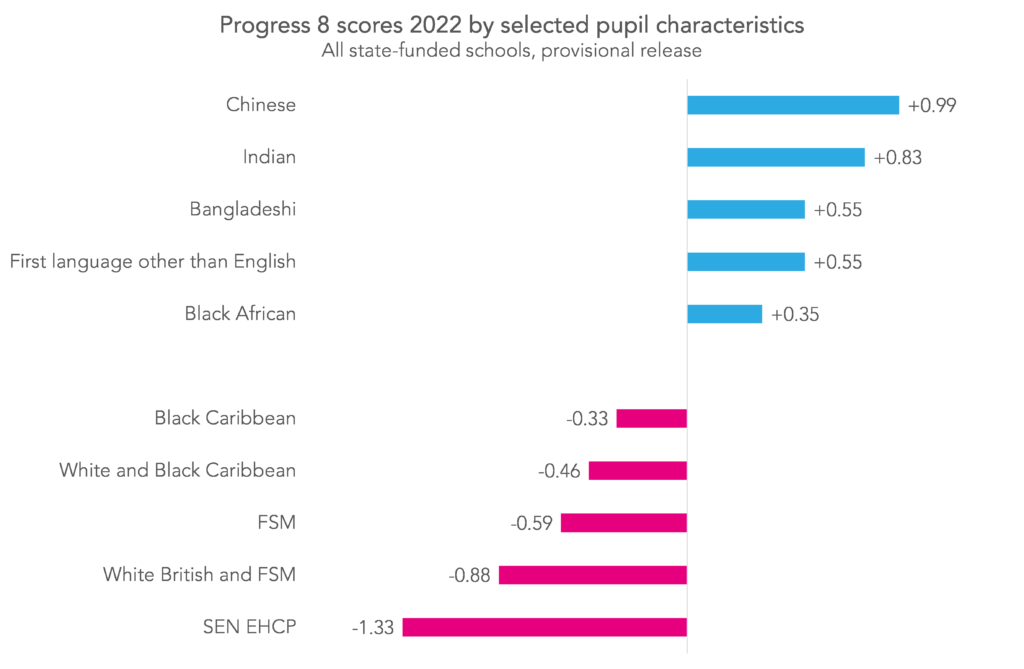
This means that certain groups of pupils are more likely to exceed their estimates, and others are more likely to fall short.
This is why, if you’re analysing the performance of a group of pupils, it’s just as important to look at context as it is estimates (Looking at school-level performance in context was the reason for Schools Like Yours).
This is also one of the reasons why FFT estimates should not be thought of as predictions.
Summing up
We know that school performance benchmarking can seem like a bit of a “black box”. And we hope this has taken away some of the mystery.
If you’re lucky enough to work in one of our Aspire schools, you can view estimates for your pupils in the first release of the next generation system now.


Leave A Comment