Bridget Phillipson made headlines recently when she said that White working-class children have been “betrayed” and “left behind”. An independent inquiry has been set up to look at the educational outcomes for this group.
This is far from the first time that concern has been raised about White working-class pupils. The Education Committee held an inquiry on the issue in 2014, and again in 2021, publishing the report The forgotten: how white working-class pupils have been let down, and how to change it.
Whether we’ll see much change after the latest inquiry remains to be seen. But what we can do is take a detailed look at the situation as it stands.
We’ll be looking at how outcomes vary by ethnicity, disadvantage, and also gender, focusing on attainment at Key Stage 4, persistent absence, suspensions and permanent exclusions.
Data
We will be using data from the absence, school census, KS4 pupil and exam tables from the National Pupil Database (NPD).
When looking at attainment, we’ll use data for pupils who completed KS4 in state-funded schools in 2024. Unfortunately, NPD data on absence, suspensions and permanent exclusions for 2024 wasn’t available to us at the time of writing, so we’ll use the most recent available, which is from 2023, and we’ll include all KS3 and KS4 pupils in state-funded schools.
We will exclude pupils for whom data on ethnicity, gender, disadvantage status and the outcomes of interest is unavailable in the NPD.
A note on defining the group
Before we start looking at the data, a note about defining the group. ‘White working-class’ is the term used in the upcoming inquiry and in much of the discussion on this topic, but ‘working-class’ isn’t the easiest term to define, and class certainly isn’t a variable included in the datasets that we’ll be using. Instead, we’ll be focusing on those pupils who have been eligible for free school meals in the last six years (FSM6) as a proxy.
It’s also worth noting that quite a bit of the discussion on this topic focuses specifically on White British pupils rather than all White pupils. Here, we’ll start with a look at outcomes for all White pupils before moving on to look at more detailed breakdowns by ethnic background.
Finally, concerns have been raised specifically about White disadvantaged boys. So we’ll be breaking figures down by gender here as well as by FSM6 and ethnic background.
An overview
Let’s start with a look at how outcomes for White FSM6 pupils compare to their peers who aren’t in the FSM6 group, and/or aren’t White. We’ve also broken these groups down by gender.
The charts below show the percentage achieving the basics and average Progress 8 scores by group.
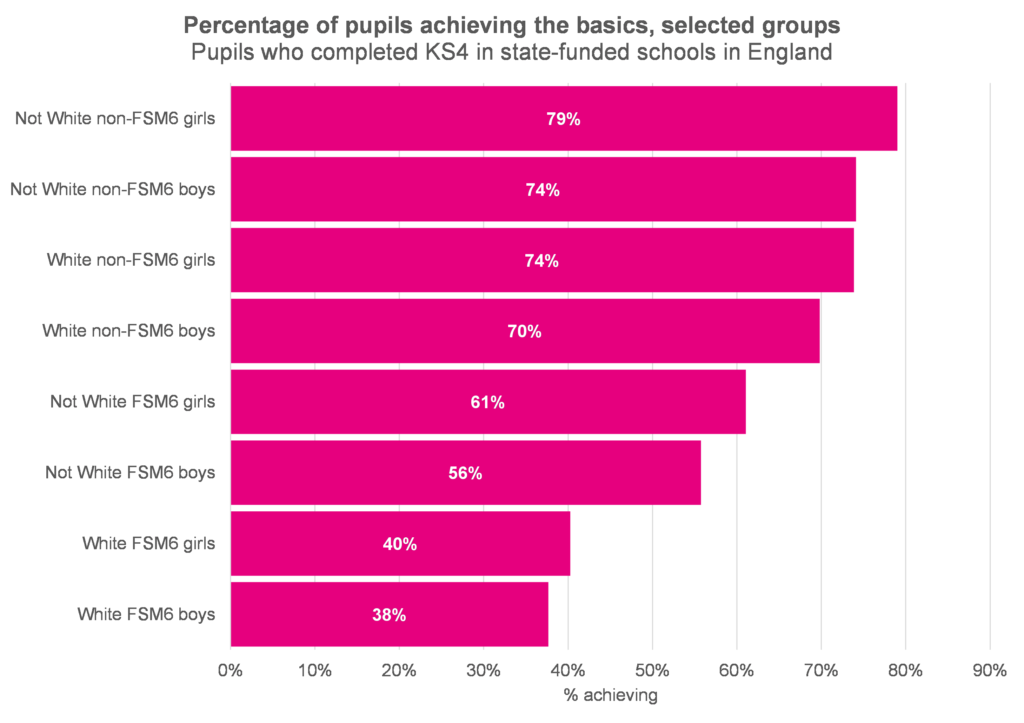
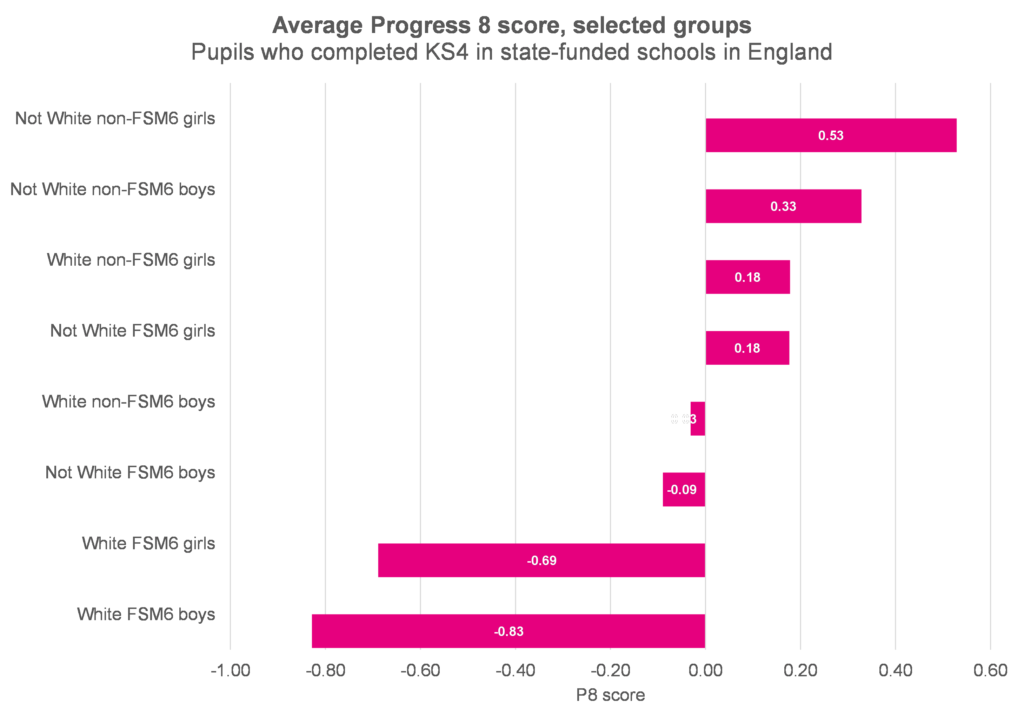
The attainment of white FSM6 pupils is considerably lower than that of their peers. Just 38% of boys and 40% of girls in this group achieved the basics at GCSE last year (that is, achieved grade 4 or higher in English and maths). This compares to 66% of all pupils.
There are also differences between groups when we look at persistent absence.
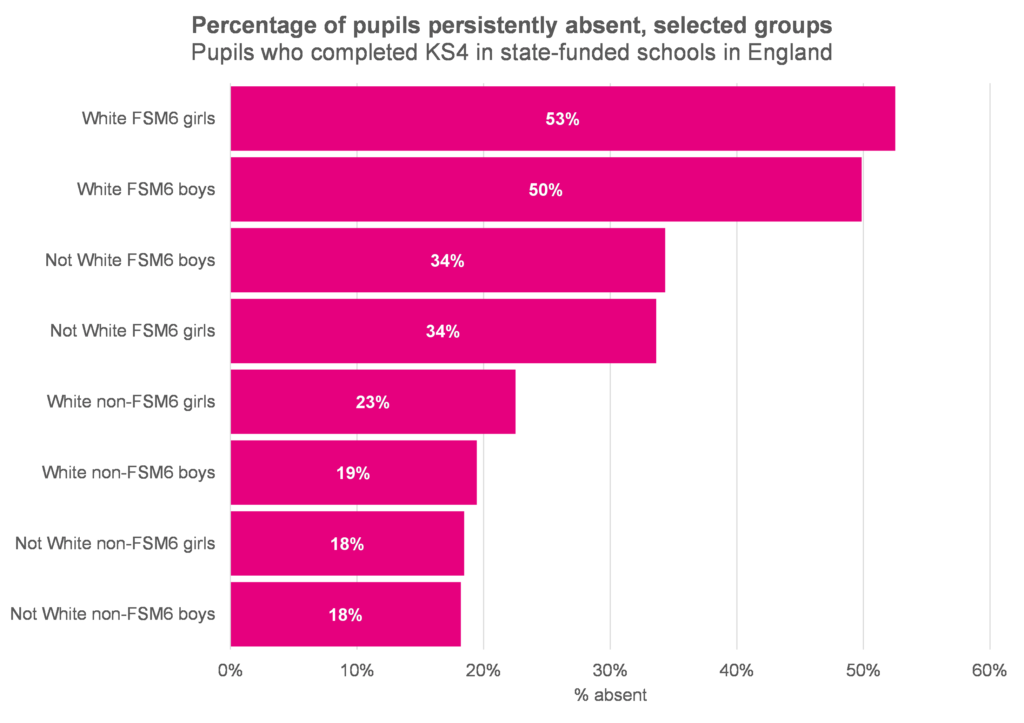
Persistent absence rates are considerably higher for white FSM6 pupils. More than half were persistently absent from school in 2023, compared to just 28% of all pupils.
And, again, we see some differences in average rates of suspensions and permanent exclusions.
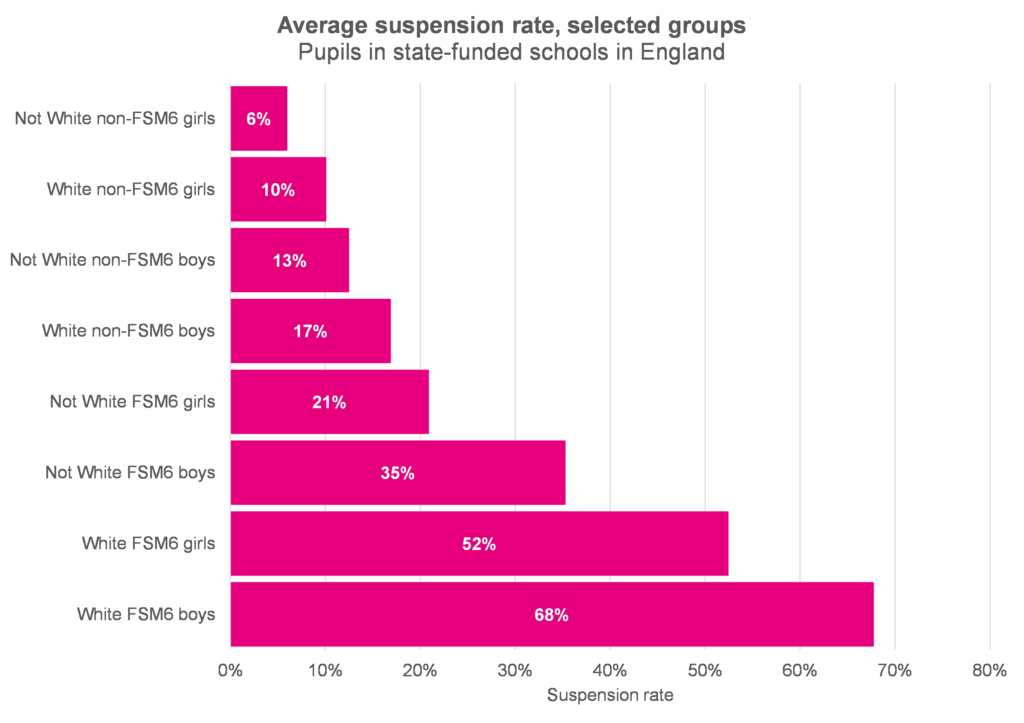
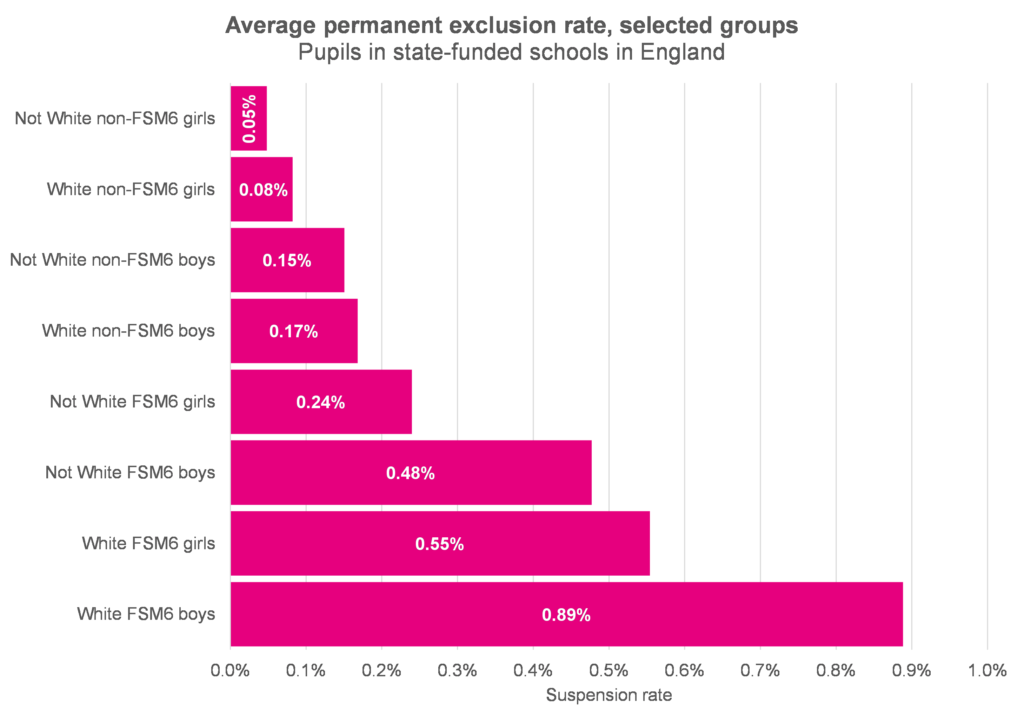
As the charts show, rates are relatively high for white FSM6 pupils, particularly boys. The suspension rate stood at 68% for white FSM6 boys in 2023 compared to 23% for all pupils. The figures for permanent exclusion were 0.89% and 0.25%.[1]
A more detailed breakdown
Now let’s break the data down further by ethnic group. We’ll be focusing on White British pupils as the group of interest from now on.
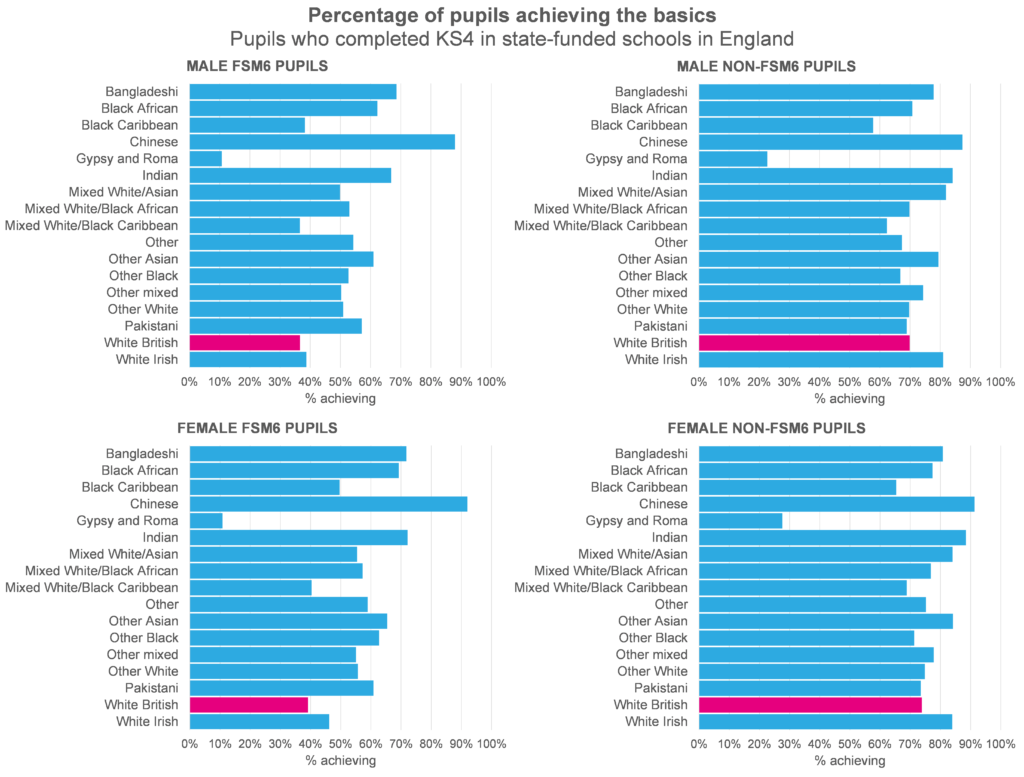
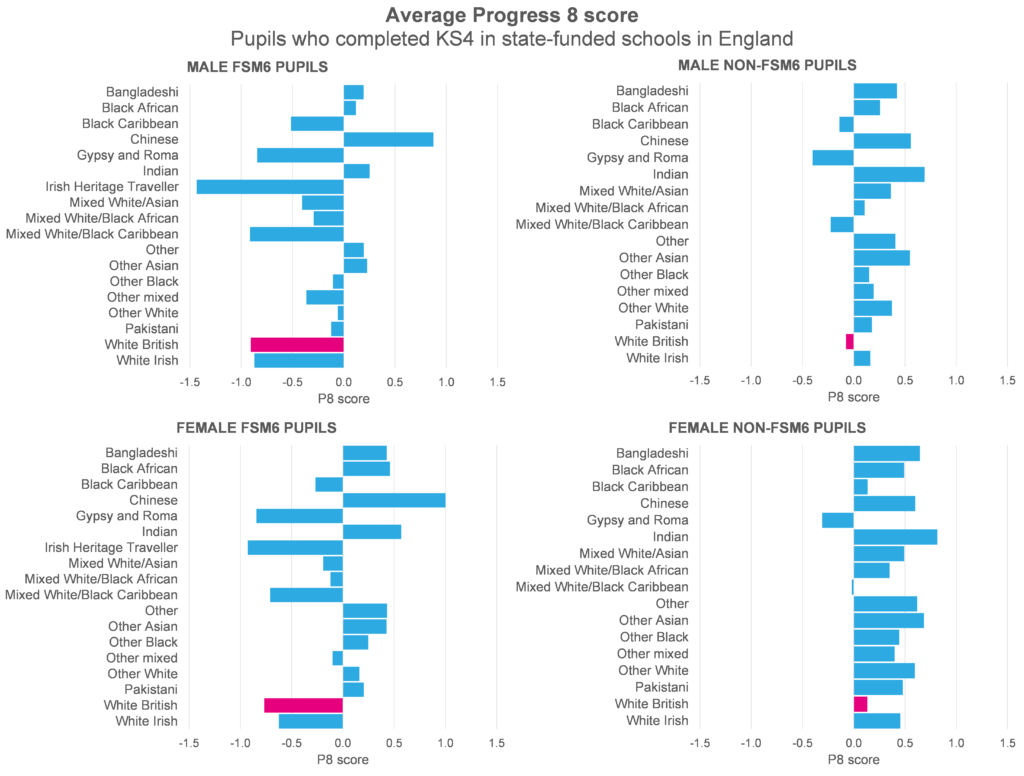
The charts below show the percentage of pupils achieving the basics at GCSE and average P8 scores for male, female, FSM6 and non-FSM6 pupils, broken down by ethnic group.
Sign up to our newsletter
If you enjoy our content, why not sign up now to get notified when we publish a new post, or to receive our half termly newsletter?
Here we can see that attainment for white British FSM6 pupils is among the lowest for any ethnic background, for both male and female pupils. But attainment for non-FSM6 White British pupils is not quite so low relative to those from other ethnic backgrounds.
It looks as though being in the FSM6 group may have a greater impact on attainment for those from a White British background than for those from some other backgrounds, something that we first wrote about in this classic post from 2017.
We should note that a number of other groups also have worryingly low relative attainment, including those from Gypsy and Roma, Irish Heritage Traveller, White Irish, Mixed White / Black Caribbean and Black Caribbean backgrounds.
There’s a similar pattern when we look at persistent absence.
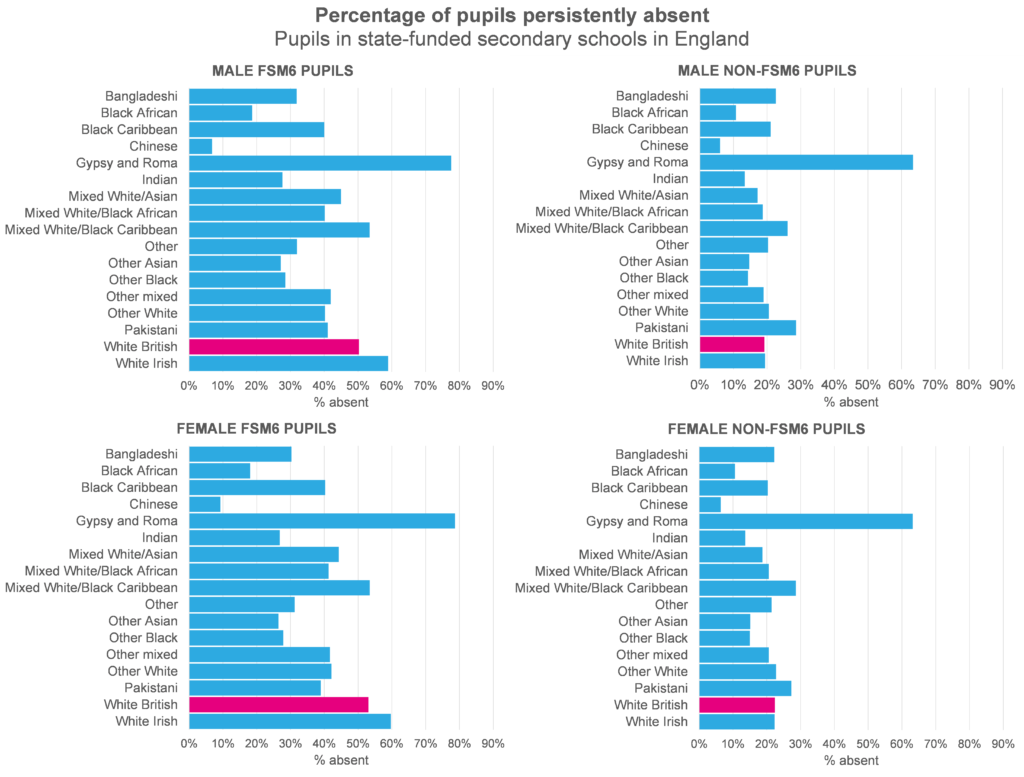
As with attainment, it’s important to note that some groups had even higher rates of persistent absence than the White British group, including those from Gypsy and Roma and White Irish backgrounds, and, among female pupils, those from a Pakistani background.
Unlike attainment outcomes, we see a relatively large difference between male and female pupils in the White British group here. Among White FSM6 pupils, 50.3% of male and 53.0% of female pupils were persistently absent in 2023, a difference of 2.7 percentage points. This is the highest gender difference of any ethnic group. White British non-FSM6 pupils also had a large gender difference in persistent absence rate.
Next, let’s look at rates of suspensions and permanent exclusions. Unfortunately, due to small numbers, we are not able to display data on permanent exclusion for the majority of ethnic backgrounds.[2]
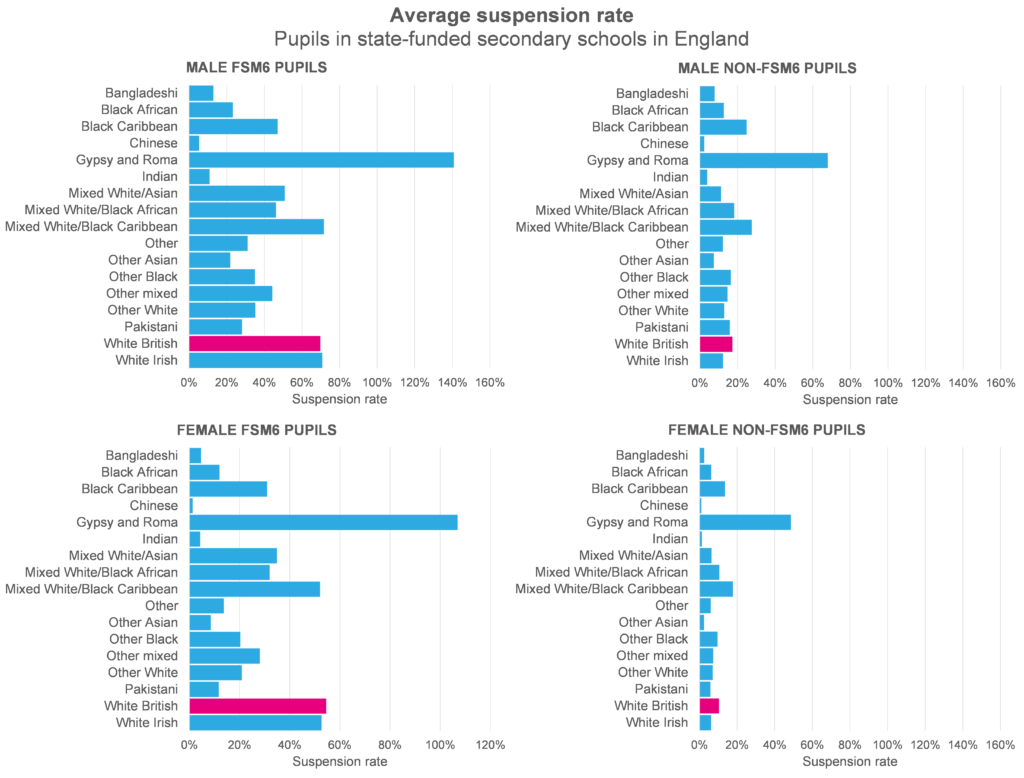
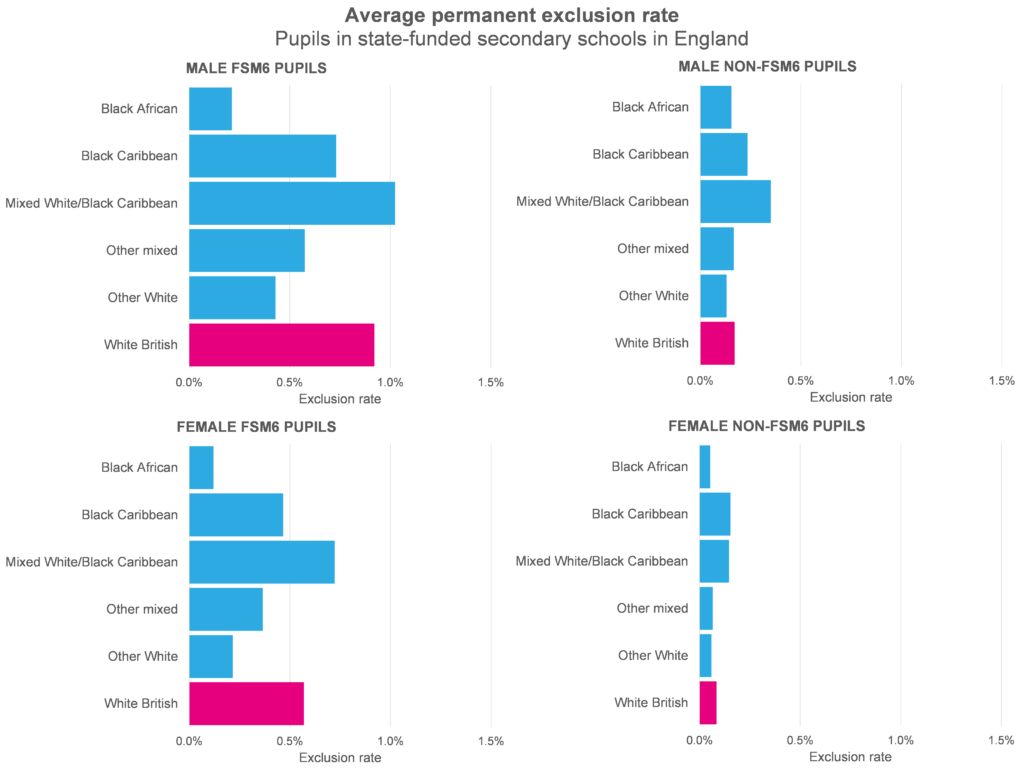
Once again, suspension and exclusion rates are relatively high among White British FSM6 pupils, but not particularly high among White British non-FSM6 pupils. And, again, we see worryingly high rates among those from other ethnic backgrounds.
We see some big differences in suspension and exclusion rates by gender, but these differences are not relatively larger or small among White British FSM6 pupils compared to other groups.
Some context
Let’s take a look at the pupils who make up the White British FSM6 group. It’s a large group: around 1 in 7 (14%) of those completing KS4 last year were part of it. It also includes a high proportion of pupils with an identified SEN: 51% of those completed KS4 last year had been identified as having SEN at some point in their school career, compared to just 31% of all pupils nationally.
The table below provides more context and shows how these pupils were distributed between regions.
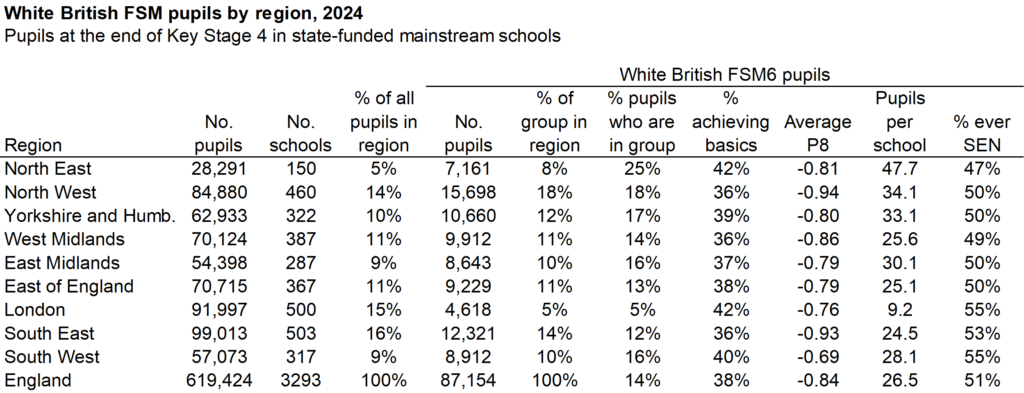
In the North East, 1 in 4 pupils were in the White British FSM6 group, compared to 1 in 20 in London. But despite the variation between regions, every region still includes a substantial proportion of the White British FSM6 population.
It’s worth noting that, while there’s variation in this group’s attainment between regions, it’s still well below average in every region. In fact, the percentage of pupils in this group achieving the basics is the same in London as in the North East.
So it wouldn’t seem logical for any measures targeting this group to be targeted at any particular region: every region includes pupils from the group, and their attainment tends to be low wherever they are.
And targeting low-performing schools may not be the answer either. The chart below shows the percentage of White British FSM6 pupils achieving the basics by their school’s average Progress 8 score.
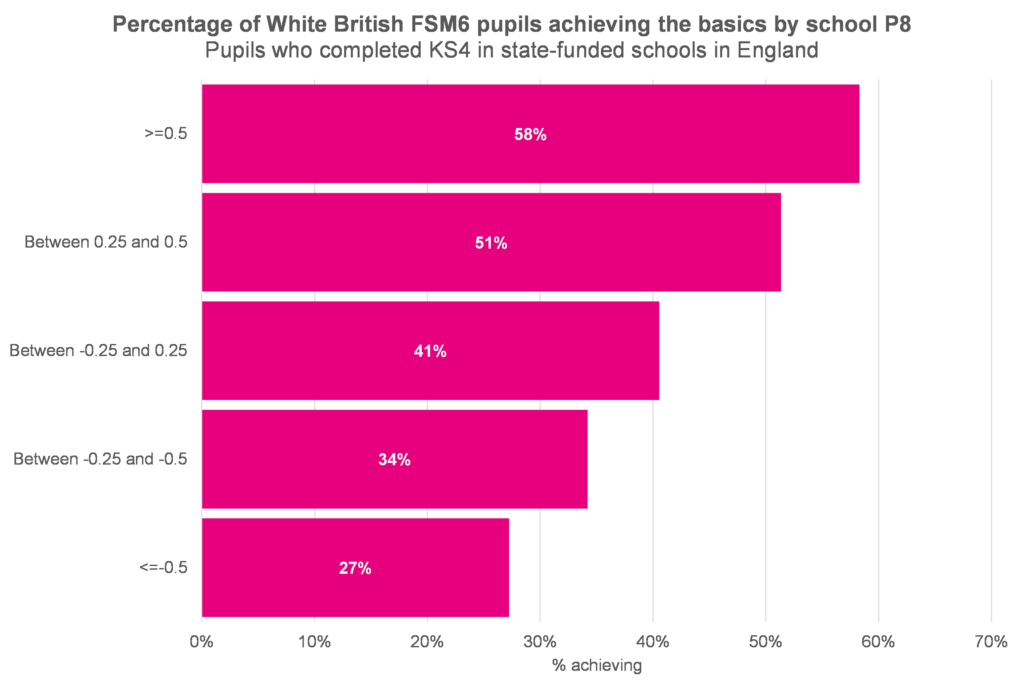
Even in schools with mid and high Progress 8 scores, the percentage of White British FSM6 pupils is well below the national average of 66%. It is, admittedly, even worse in schools with lower Progress 8 scores, but there are clearly issues for this group even in schools without serious performance issues elsewhere.
Summing up
We’re not ones to throw words like ‘betrayal’ around, but there’s no denying that outcomes for White British FSM6 pupils are relatively poor. Not just in terms of attainment, but also in terms of absence and exclusions from school.
Having said that, we mustn’t forget that other groups have similarly poor, or, in some cases, far worse outcomes. These include disadvantaged pupils from White Irish, Black Caribbean and Mixed White and Black Caribbean backgrounds, and those from Gypsy and Roma and Irish Heritage Traveller backgrounds.
These groups do not include as many pupils, but of course that doesn’t make them less important. The number of pupils from Gypsy and Roma and Irish Heritage Traveller backgrounds is particularly small and, because of this, figures on these groups are often not reported because they’re so low that they would fall foul of the rules on data security.
We should also remember that White British FSM6 pupils are spread around the country, and that their issues are not confined to low-performing schools: their outcomes tend to be lower wherever they go to school. Targeting particular areas or particular schools in an effort to help this group may not be answer.
Perhaps the real answer is a familiar one: to work to improve outcomes for any pupils who may be struggling, whatever their background and wherever they go to school.
Want to stay up-to-date with the latest research from FFT Education Datalab? Sign up to Datalab’s mailing list to get notifications about new blogposts, or to receive the team’s half-termly newsletter.

[1]: The suspension rate is the total number of suspensions divided by the total number of pupils. Similarly, the permanent exclusion rate is the total number of permanent exclusions divided by the total number of pupils.
[2]: Note that the suspension rate is not the percentage of pupils who receive at least one suspension. Rather, it is the total number of suspensions divided by the total number of pupils. Therefore it is possible for the rate to be above 100%, as it is for some groups shown in the charts.

Leave A Comment