Around 5% of pupils reach the end of Key Stage 4 without achieving a pass at grade 1 or higher in GCSE English language. The figure for GCSE mathematics is very similar.
In this blogpost we look at the characteristics of this group.
Data
We use end of Key Stage 4 data from 2017 to 2024 from all state schools (mainstream and special) in England.
For each pupil we identify their highest grades in GCSE English language and GCSE mathematics.
We also calculate a measure, which we refer to as the Level 1 Basics measure, which identifies whether a pupil has achieved grade 1 or higher in both English language and mathematics.
Trends in English and maths passes
We first show the percentage of pupils who do not achieve passes in English and maths since GCSEs graded 9-1 were first awarded in 2017.
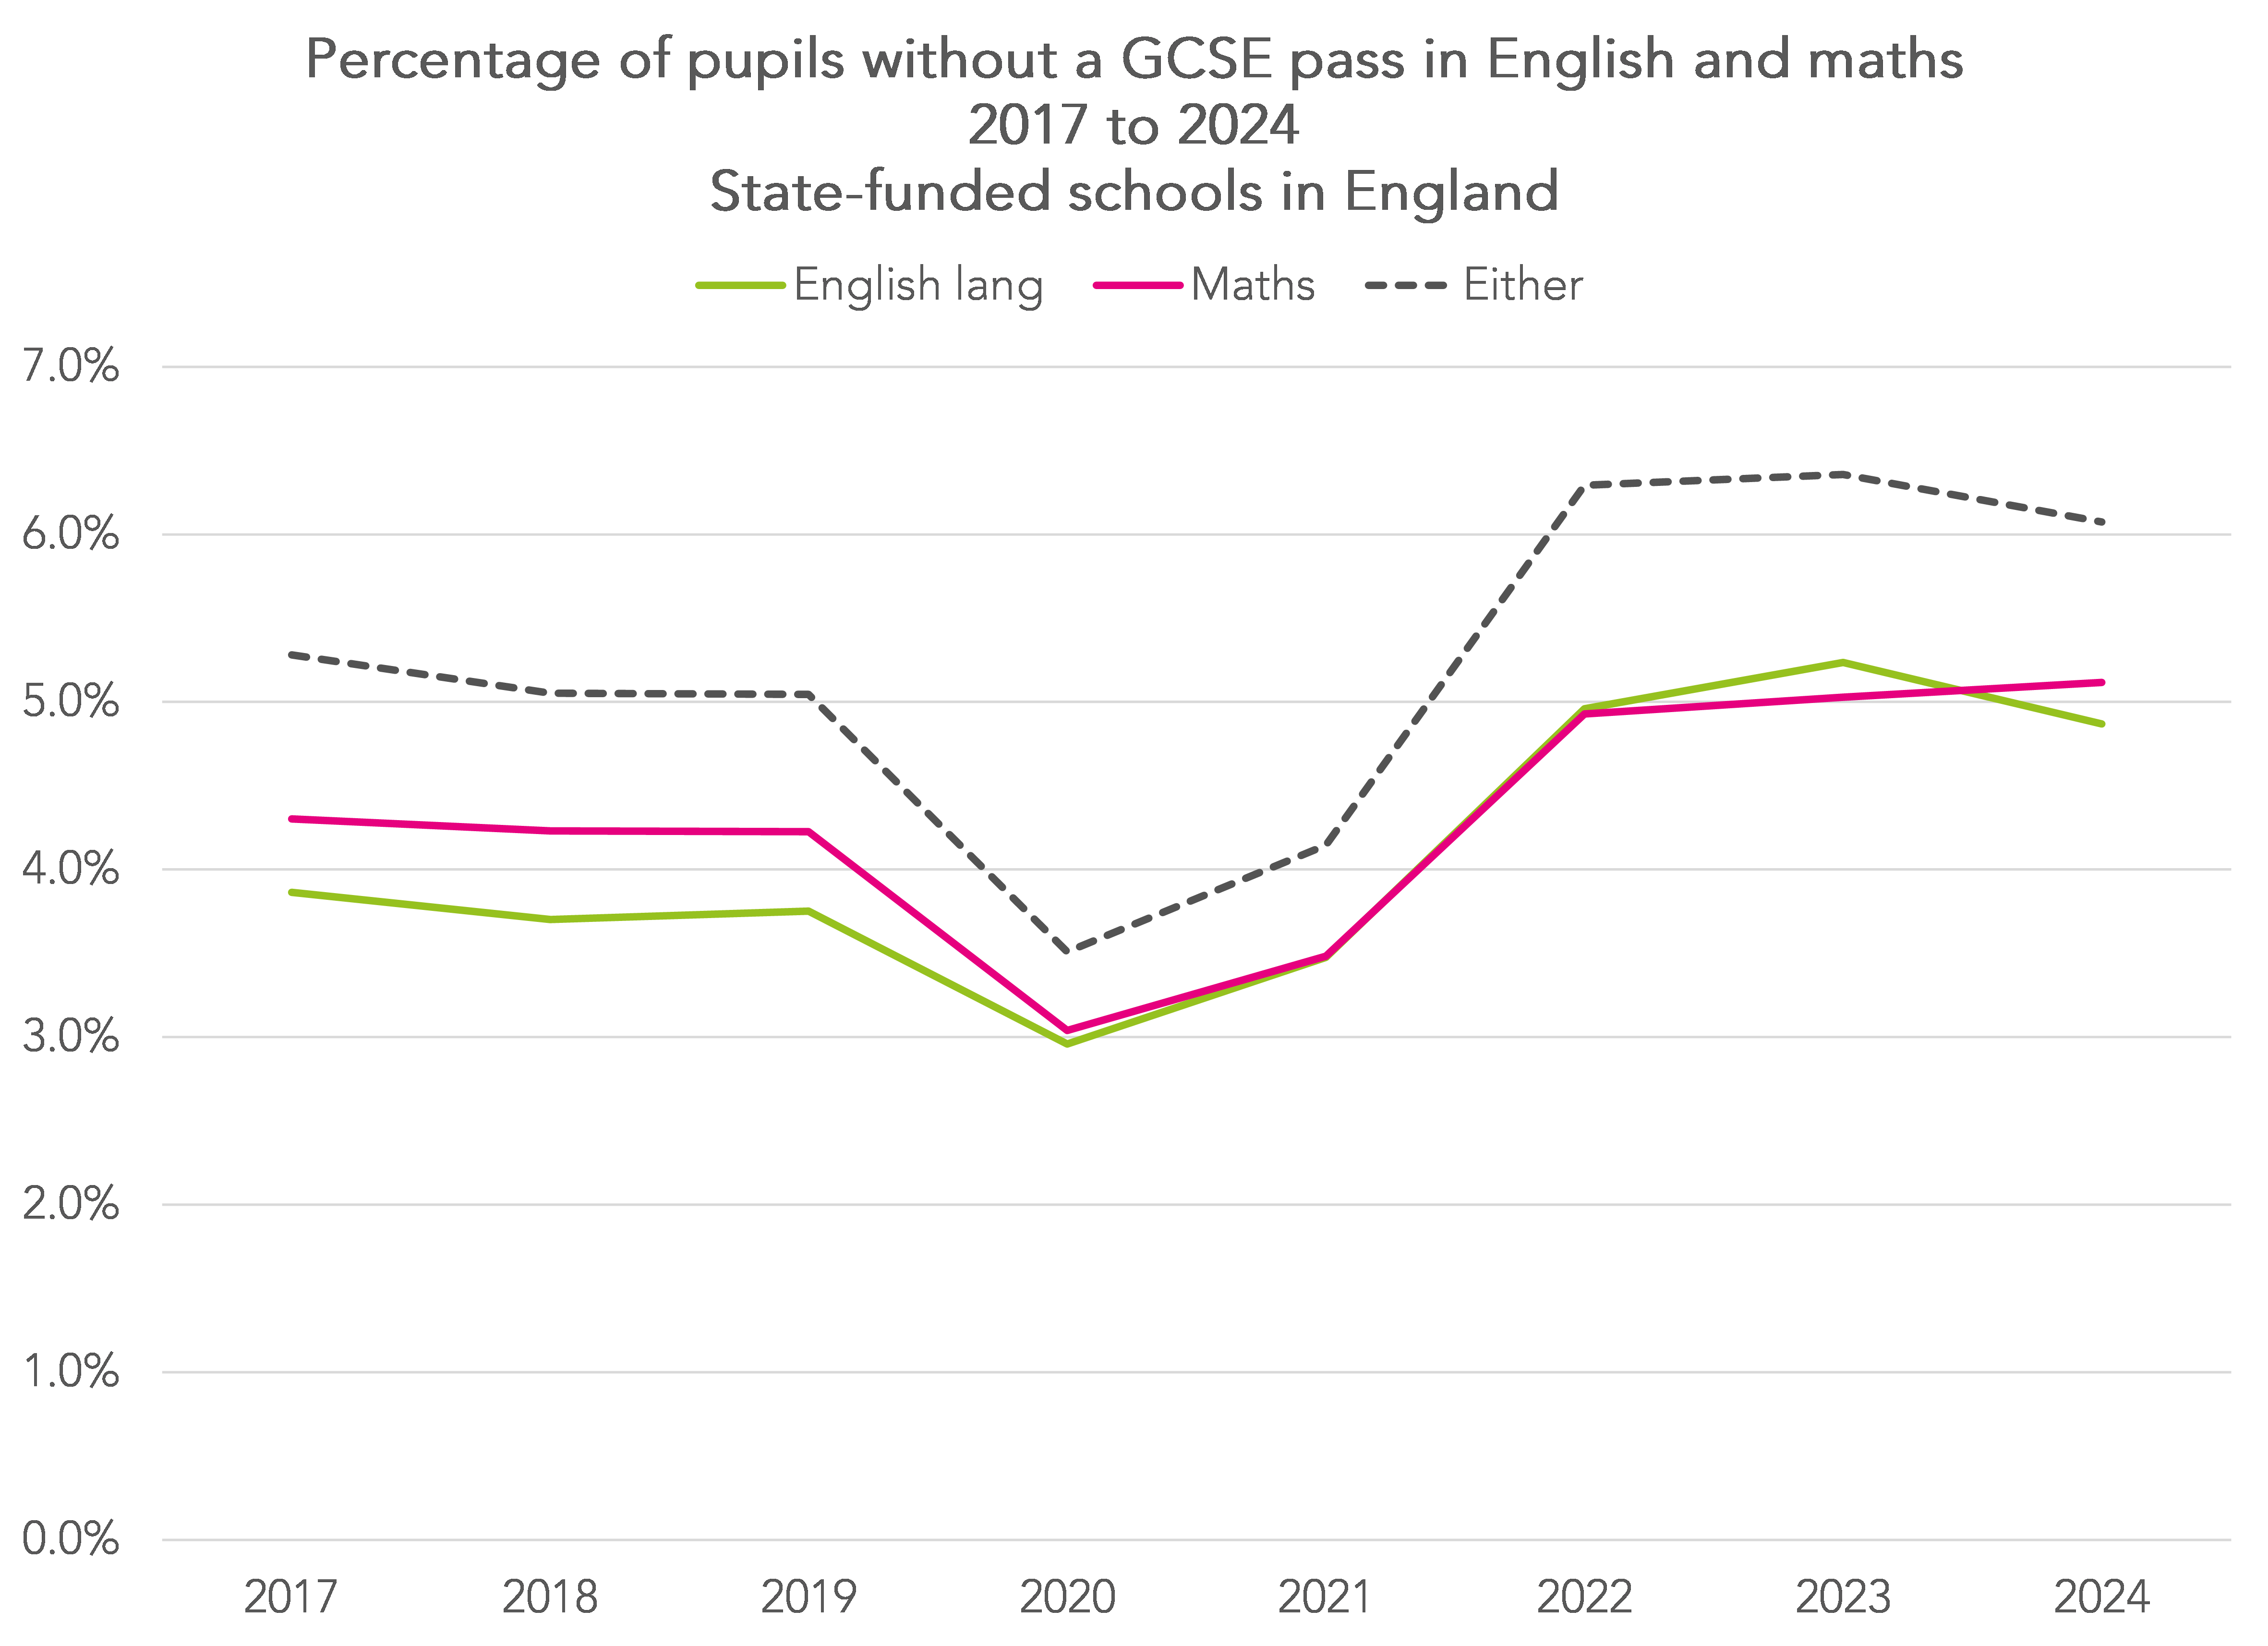
Around 4% of pupils did not achieve passes in English or maths between 2017 and 2019. This fell to 3% when exams were cancelled in 2020.
Since 2022, around 5% of pupils have not achieved this threshold.
In 2024, just over 30,000 pupils did not achieve Grade 1 or higher in English language. This breaks down into
- 23,500 pupils who were not entered
- Just under 7,000 pupils who were entered but did not receive a grade
In maths, 32,000 pupils did not achieve Grade 1 or higher. This breaks down into:
- 22,000 pupils who were not entered
- 10,000 pupils who were entered by did not receive a grade
Just over 6% of pupils leave school without passes in both English and maths. The chart below shows the split between pupils at mainstream schools and special schools.
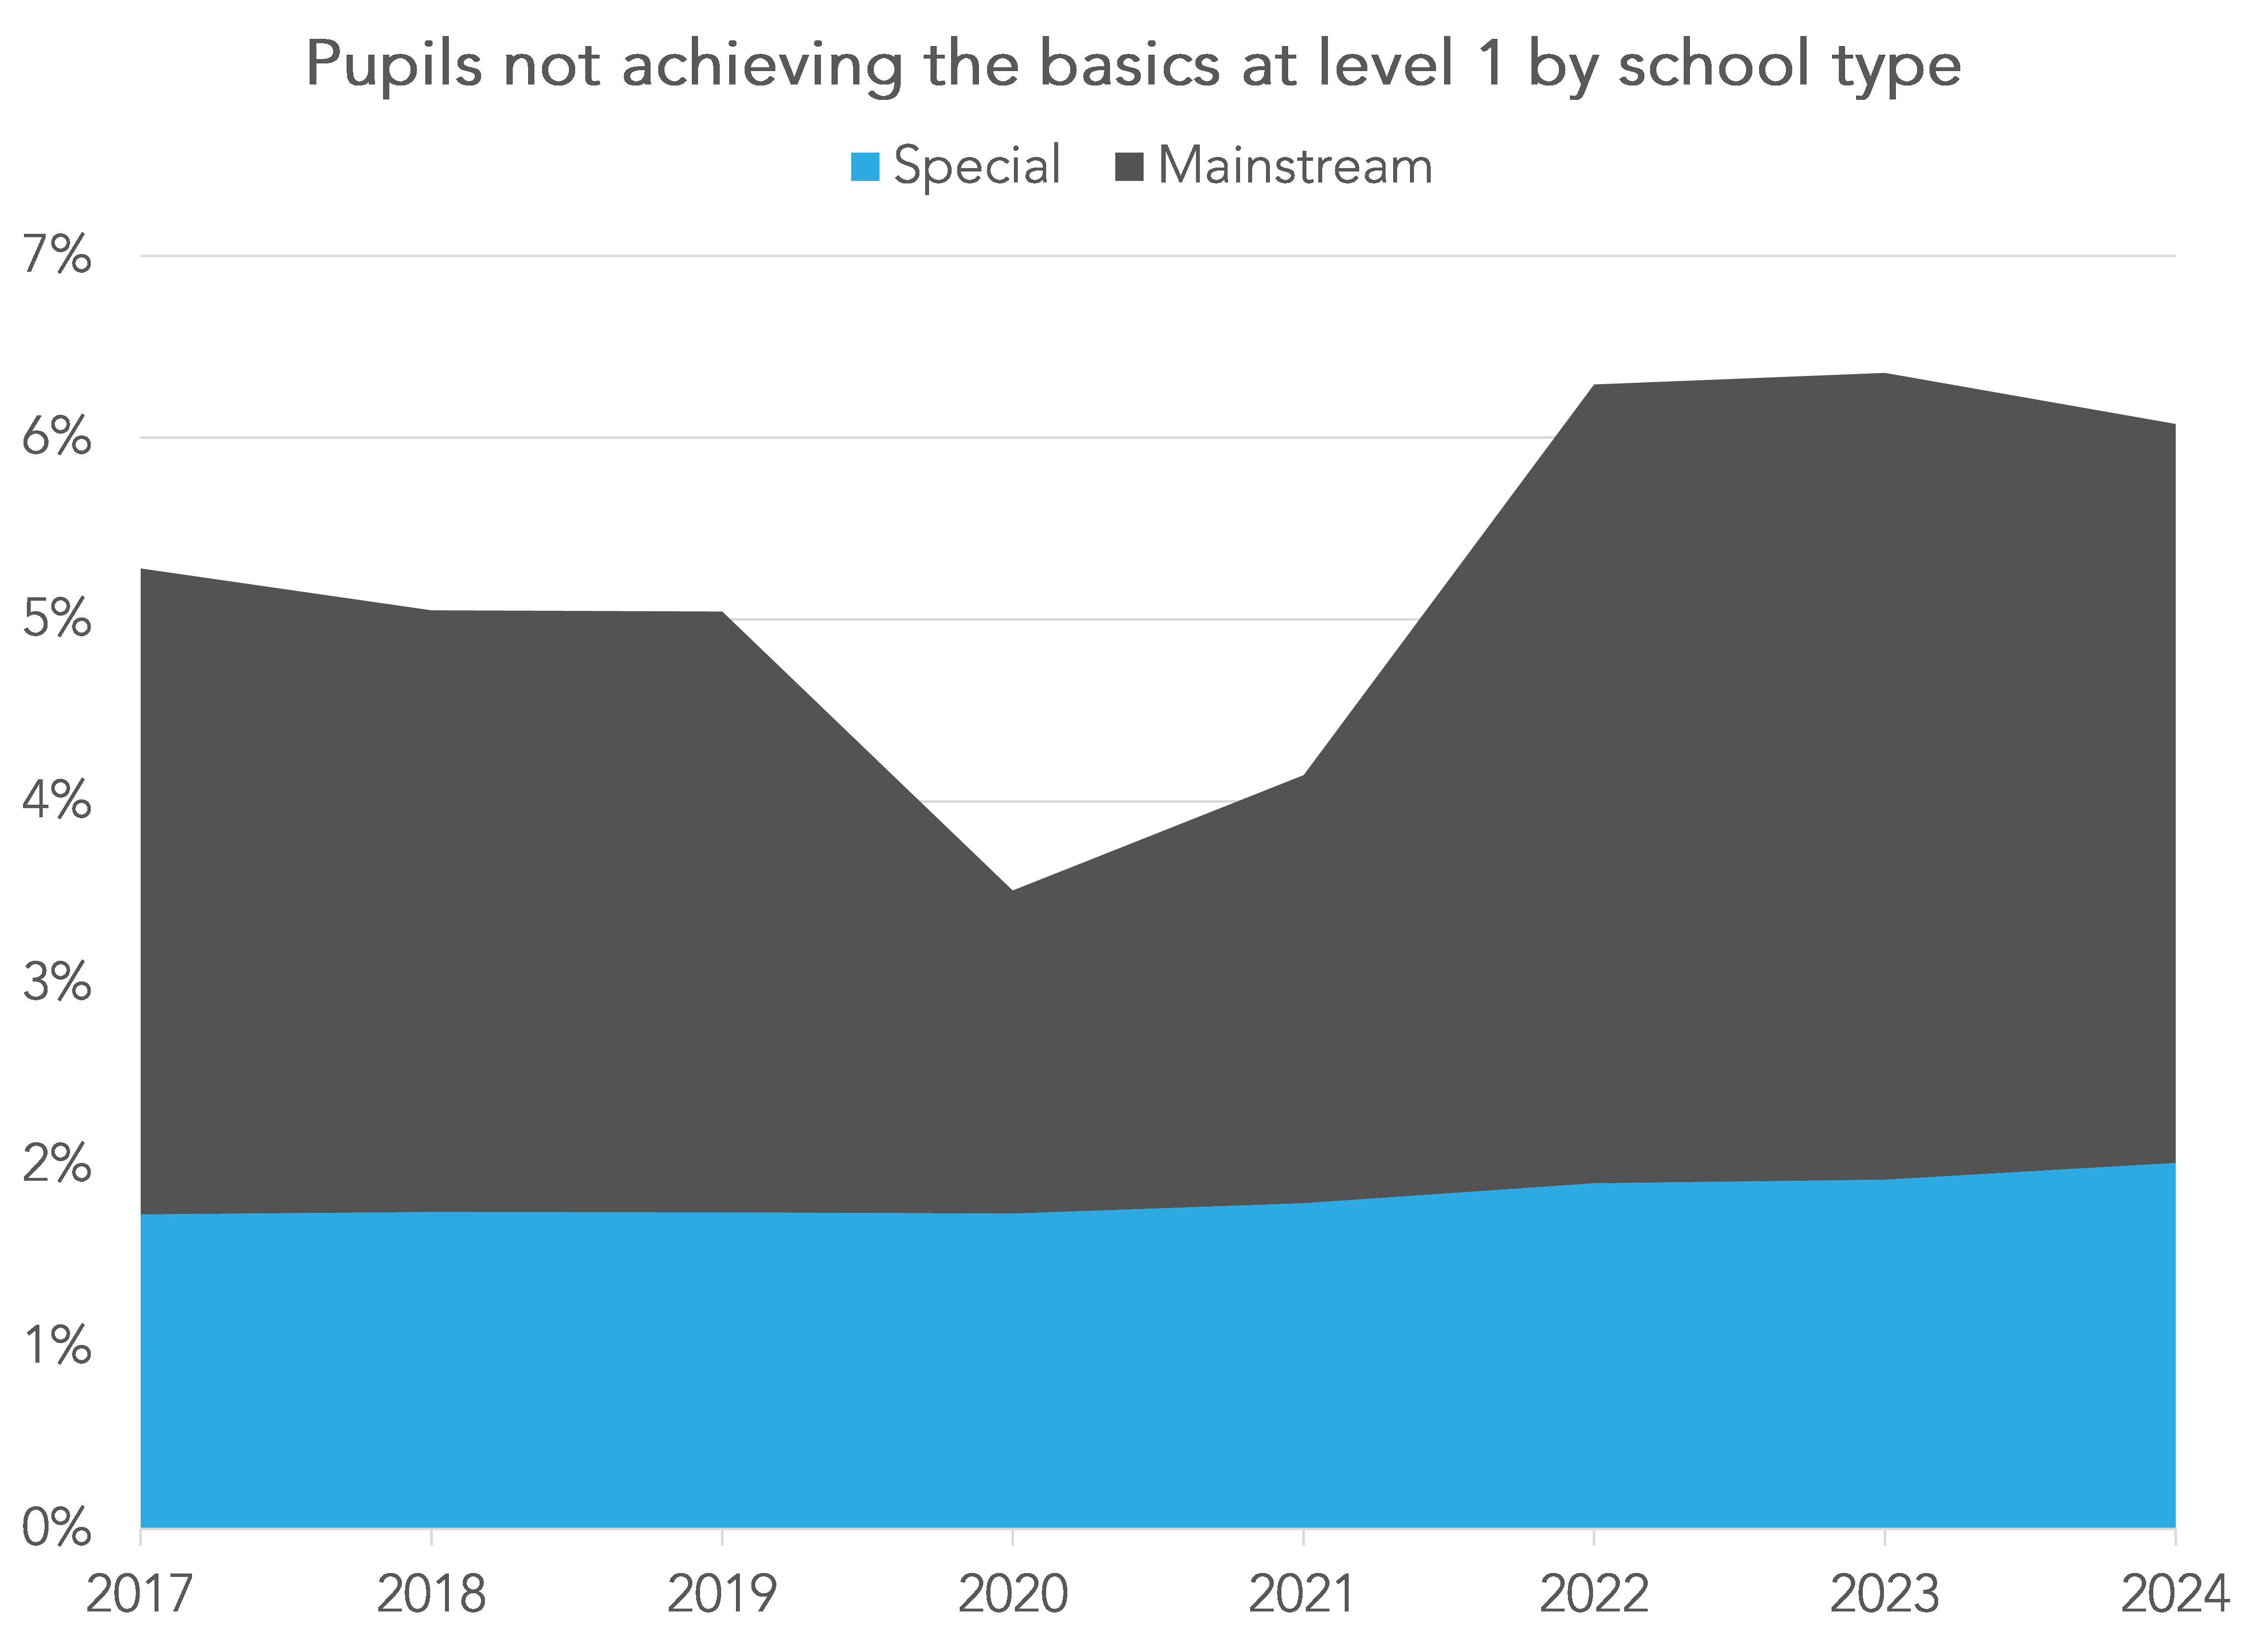
This shows that, since 2021, most of the growth in pupils not achieving the level 1 basics has been in mainstream schools.
The characteristics of pupils who don’t achieve the level 1 basics
In the chart below we show the percentage of pupils who don’t achieve the level 1 basics split by gender and disadvantage[1].
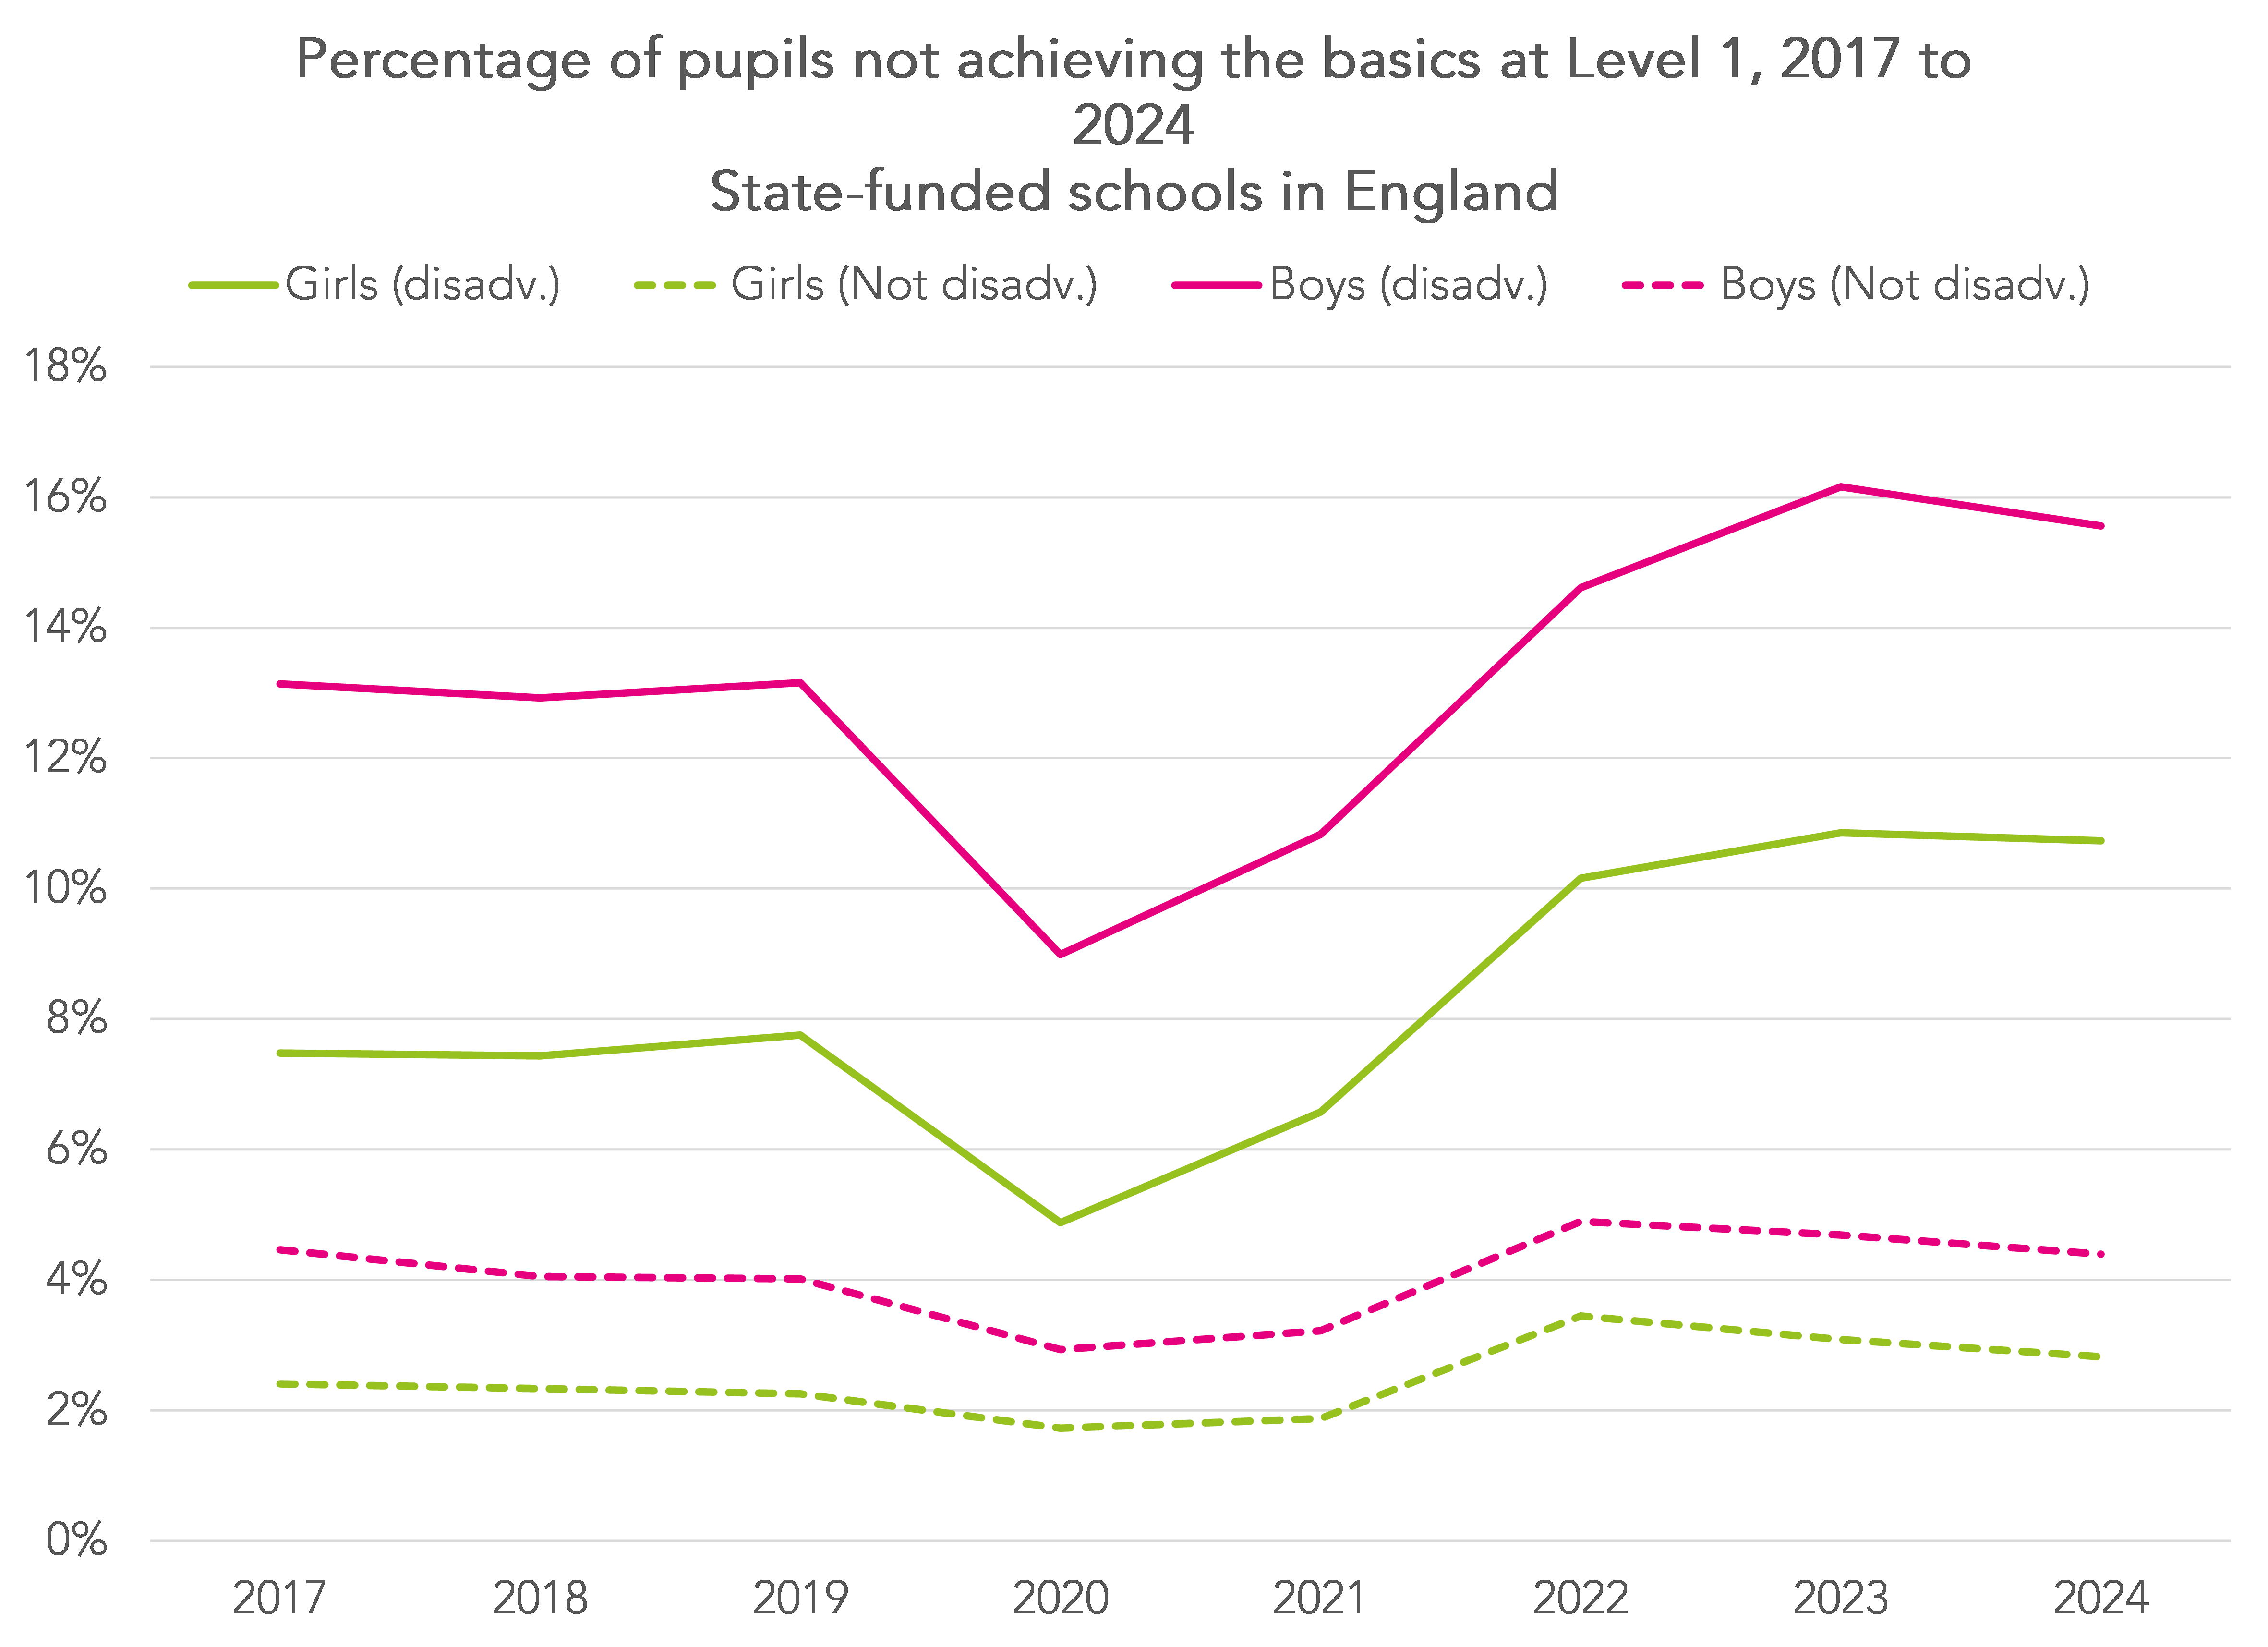
Just under 16% of disadvantaged boys and 11% of disadvantaged girls did not achieve the level 1 basics in 2024.
Next, we show absence data for the four groups of pupils for 2024. We show the proportion of pupils who were persistently absent (absent for 10% or more of sessions) in Year 11, and the subset who were severely absent (absent for 50% or more of sessions).
Firstly, the group who did not achieve the level 1 basics.
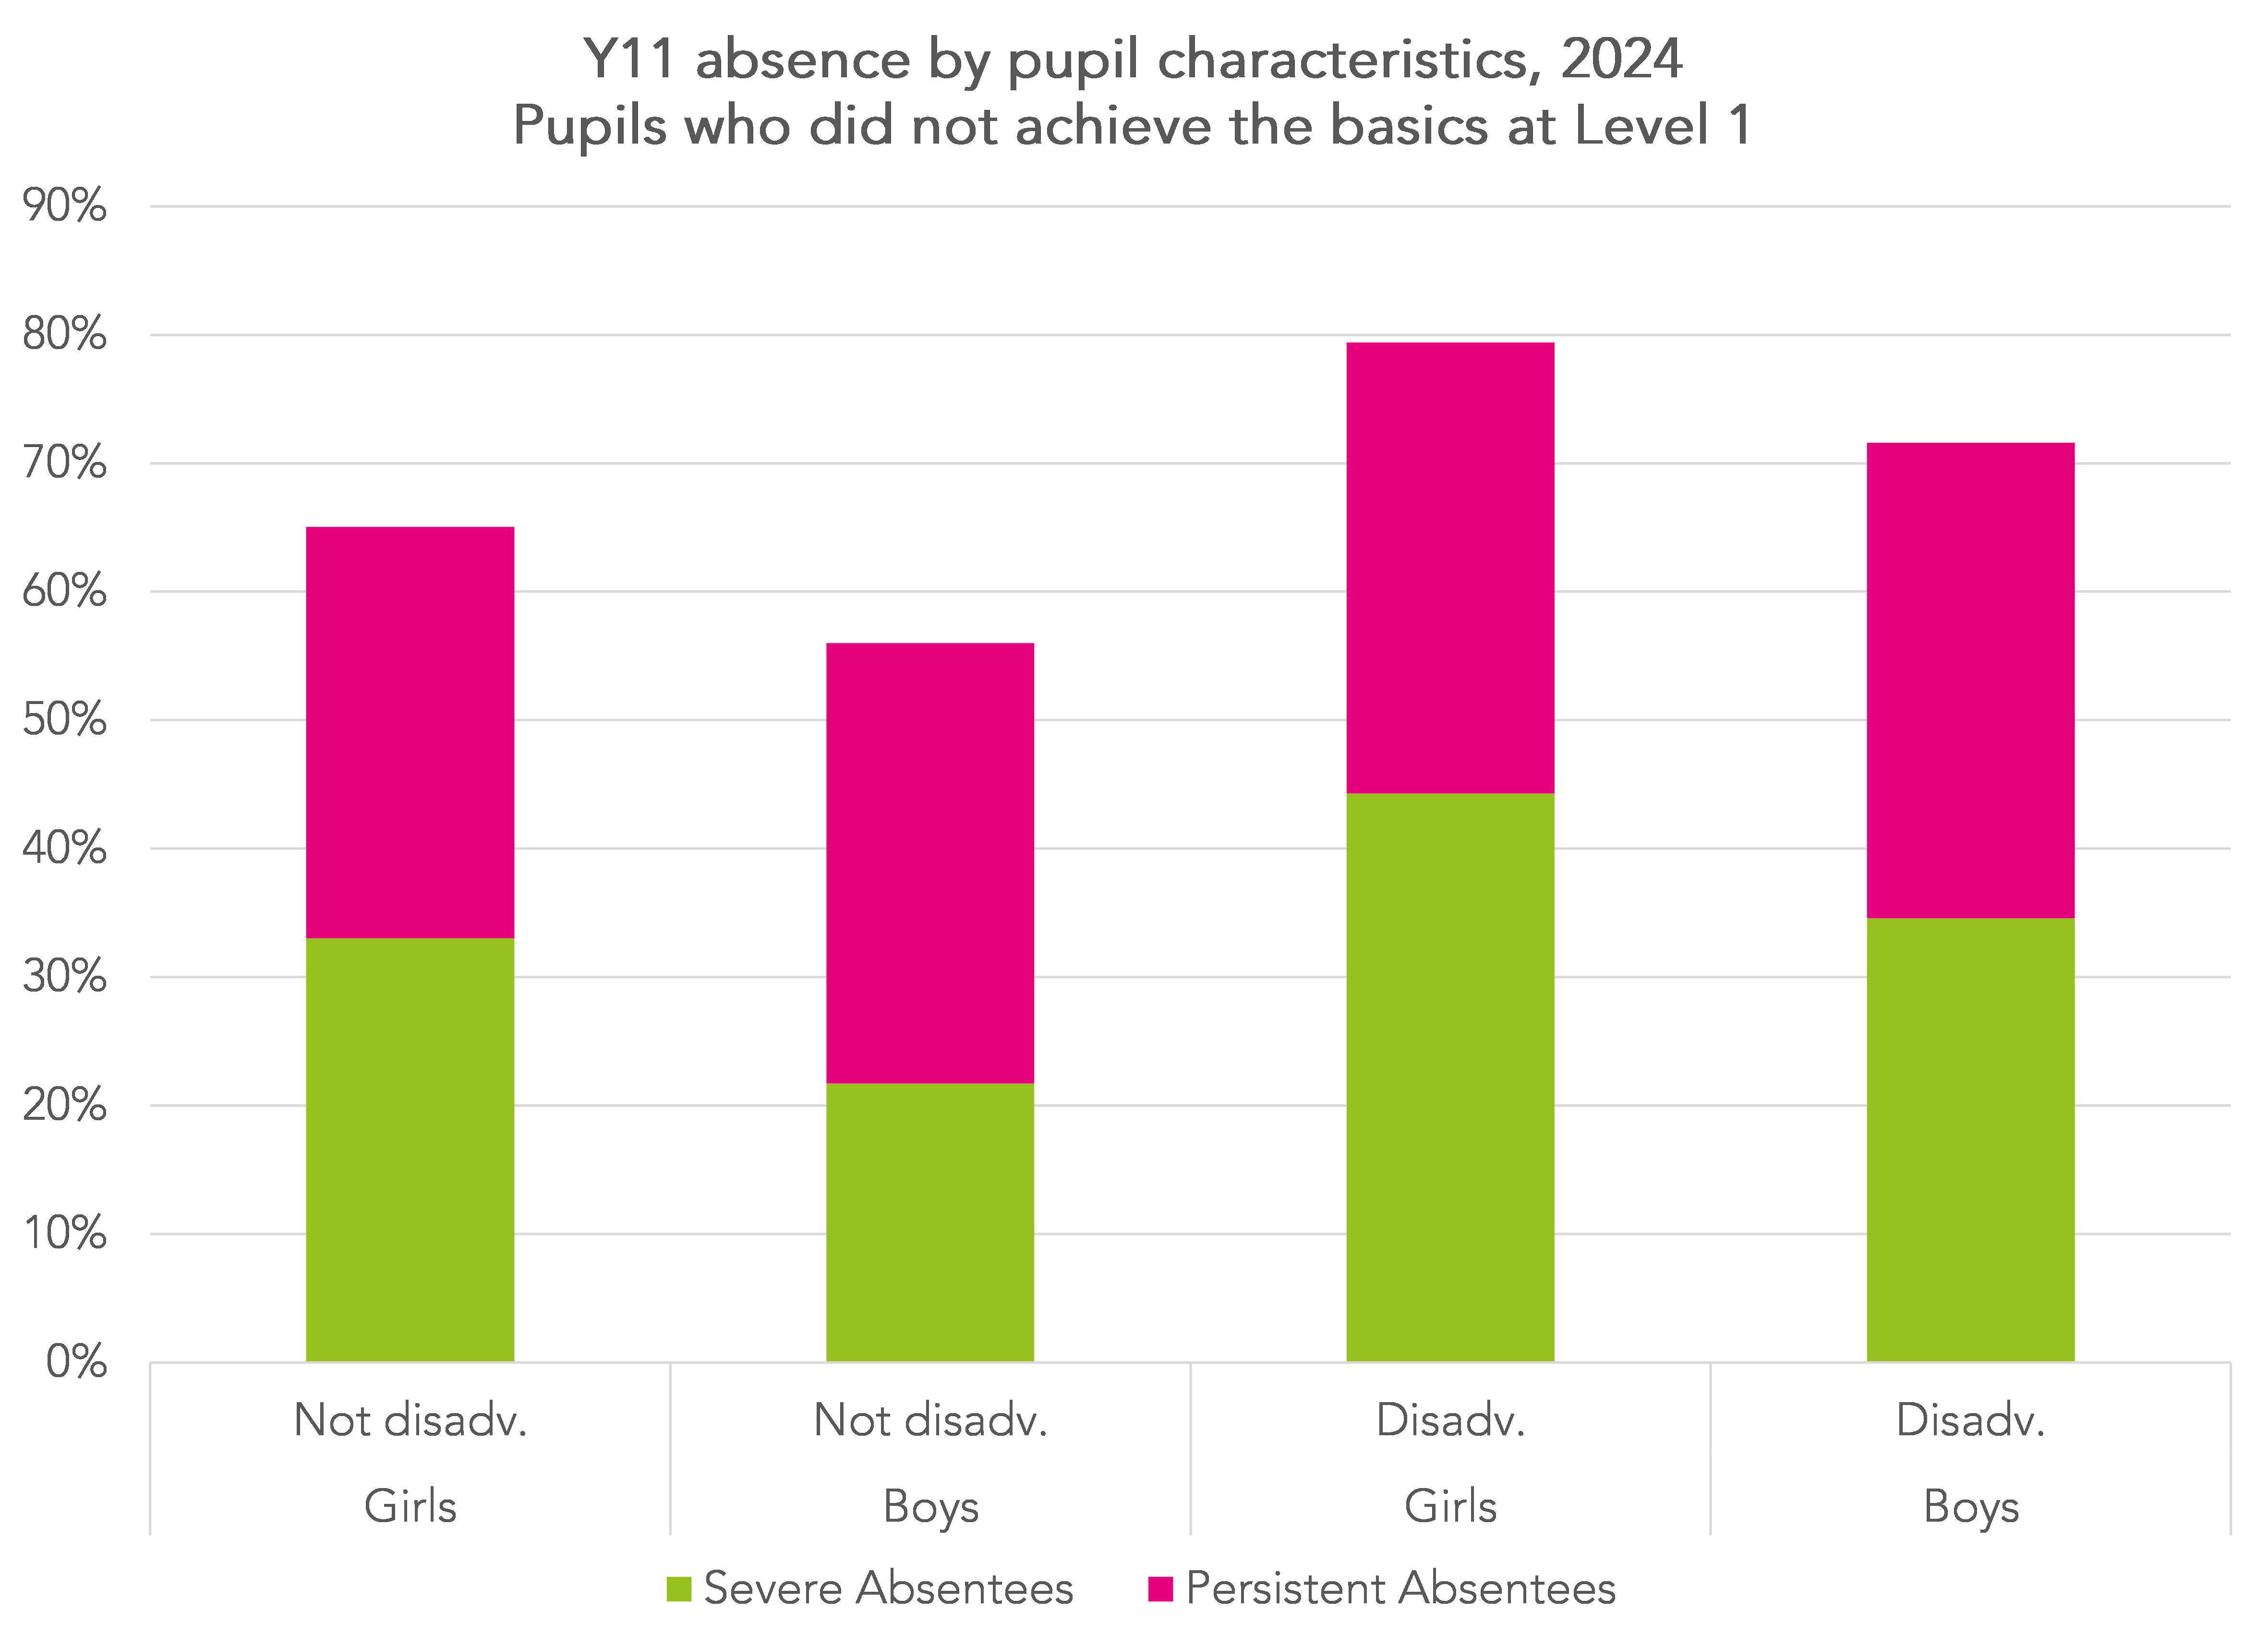
Almost 80% of disadvantaged girls who did not achieve the level 1 basics were persistently absent in Year 10, and 44% were severely absent. Figures for disadvantaged boys were slightly lower at 72% and 35% respectively.
We can compare these figures to those for pupils who did achieve the level 1 basics.
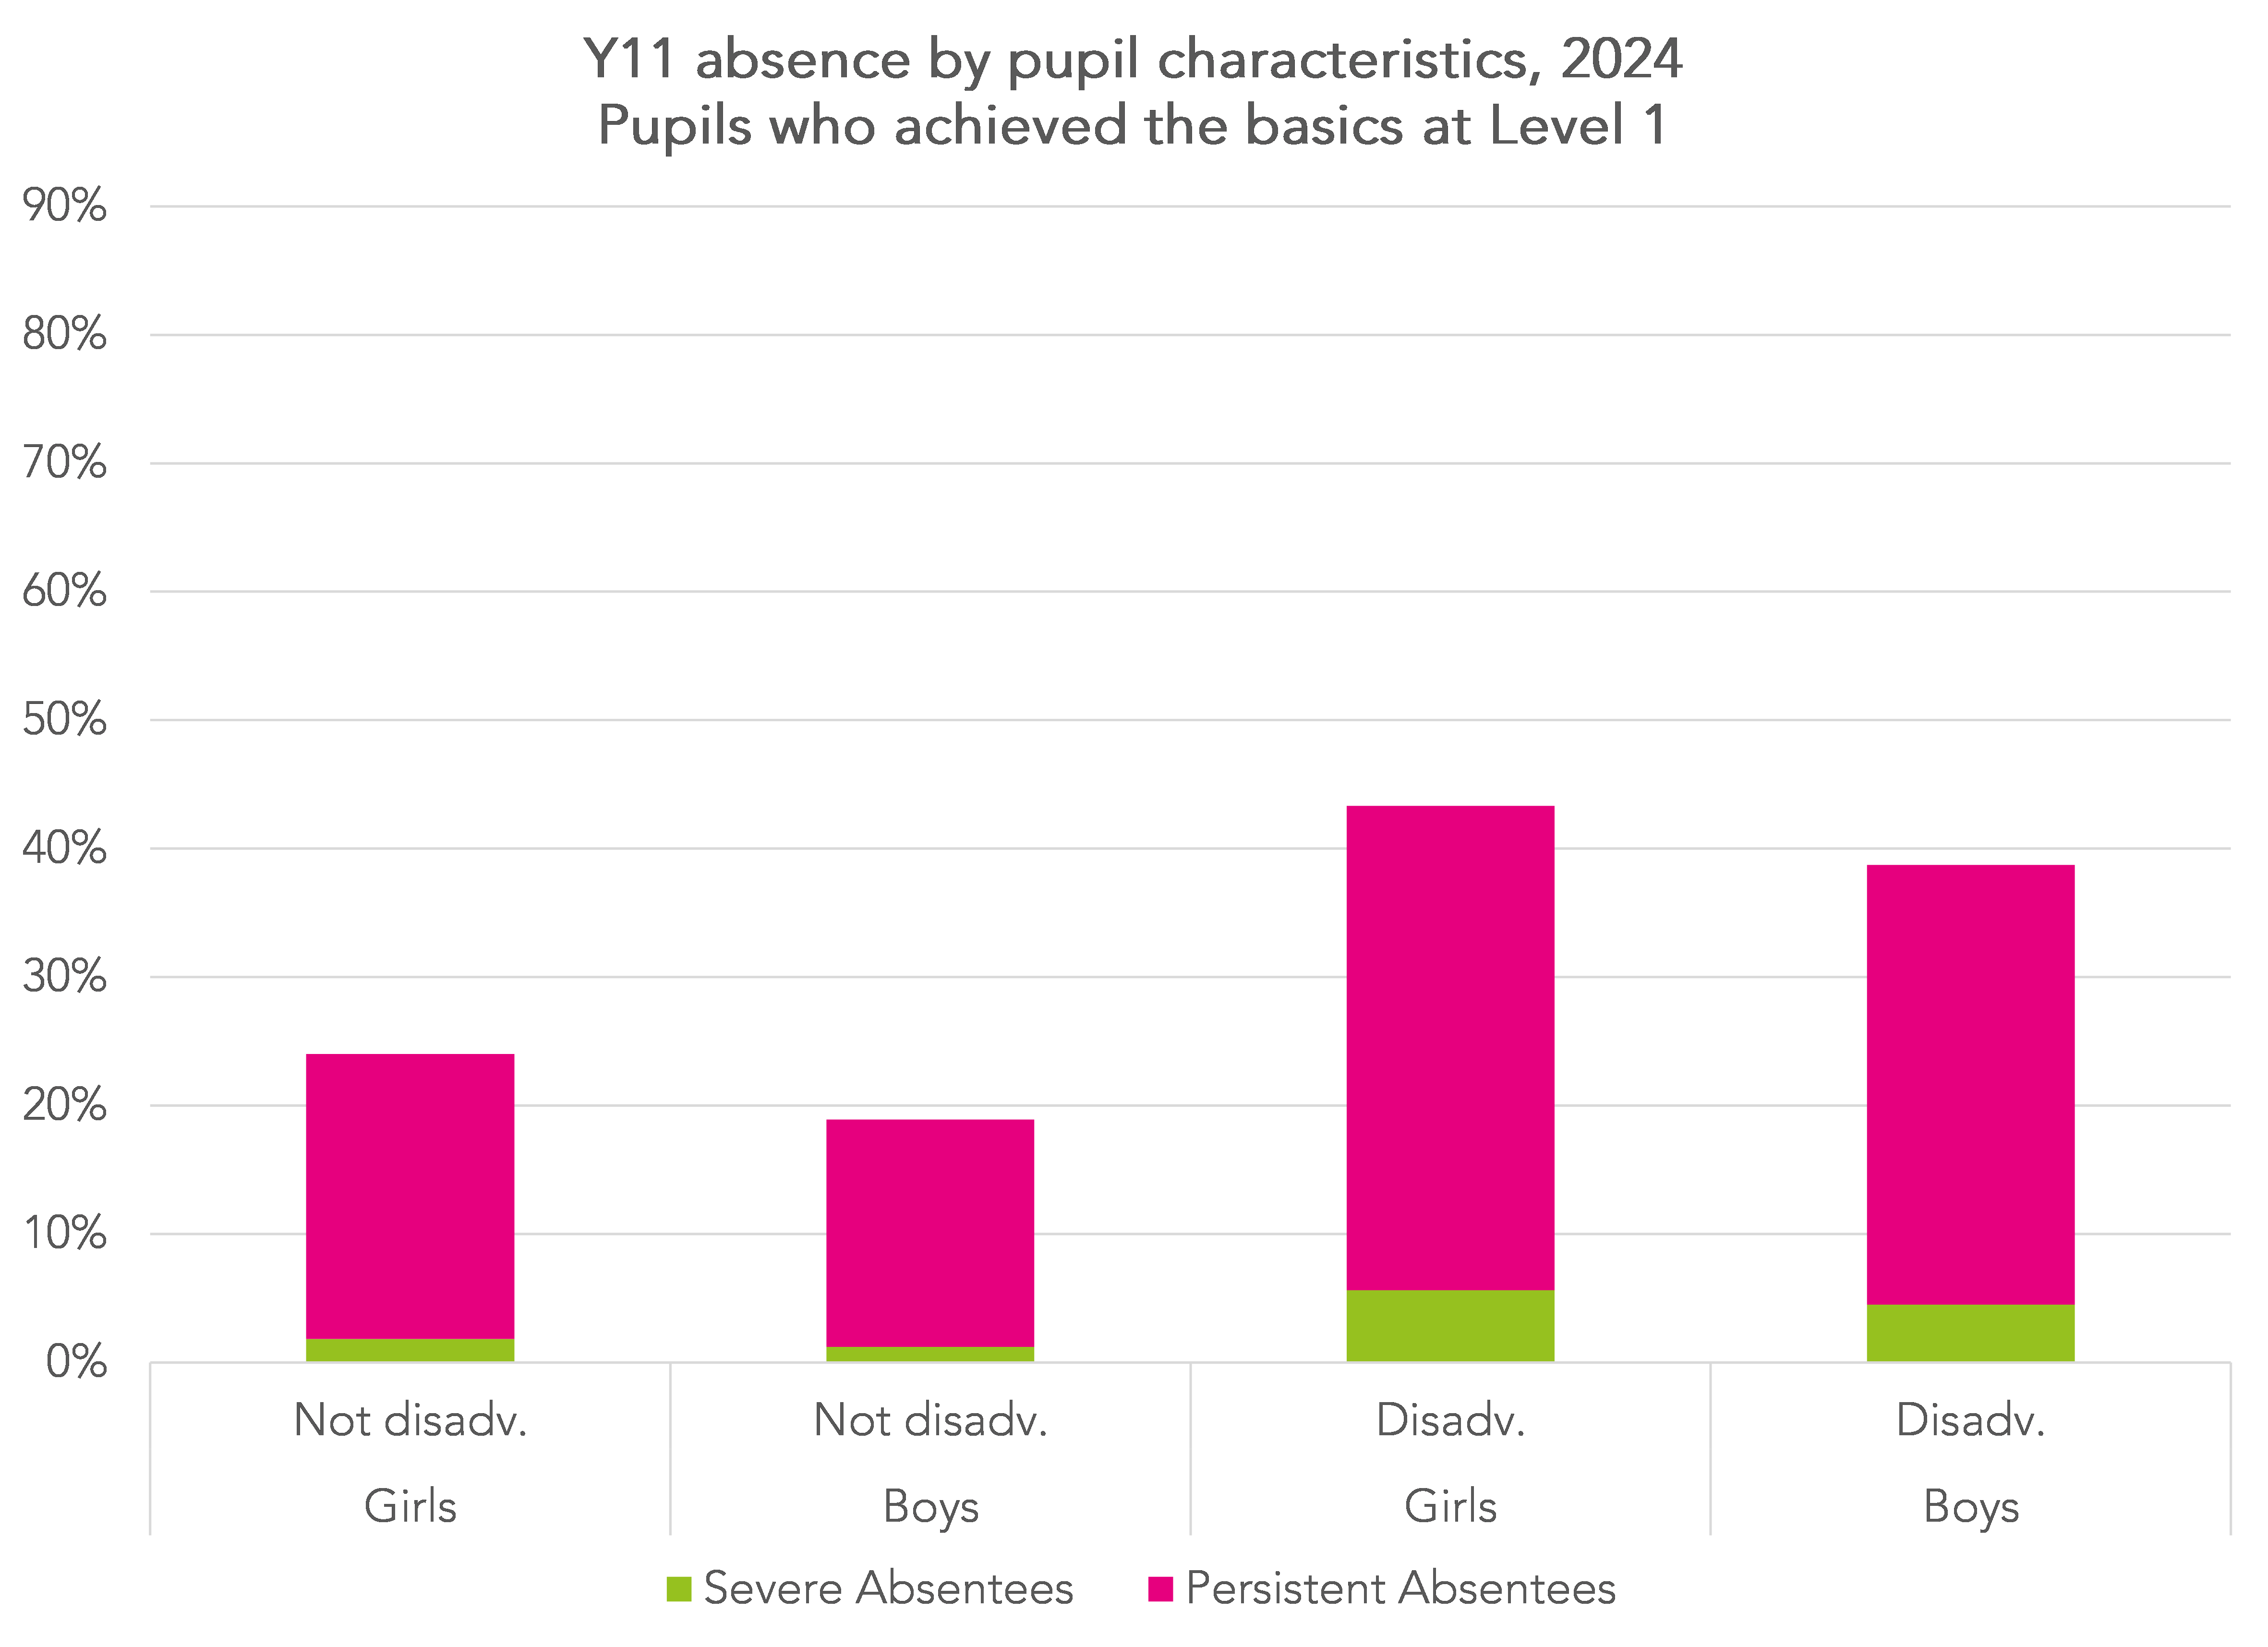
The rate of persistent absence among pupils who achieved the level 1 basics is around half that of those who did not.
As would probably be expected, pupils who do not achieve the level 1 basics tend to have lower levels of prior (Key Stage 2) attainment.
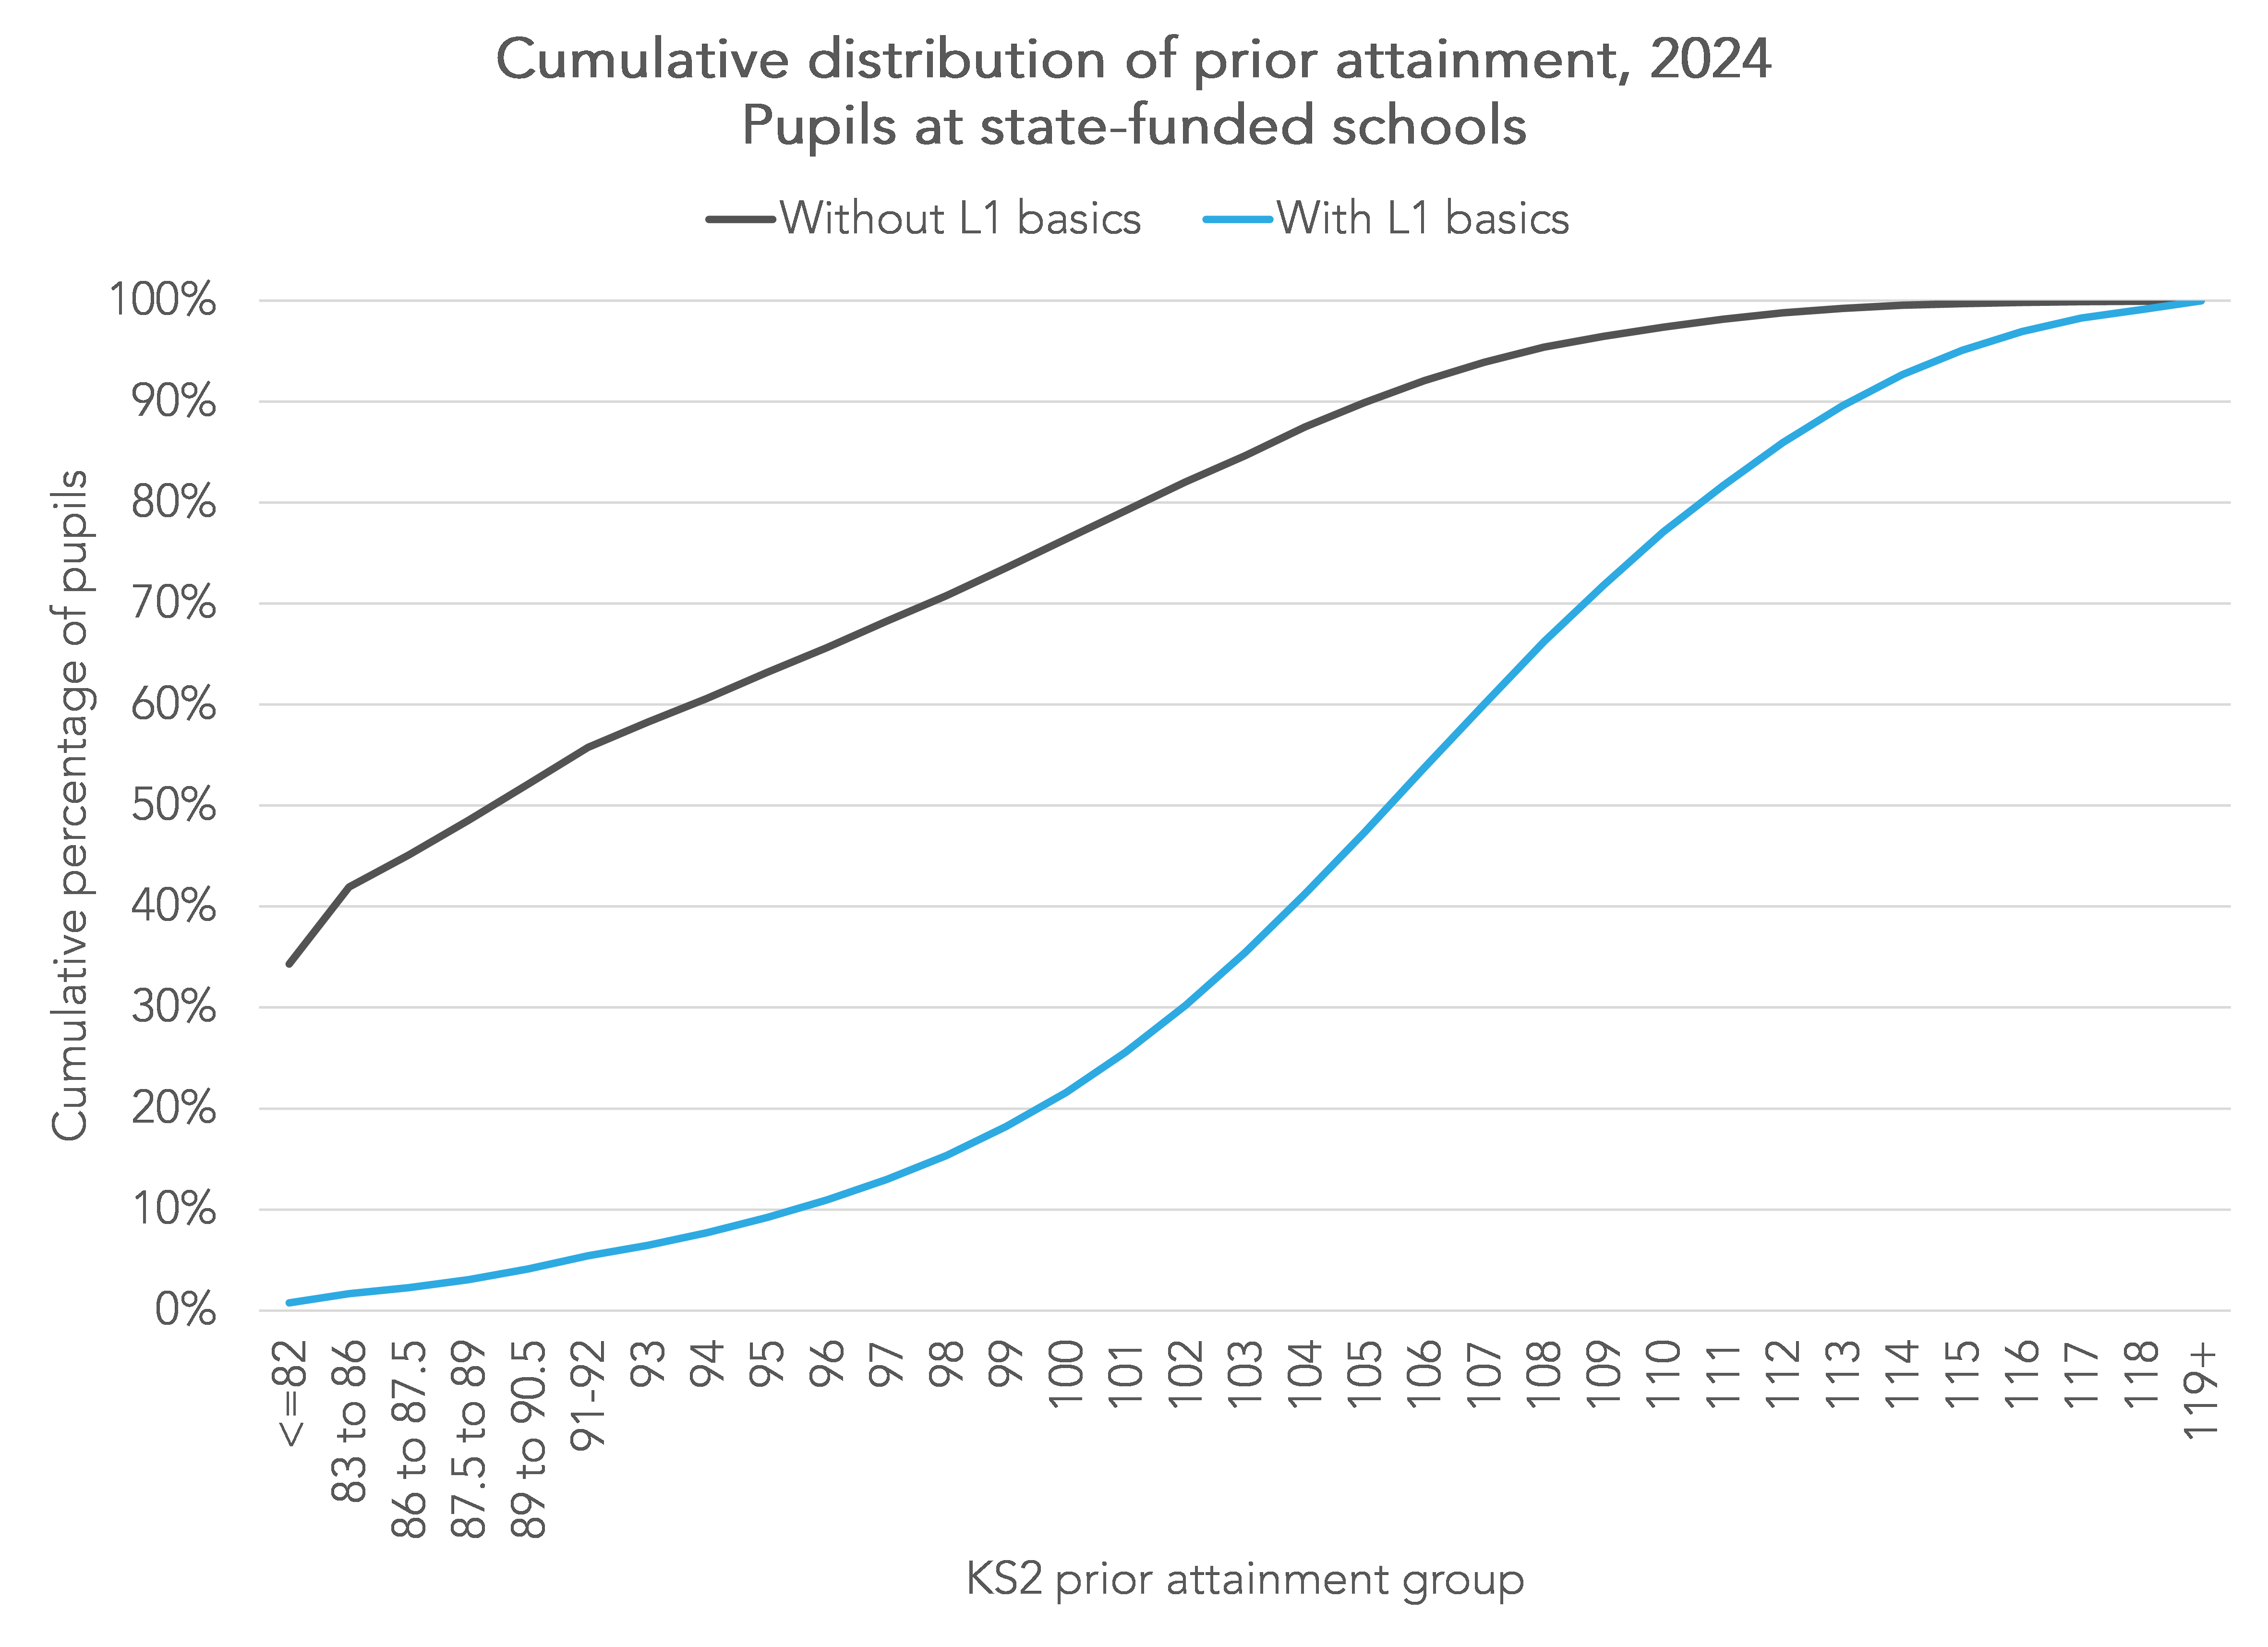
The median score at Key Stage 2[2] among pupils who did not achieve the basics was 90, whereas it was 106 among those who did.
Finally, we can identify a set of specific pupil groups with a higher risk of not achieving the level 1 basics. In the table below, the full national cohort of pupils is allocated to the first group they fall into.

Of almost 31,000 pupils with Education, Health and Care (EHC) plans, nearly 17,000 did not achieve the level 1 basics (55%).
Over 9,000 of 22,000 pupils without EHC plans but who were severely absent in Year 11 also did not achieve the level 1 basics (42%).
These two groups account for 70% of the group of pupils who did not achieve the level 1 basics in 2024.
Summing up
Around 5% of pupils leave school each year without a pass in each of GCSE English language and GCSE mathematics.
In the majority of cases these pupils have not been entered for exams rather than failing them.
Pupils who do not achieve the level 1 basics largely fall into two groups: those with EHC plans and severe absentees.
This would tend to suggest that improving the current position isn’t necessarily just about improving teaching.
- Eligible for free school meals in the last 6 years
- The mean scaled score in reading and maths tests (with teacher assessment for pupils working below the standard of the test)
Want to stay up-to-date with the latest research from FFT Education Datalab? Sign up to Datalab’s mailing list to get notifications about new blogposts, or to receive the team’s half-termly newsletter.


Thank you, Dave, for an interesting analysis
Can you clarify whether PRUS/ AP are included in the mainstream or special data breakdown? Also, is it possible to provide a separate breakdown for this type of provision?
Thanks
Hi Andre. Thanks a lot. PRUs/AP are not included in this (we have used mainstream + special only as per DfE Performance Tables) but we will be updating our analysis of attainment indicators for AP schools later in the year. This was last year’s https://ffteducationdatalab.org.uk/2025/03/key-stage-4-attainment-indicators-for-special-and-alternative-provision-schools/
This is really important, and thank you very much Dave for your analysis. What worries me about the absence of Progress 8 is that it may, if we aren’t careful, remove a focus on these students. Normally they drive a coach and horses through a school’s P8 score, but without that we risk ignoring them.