In a new academic paper published today, we study the extent that socio-economically disadvantaged children with top Key Stage 2 mathematics scores progress in this subject through school and into university. This is part of our Nuffield Foundation funded study into the outcomes of high-achieving disadvantaged children, with previous papers written on this topic available on this site.
Figure 1 illustrates how, of 31,310 disadvantaged pupils with top Key Stage 2 mathematics scores across two school cohorts, 19,160 (61%) achieved at least a GCSE B/5. By age 17 only 6,745 were recorded as studying mathematics, and just 5,000 took A‑level maths. From those A‑level takers, 2,770 obtained at least a B grade; around 1,105 went on to start a mathematics‑focused undergraduate degree; and roughly 715 achieved a 2:1 or first.
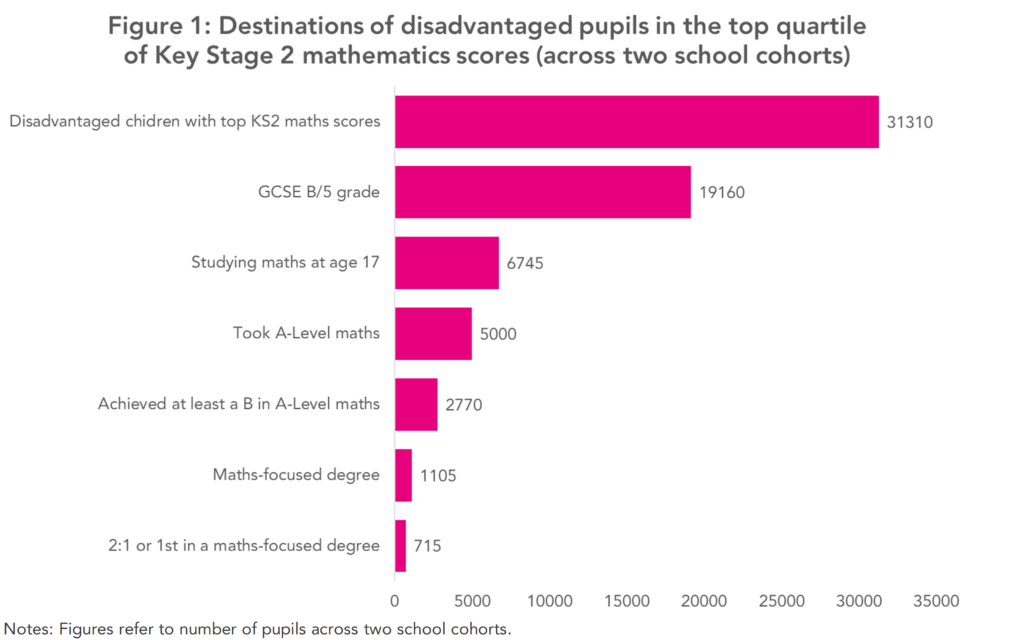
The mathematics pipeline is hence somewhat leaky – tens of thousands of disadvantaged children show clear mathematical ability at age eleven, yet only a tiny fraction go on to achieve at least a 2:1 in a mathematics-focused degree.
Two stages stand out as critical loss points. First, maintaining performance through to GCSE matters enormously: roughly 12,000 of the initial 31,000 high‑ability disadvantaged pupils do not reach a B/5 at GCSE. Second, subject choice at 16 is also decisive — about 14,000 more opt out of advanced mathematics after GCSE. A smaller, but still important, drop occurs when pupils choose university subjects. Taken together, these three losses explain why just 2% of disadvantaged pupils with high Key Stage 2 mathematics scores go on to obtain at least a 2:1 in a mathematics-based degree (physical sciences, mathematical sciences, computer sciences, engineering).
The distribution of losses from this pipeline is not uniform. Figure 2 presents differences in the probability of achieving a GCSE B/5 grade between high-achieving disadvantaged pupils of different ethnicities and genders. Estimates refer to percentage point differences compared with disadvantaged White boys.
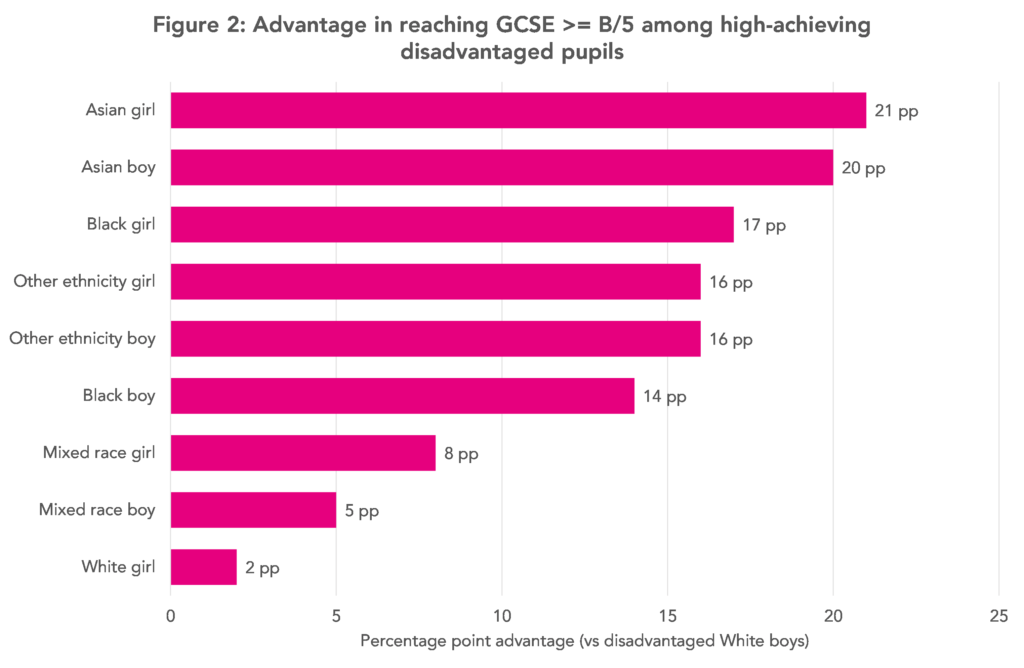
The lost potential of disadvantaged White pupils is particularly acute. High‑achieving Asian pupils are, for example, around twenty percentage points more likely than equally high‑achieving White pupils to secure at least a B/5 grade at GCSE. Initially high-achieving disadvantaged Black pupils also outperform their White peers.
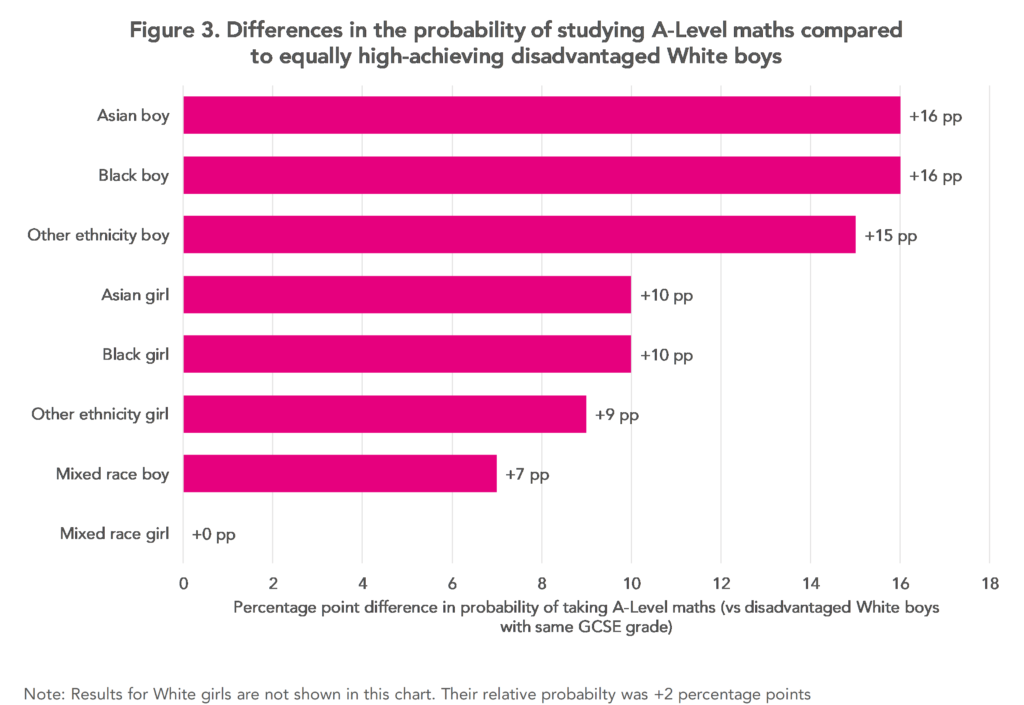
Yet, even when disadvantaged White pupils do continue to achieve a strong grade in GCSE mathematics, they are less likely to continue to choose to study this subject post-16. This is illustrated in Figure 3, which presents differences in the probability of taking A-Level mathematics amongst initially high-achieving disadvantaged pupils that achieved the same GCSE mathematics grades. Results are again presented compared to disadvantaged White boys as the reference group. Even when they are equipped to do so, White boys are around 16 percentage points less likely to choose to study A-Level mathematics than their Black and Asian peers.
Together, these results illustrate how many children show clear potential in mathematics at age eleven but fail to develop that early promise. If we want more home‑grown mathematicians, we need interventions that keep bright disadvantaged pupils engaged in mathematics at the moments that matter most. As we have highlighted previously, Key Stage 3 may be a key period when intervention is needed.
This includes during the GCSE to A-Level transition – when many young people who excel at this subject choose not to study it at an advanced level. Schools and colleges should support high‑ability disadvantaged pupils who excel at mathematics with targeted academic support, clearer subject‑choice guidance and stronger pastoral care that sustains their interest, motivation and aspiration in the subject.
Funders: This project has been funded by the Nuffield Foundation, but the views expressed are those of the authors and not necessarily the Foundation. Visit nuffieldfoundation.org.
Want to stay up-to-date with the latest research from FFT Education Datalab? Sign up to Datalab’s mailing list to get notifications about new blogposts, or to receive the team’s half-termly newsletter.


Hi John, this is very interesting, thank you for publishing. Do you have any analysis comparing the Fig 1 “leaky pipeline” of disadvantaged pupils vs non-disadvantaged pupils? is it much less leaky or about the same?
I was thinking about the same. Is this true across the board that there is a big loss of those mathematically able as it maybe due to competing priorities when it comes to choosing where to focus and what subjects to take. Noone can study all the subjects.
Of course for achievement at GCSE level something else maybe going on as most pupils have to take maths
Yes! See Appendix F here for the the figure for “all pupils”: https://johnjerrim.com/what-happens-to-englands-best-young-mathematicians-from-from-disadvantaged-socioeconomic-backgrounds/
Maths as a subject is not particularly valued in England. Whilst adults might be embarrassed to admit that they cannot read very well, they will openly tell you that they are not very good at Maths and did not enjoy learning Maths at school. Children are influenced by their parents. If their parents do not value Maths skills, then the children are also less likely to. Parents who do not value Maths skills are less likely to support their children by buying them Maths revision books or sending them for extra Maths tutoring. If parents do not have strong Maths skills, they also will not be able to support their children with their Maths homework at secondary school. So whilst these children may have done well at Maths during primary School, they are likely to fall behind during secondary school, losing confidence and therefore interest in the subject. Pupils at secondary school are also very influenced by their peers. Their social life is very important to them. If their friends are not doing so well in Maths and get moved to a lower set, then it is likely they will not mind so much if they end up joining them there. Pupils may be afraid to be seen to be working hard in Maths, due to peer pressure. Secondary schools trying to engage pupils in Maths face more of a challenge when the parents do not support them or value Maths as a subject.
Nothing to do with teaching then?
2%. What percentage of disadvantaged pupils in the top quartile for KS2 maths get any kind of good degree?
At primary school maths is made up of arithmetic (procedural) skills and reasoning skills which are assessed separately. At the end of KS2, given the structure of the SATs, pupils can meet and even exceed the ‘expected standard’ based on good-to-excellent arithmetic skills but average reasoning skills, i.e. they do not need to be great across the board. I research primary school testing, and I have family who teach maths in secondary school, so I have both quantitative and anecdotal evidence here. This means a proportion of the ‘promising mathematicians’ you discuss might not have the solid foundation in mathematical reasoning that’s required for a really secure entry into KS3, despite good procedural skills, so as their secondary school experience progresses they find it more difficult to move forward.
Got a 7 in GCSE maths, did not decide to take A level maths because I thought i would find it incredibly boring and not meaningful due to lots of algebra.
My strong point was in ratios and calculating maths problems dedicated to solving financial problems, which was one of my core reasons why I chose A level accounting instead.
At university I could feel how my gap in maths was an absolute weak point but now I understand it somewhat and can make sense. Point is you can probably study it if you are dedicated enough and im not even that good.
Hopefully this makes sense on why disadvantaged pupils do not like to choose a level math or continue math studies.
This analysis seems to be flawed. You wpuld typically need 6+ score at GCSE to study at Alevl.
Thanks for the comment. I chose to use a liberal threshold in places because at least some pupils do study A-Level maths with a 5. Also, some of the cohorts I investigate are reasonably old. Meaning I use a B grade instead.
It means the results in the “pipeline” presented are conservative in the drop off.
The paper also controls for actual GCSE grade obtained. So this shouldn’t impact the results too much.
I’m curious to see the figures for other subjects and for non-disadvantaged pupils, plus an analysis of how many pupils who were good at maths didn’t take it simply because they were as good at/better at/more motivated by other subjects. How many of these students who “dropped out of maths” studied business, or a research subject, or sciences, or computer sciences? If we control for pupils who also did really well in English and science, have we really “lost” so many to mathematics?
Wouldn’t it make sense to look at those students whose maths scores at school were very good but they’re English and science scores were middling and then see what those pupils ended up doing?
Yes, I see that only a tiny percentage of these pupils study maths at uni. However, I was a white girl from a poor background who got As in maths and statistics GCSEs. What did I end up studying? An interdisciplinary degree, covering philosophy and conscious embodiment. It included elements of formal logic and analysis of research papers and stats. It wouldn’t be considered a mathematical degree but being good at maths relied on similar reasoning skills.
I’m not “lost to maths”, though, because I was basically a straight A student across all academic subjects at school. Maths didn’t draw me in like psychology and philosophy did, when I was able to study these at college. You could say equally so that I was lost to science and English because I didn’t study these at uni (I did biology A level), but my humanities degree included both of these as well.
To be honest, though, a major factor in which I was glad to see the back of maths when I finished my GCSEs was the pressure of having had to do my math GCSE in one year, having had to do statistics GCSE in year 10 instead, and expected to get A/A* in both (I got A in both).
Plus I moved schools the year before my GCSEs, from a school where they taught us why the maths works to a school where they taught us to memorise it.
That did put me off, and, when it can’t to A levels, is also part of why I didn’t study physics (too much maths), and studied some metaphysics at uni instead!
May I ask why the main results focuses on linear regression (rather than logistic regression) to predict binary outcomes?
Am I correct in understanding that the linear regression has some statistical significant results, but these are not reproduced in the logistic modelling? The material could be clearer about reporting statistical significances.
For example – the narrative as above is showing ‘figure 3’ about differences in studying A-Level mathematics or not (a binary outcome) across gender-ethnicity groups. The paper has ‘Appendix Table C2’ that seems to show equivalent logistic regression results, but nothing is marked as being statistically significant across the groups. Are these differences across gender-ethnicity statistically significant or not?
As a note, there’s an extensive amount of research into mathematics and science progression – although the paper only engages with a very small array of material from the economics field.
Thank you.
Alternative hypothesis: the KS2 assessment is deeply flawed and should not be used for any kind of serious analysis.
The main reason I used linear regression was because it just makes things so much easier to interpret! The logistic regression results are broadly consistent – I just didn’t bother to add the significance stars on these results. (Statistical significance is a bit of a weird concept in any case with admin/population level data).
I think this is down to the fact that at KS2 the main focus is on English and Maths, this becomes diluted and children are forced to study subjects they have no interest in, like art, re, he, history and languages. These subjects generally don’t suit someone with high mathematical ability. What it does do however is erode the desire of the child to be at school. A complete attitude shift to disliking education and eventual dropout at the earliest stage. GCSE.