This is the first of a two-part article. The second can be found here.
We’ve shown before (a few times) that literacy at Key Stage 1 (KS1) has an impact on pupils’ outcomes in GCSE English at age 16. But we’ve never been able to look at its impact on longer-term outcomes, like the chances of studying for a degree or being employed. That’s what we’ll be doing today.
Specifically, following on from our previous work, where we showed the negative impact of disadvantage on outcomes like these, we ask: how far can early literacy skills mitigate the effects of long-term disadvantage?
A note about the data
We’ll be using an extract[1] from the DfE’s Longitudinal Education Outcomes dataset (LEO) linked to the National Pupil Database (NPD). From that, we identify a cohort of around 600,000 pupils born between 1st September 1996 and 31st August 1997. These pupils would typically have taken Key Stage 1 tests in 2004, and Key Stage 4 exams in 2013.
Early literacy skills
We start by grouping pupils into three bands by their scores in KS1 reading and writing tests: low, medium and high.
Typically, those in the “low” band achieved the equivalent of a 2C or lower in both tests, and those in the “high” band achieved the equivalent of at least a 2A and a 2B. Pupils in-between those scores went into the “middle” band[2].
In our cohort:
- 20% of pupils were in the “low” early literacy band
- 57% were in the “medium” band
- 14% were in the “high” band
- 9% had no KS1 data and were not assigned a band
We summarise some of the characteristics of pupils in each of these bands below[3]:
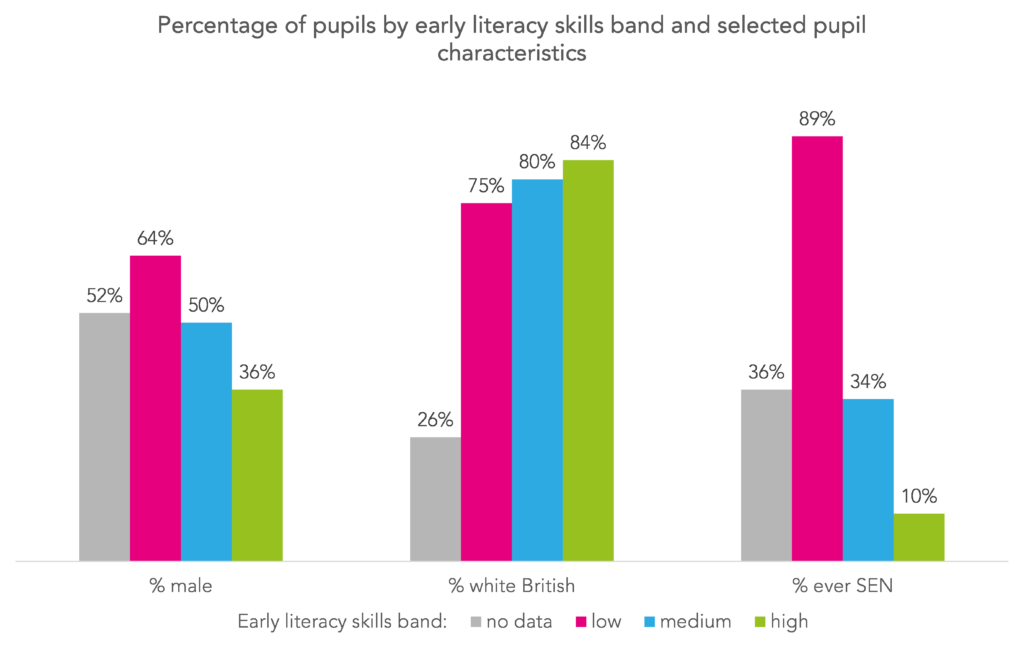
Pupils with the lowest early literacy scores were more likely to be male (64%), less likely to be from a white British background (75%) and much more likely to have had an identified special educational need at some point in their school career (89%) than other pupils. The reverse was true for those with the highest scores (36% male, 84% white British and 10% with SEN). Pupils in this cohort with an identified SEN would have been assessed under the old code of practice when identification rates were higher.
Only 26% of those with no KS1 data were from a white British background. This reflects the fact that pupils with EAL, who tend to be from other ethnic backgrounds, are more likely to join the school system later than those whose first language is English.
The relationship with disadvantage
Below we show the percentage of our cohort by early literacy skills and disadvantage. We quantify disadvantage as the proportion of pupils’ school careers spent eligible for free school meals (FSM).
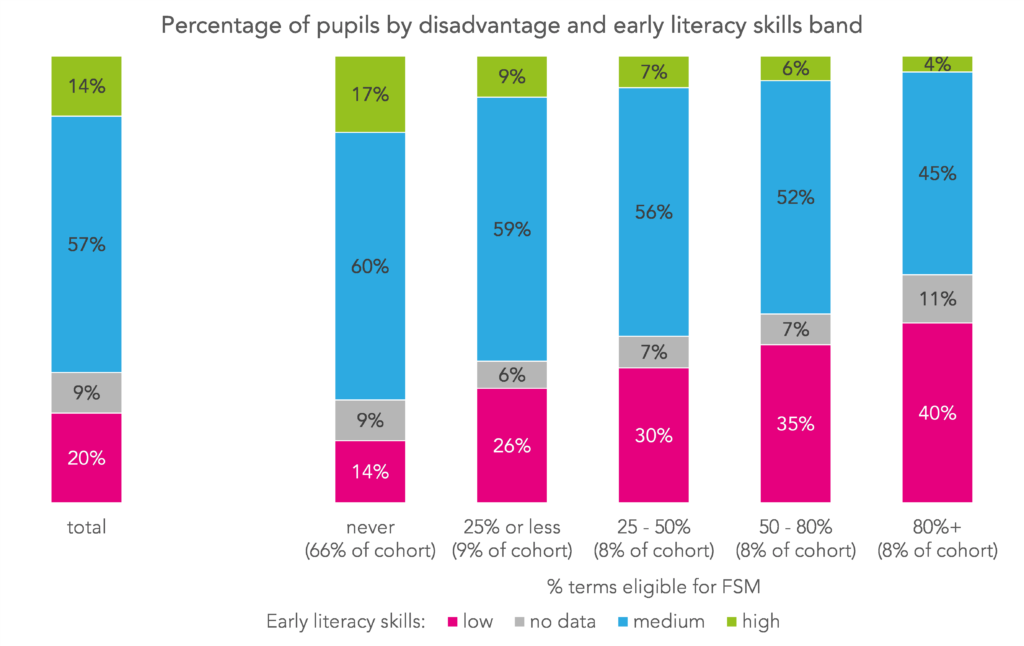
Disadvantaged pupils tended to achieve lower literacy scores than others. Even those who were eligible for FSM for the shortest time – 25% of school terms or fewer – were almost twice as likely to score in the “low” band than those who were never eligible. Long-term disadvantaged pupils – eligible for FSM for at least 80% of school terms – had the lowest literacy scores. Less than half scored in the “medium” or “high” band, and 40% in the “low”.
Outcomes by early literacy skills band
To analyse the longer-term outcomes of pupils in our cohort, we’ll look at the academic year they turned 22[4]: 2018/19. We show, separately for each early literacy skills band, the proportion who:
- had achieved a grade C/4 or better in GCSE English Language,
- had achieved a grade C/4 or better in GCSE maths,
- had achieved qualifications at NQF Level 3 or higher, equivalent to two A-levels,
- were enrolled on a degree-level course at a higher education institution,
- were observed in any positive destination – education or employment – for at least 180 days of the year,
- received workless benefits[5] for at least 180 days of the year.
We’ll start with the first four outcomes.
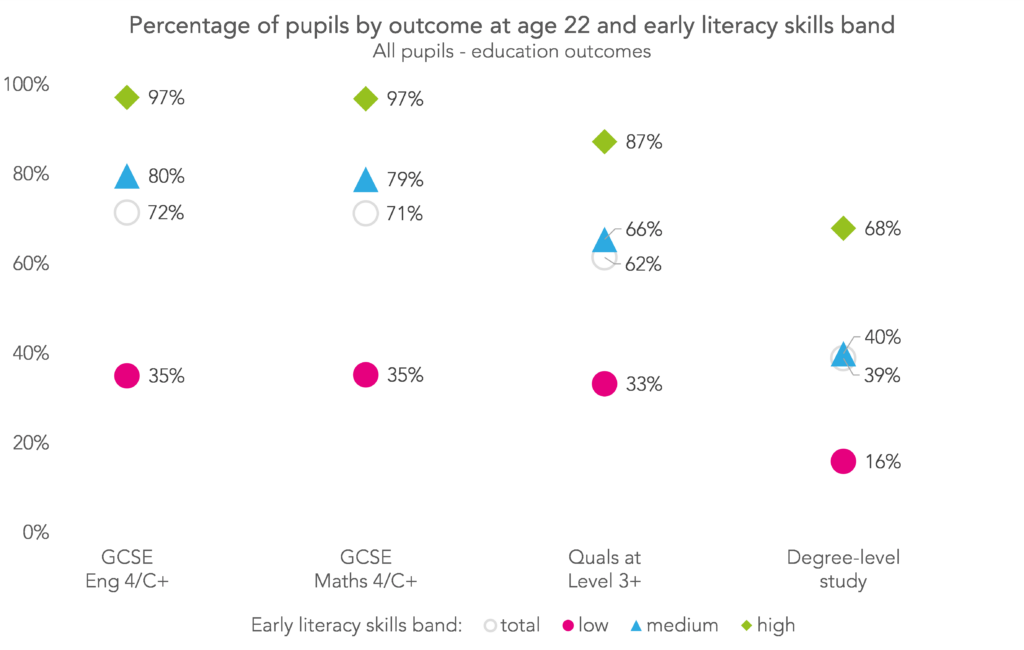
Our previous work highlighted the importance of early literacy skills in achievement at GCSE English by age 16. And this seems to hold true when we extend that age range to 22 (including any resits taken during post-16 or while in higher education). Almost all (97%) of those with high early literacy skills had achieved a grade C/4 or better in GCSE English by the age of 22, compared with only 35% of those with the low early literacy skills. The patterns in GCSE maths outcomes are almost identical.
Early literacy skills also seem to play an important role in achieving level 3 qualifications and progressing to degree-level study, with a difference of around 50 percentage points (pp) in rates among the highest and lowest scorers.
All of the outcomes we’ve discussed so far are entirely education-based, so it’s perhaps not surprising that they correlate strongly with literacy skills, which are also a measure of educational achievement.
We’ll now look at two broader outcomes: whether individuals were in sustained education or employment (which we refer to as a “positive destination”), and/or whether they were in sustained receipt of workless benefits.
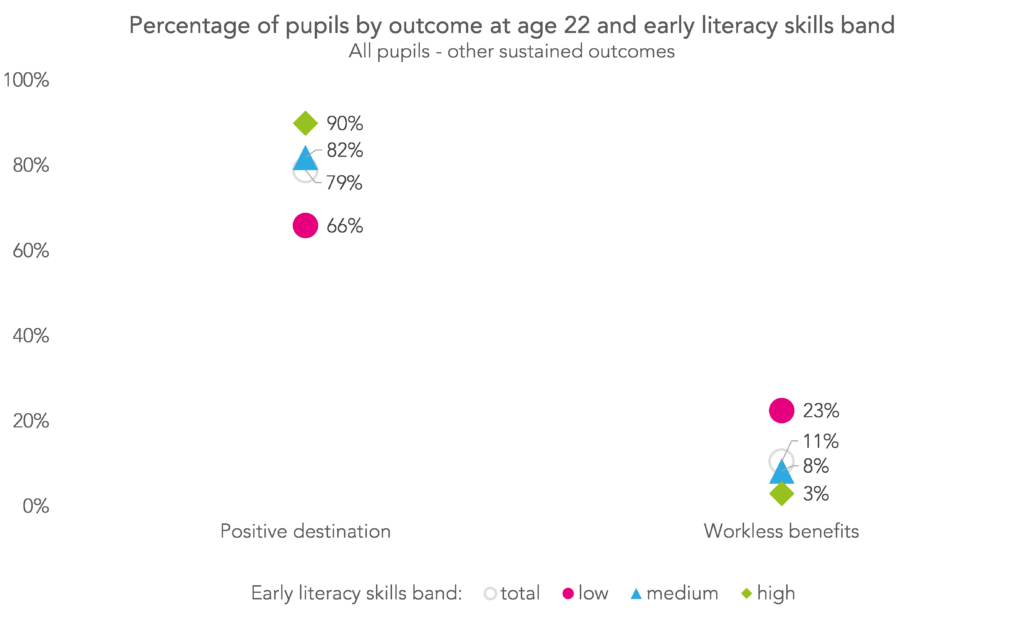
The narrower range between those with the highest and lowest scores implies that these two outcomes are less strongly associated with early literacy skills. There does still appear to be some relationship, however, particularly for those with the lowest scores. While 90% of those in the high band and 82% of those in the medium band were observed in a positive destination, only 66% of those in the low band were. Similarly, 3% of those in the high and 8% of those in the medium band were receiving workless benefits, while 23% of those in the low band were.
The combination of early literacy skills and disadvantage
At this point, you might be feeling a bit sceptical. You’ll remember that a much higher proportion of long-term disadvantaged pupils had low early literacy scores (40%) than those who were never disadvantaged (14%). So, if pupils with low early literacy scores are more likely to also be the most disadvantaged, it makes sense that they would also have worse outcomes.
We can start to pick these factors apart by looking at how outcomes vary by the combination of literacy skills AND disadvantage.
Continue reading in part two.
[1] The extract we’re working with covers outcomes up to 2019
[2] The full method sees levels assigned the following points scores: W = 0, 1 = 1.1, 2C = 1.9, 2B = 2.7, 2A = 3.7 and 3+ = 5. The “low” band is a combined reading and writing score (summed, not averaged) of less than 4.6, “high” is a combined score of 6.4 or more, and “middle” is anything in between. These thresholds are informed by our previous work, which showed that pupils scoring 4.6 or more had a 50% or greater chance of going on to achieve at least a grade 4 in GCSE English at 16.
[3] The “ever SEN” measure counts pupils for whom a census record exists at any point in their school career where they were identified as having any special educational need.
[4] Apart from the percentage of the cohort observed studying for a degree – for that one we look at the year they turned 21 so we don’t miss those who graduated before the age of 22
[5] Jobseekers Allowance (JSA), Jobseekers Training Allowance (JTA), Employment and Support Allowance (ESA), Incapacity Benefit (IB), Income Support (IS), Passported IB (PIB), Severe Disablement Allowance (SDA), Pension Credit (PC), State (Retirement) Pension (RP), Carers Allowance (Invalid Carers Allowance – ICA), Attendance Allowance (AA), Universal Credit – Searching for Work (UAA), Universal Credit – No Work requirements (UBC), Universal Credit – Preparing for work (UCE), Universal Credit – Planning for work (UDF)
Want to stay up-to-date with the latest research from FFT Education Datalab? Sign up to Datalab’s mailing list to get notifications about new blogposts, or to receive the team’s half-termly newsletter.


wouldn’t a lot of the descriptive differences in attainment and long-term outcomes by prior literacy score be accounted for by demographics like %SEN as you show in the first chart? almost 90% of low literacy pupils have SEN, which is itself one of (if not the biggest?) the biggest predictors of attainment.
Hi Mohammed. We do tackle the pupil characteristics question in part two of this blog – we do a logistic regression for each outcome with early literacy skills, disadvantage and a range of other pupil characteristics as independent variables. We still find a significant link between early literacy skills and outcomes. We didn’t include SEND as a pupil characteristic in those regressions though because SEND identification is so often caused (at least in part) by low attainment.