We’ve been writing for a number of years about the attainment and progress of long-term disadvantaged pupils. So when we were given the opportunity to look at their longer-term outcomes, we jumped at it. You can read our report to the Northern Powerhouse Partnership here.
When we’ve looked at attainment and progress in the past, we’ve seen not only that disadvantaged pupils tend to do worse than their better-off peers, but that those who are disadvantaged for the longest time do worst of all.
We’ve also seen that outcomes for the most disadvantaged pupils vary by region, and that much (though not all) of this is related to differences in ethnicity among the underlying population. In this new study, we wanted to see whether these patterns are repeated in longer-term outcomes, both in education and in the labour market.
Here are some of the highlights.
Setting the scene
The cohort we focus on are those who turned 16 in the 2012/13 academic year – for most, this was also the year they finished Year 11 and took their end of Key Stage 4 exams. The data comes from the National Pupil Database (NPD) linked to the Longitudinal Educational Outcomes (LEO) dataset.
First, let’s look at the distribution of disadvantage among individuals in our cohort.

The majority were never eligible for free school meals (FSM) during their time at school. There are then roughly equal numbers in each of the other bands, with around 8% of the cohort spending at least 80% of their school careers eligible for FSM[1]. This is the group we’ll refer to as “long-term disadvantaged,” or LTD for short.
Disadvantage varies considerably across the country. Below we show the proportion of long-term disadvantaged individuals and those who were never eligible for FSM by region.
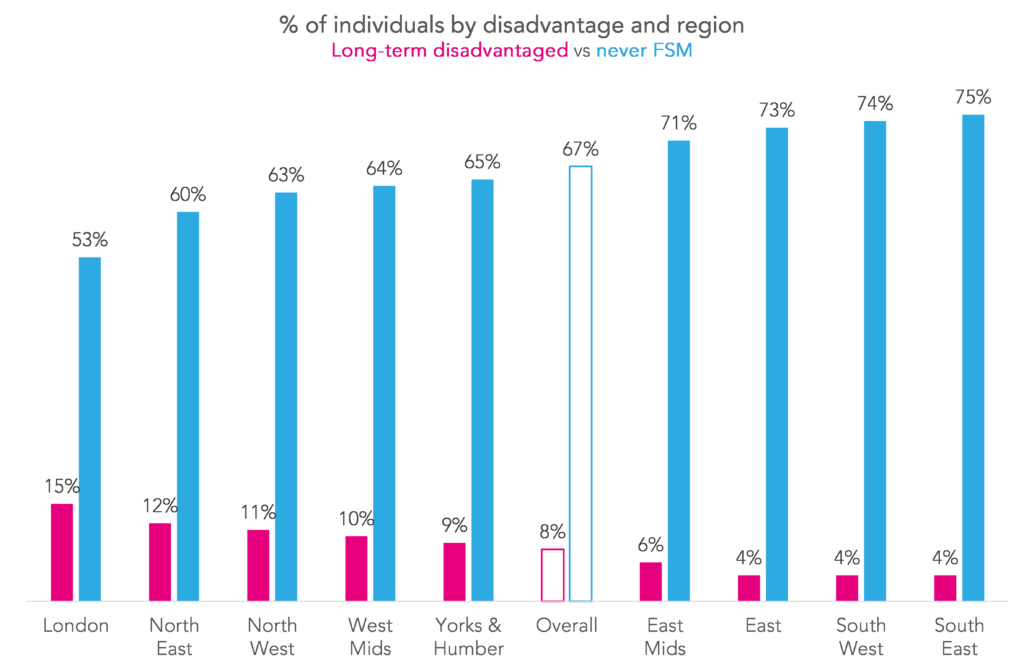
London had the highest proportion of long-term disadvantaged individuals at 15%, followed by the North East, 12%, and the North West, 10%. The East, South West and South East have the lowest proportion at 4%.
Long-term outcomes nationally
In the full report, we look at a wide range of outcomes of the members of our cohort, for example, qualification rates, further and higher education participation, and employment and earnings. We also construct a single summary measure – the likelihood of being observed in a sustained positive destination, either in education or employment, at age 22.[2]
Here’s how that measure varies with disadvantage.
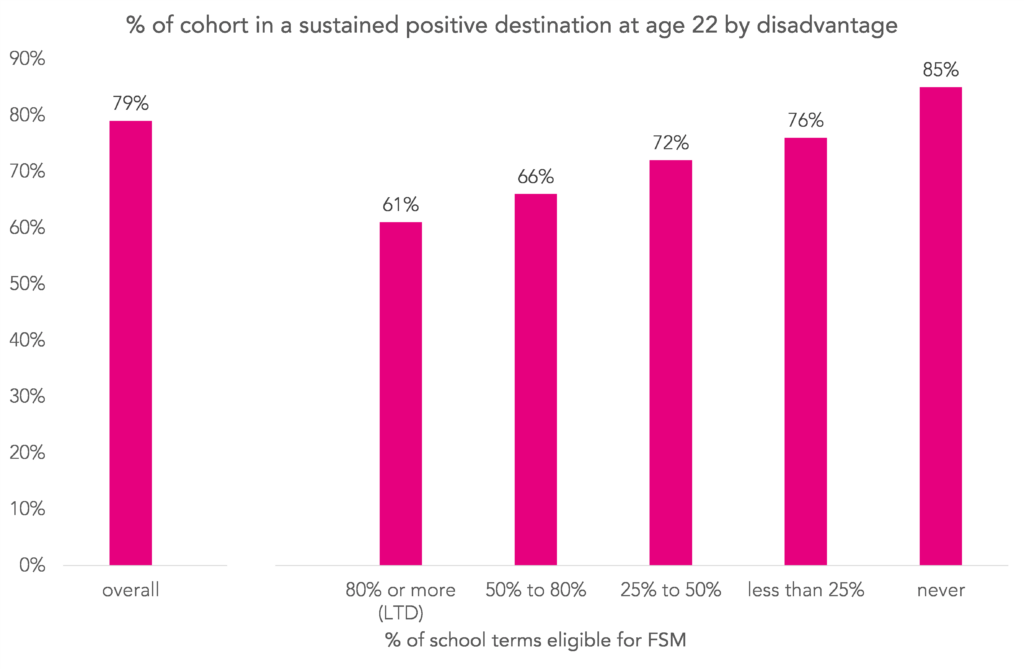
Those who were eligible for FSM at school for any length of time were less likely to go on to a positive destination than those who were never eligible. And long-term disadvantaged individuals were the least likely of all – around 20% less likely than those who were eligible for FSM for the shortest time, and around 30% less likely than those who had never been eligible.
There are striking results in some of the other outcome measures too. We highlight one – the likelihood of being in sustained receipt of workless benefits[3] at age 22 – below.
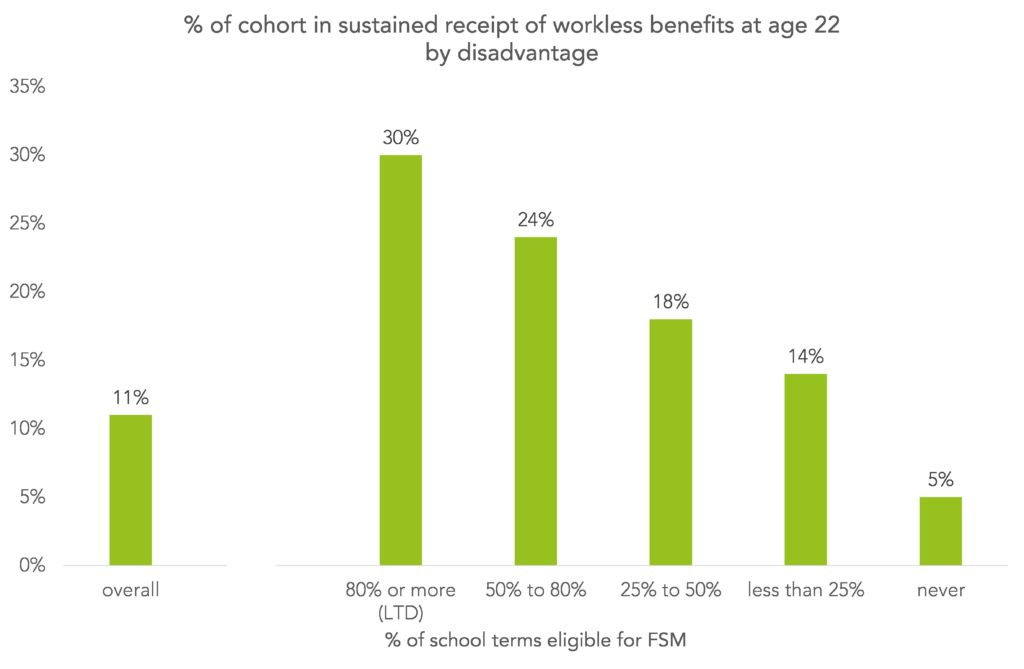
Long-term disadvantaged individuals were around twice as likely to be observed in sustained receipt of workless benefits at age 22 than those who were eligible for FSM for the shortest period. And around six times more likely than those who were never eligible for FSM.
The regional picture
To see how outcomes vary by region, we plot our positive destination measure for each region, separately for long-term disadvantaged and never FSM individuals.
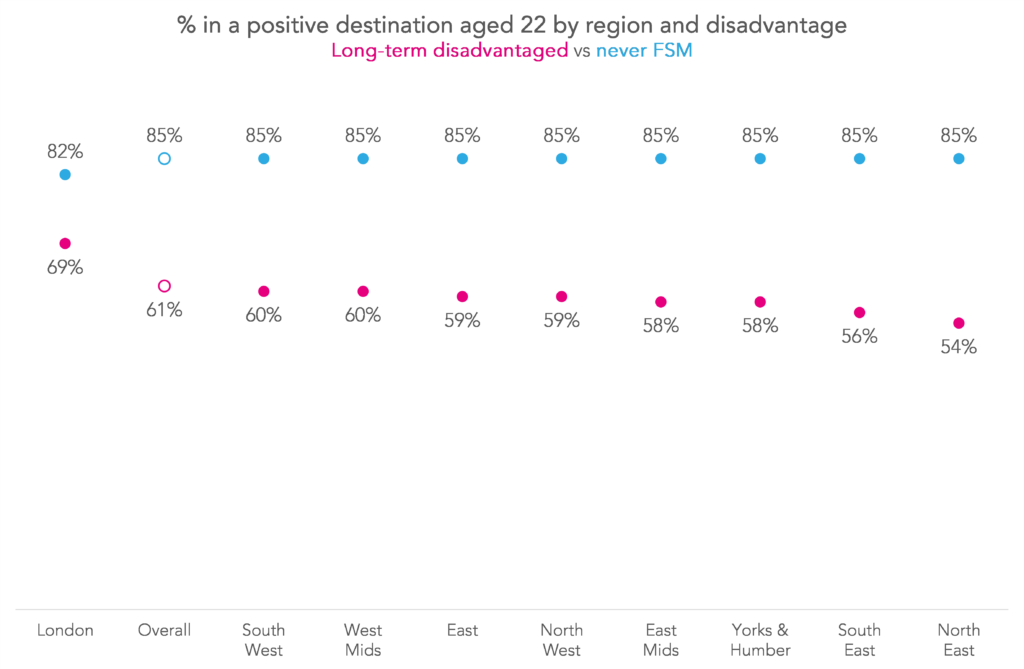
Outcomes for those who were never eligible for FSM are pretty similar across the regions. But there is some variation for those who were long-term disadvantaged, particularly between the region with the best outcomes – London (69% in a positive destination) – and the region with the worst – the North East (54%).
However, London and the North East have very different demographics, particularly in terms of ethnicity. And we know that there are some ethnic backgrounds where disadvantage seems to have a high impact on attainment and progress and others a low impact. (The high-impact group mostly consists of those from a White British background, but also Black Caribbean, Mixed White and Black Caribbean, White Irish, White Romany, Irish Traveller, and those whose ethnic background is unknown. The low-impact group consists of those from all other ethnic backgrounds).
Below we show the ethnic breakdown of the long-term disadvantaged group by region.
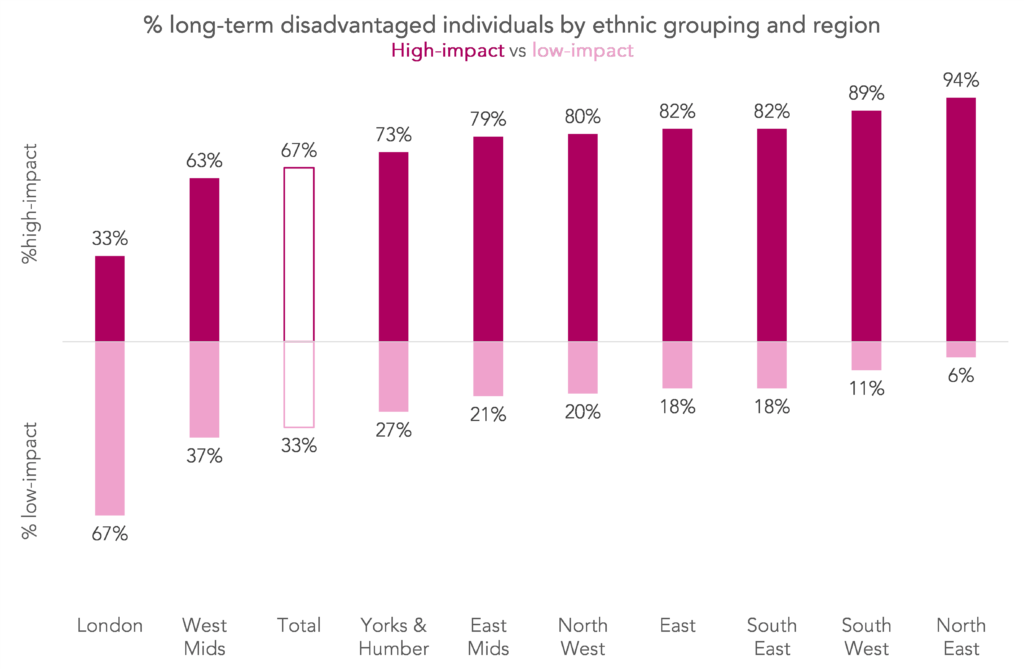
Immediately we see how different London is – only 33% of long-term disadvantaged individuals were from a high-impact ethnic background. The region with the second-lowest proportion is the West Midlands, with 63%. In contrast, in the North East, 94% of long-term disadvantaged individuals were from a high-impact ethnic background.
So instead of looking at outcomes for each region’s LTD group as a whole, we’ll look separately at those from high- and low-impact ethnic backgrounds.
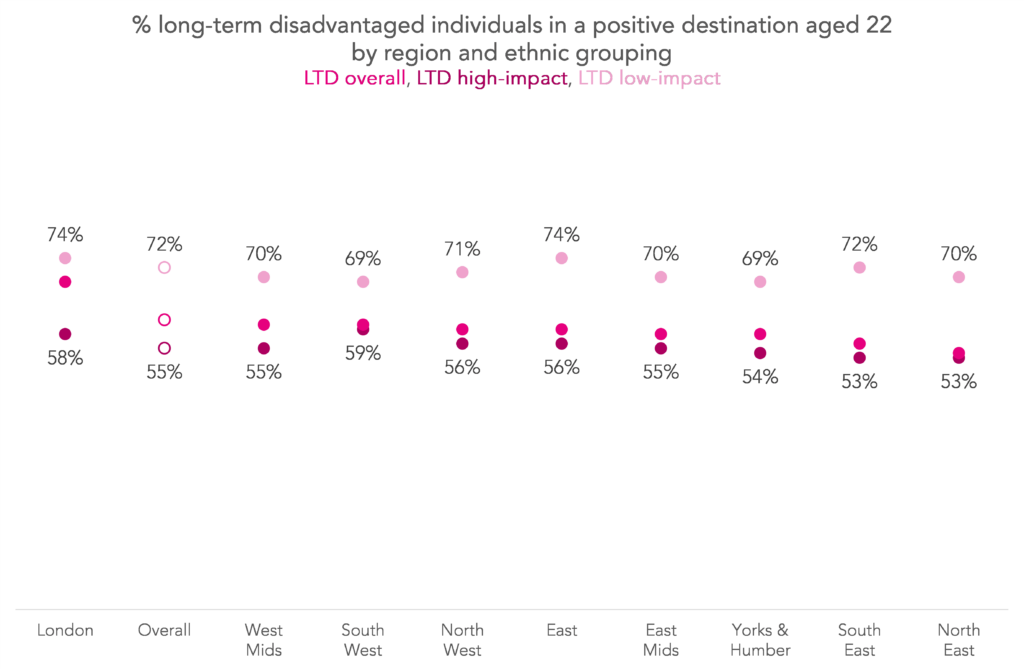
Doing this reduces the variation a lot. Among LTD individuals from a low-impact ethnic background, there’s a difference of 5 percentage points (pp) between the regions with the best and worst outcomes. And for those from a high-impact ethnic background, the range is 6pp. Both of these figures are lower than the range for the LTD group as a whole, which was 15pp.
Is it all a question of ethnicity then?
In short: no, we don’t think so. At least not entirely.
We repeated this analysis for two other outcomes – achieving qualifications at level 3 or above by age 22, and undertaking degree-level study at age 21. In both cases, LTD individuals in London had much better outcomes than elsewhere. Much of this advantage disappears when we divide the group by ethnic background, but not all of it. This suggests there may be other factors at play too.
Other outcomes
If you’d like to read our full analysis of these and other long-term outcomes, you can find the full report here. We’ve also published a statistical appendix.
[1]: This only captures terms where individuals were recorded as being eligible for FSM in the school census. Terms where individuals had a period of FSM eligibility that started and ended before census day are therefore not included. This means that the dividing lines between the categories are a bit fuzzy (for example, there will be some individuals classed as “never FSM” who were in fact eligible, just not according to school census data).
[2]:We define a sustained positive destination as being continuously enrolled in education (school, further education or higher education) or in employment for 180 days or more.
[3]: Jobseekers Allowance (JSA), Jobseekers Training Allowance (JTA), Employment and Support Allowance (ESA), Incapacity Benefit (IB), Income Support (IS), Passported IB (PIB), Severe Disablement Allowance (SDA), Pension Credit (PC), State (Retirement) Pension (RP), Carers Allowance (Invalid Carers Allowance – ICA), Attendance Allowance (AA), Universal Credit – Searching for Work (UAA), Universal Credit – No Work requirements (UBC), Universal Credit – Preparing for work (UCE), Universal Credit – Planning for work (UDF)
Want to stay up-to-date with the latest research from FFT Education Datalab? Sign up to Datalab’s mailing list to get notifications about new blogposts, or to receive the team’s half-termly newsletter.


Thank you for sharing the study details. This is my field of interest as well. Please permit me to contact you for any individual clarification.
Hi Beena. Of course! You can get in touch using our central mailbox (educationdatalab@fft.org.uk) or you can contact any of us individually using the format firstname.lastname@fft.org.uk, e.g. my email address is katie.beynon@fft.org.uk