Last year, we conducted a piece of analysis for TES magazine about the use of “fair banding” tests in admissions processes. We wanted to see whether schools which used these tests tended to have different pupil populations than schools which didn’t. For example, did they have more disadvantaged pupils or fewer?
With last week’s schools white paper suggesting rules may be “tighten[ed to] ensure banding produces representative intakes” [1], we thought we’d release our findings in full.
What is “fair banding”?
On applying to certain secondary schools, pupils are required to sit a test which puts them into an “ability band”. Schools then use this banding in their oversubscription criteria.
There is some freedom over how exactly they do this, as long as they don’t favour pupils with higher scores[2]. Some may draw a set number of pupils from each ability band, aiming for an intake which is representative of the national population (a “comprehensive” intake). Others may aim for an intake which is representative of their pool of applicants.
The big criticism of fair banding is that applicants who don’t sit the tests tend to be deprioritised when offers are made. And, when tests are run by individual secondary schools, outside of normal school time, the pupils most likely to miss them are those in the most challenging circumstances. For example, children whose families can’t afford transport from home to the test location. Thus, the tests themselves could inadvertently be acting as a selection effect against vulnerable pupils.
There is research showing that banding could “expand potential access to effective schools” for disadvantaged pupils compared with the status quo. However, this assumes a scenario where all schools use banding, and tests are administered centrally, thus avoiding the potential selection effects described above.
Our analysis
We teamed up with TES magazine to probe the idea that fair banding, in its current form, might be disadvantaging the already disadvantaged. Through freedom of information requests to local authorities, TES compiled a list of schools that used fair banding in their admissions arrangements for 2024/25 Year 7 entry.
We compared the characteristics of pupils in schools which used fair banding with:
- All schools in the same local authorities which did not use fair banding
- Schools which did not use fair banding and which are closest geographically to schools which did[3]
We used 2024 Key Stage 4 data, which contains information on the characteristics of pupils in 2023/24’s Year 11, as well as their exam results. We also used data published on the characteristics of schools’ entire pupil populations, again, from 2023/24.
As schools’ admissions policies change over time, these aren’t the best datasets to have used. Ideally, we’d have used data on pupil characteristics in Year 7 in 2024/25. However, this isn’t a dataset which is publicly available.
We present our analysis with this caveat in mind. That there will be pupils that we included in the fair banding group who weren’t subject to the tests when they were admitted to Year 7, and vice versa.
How widespread is the usage of fair banding tests?
Let’s start by looking at how many schools used these tests as part of their admissions procedures.
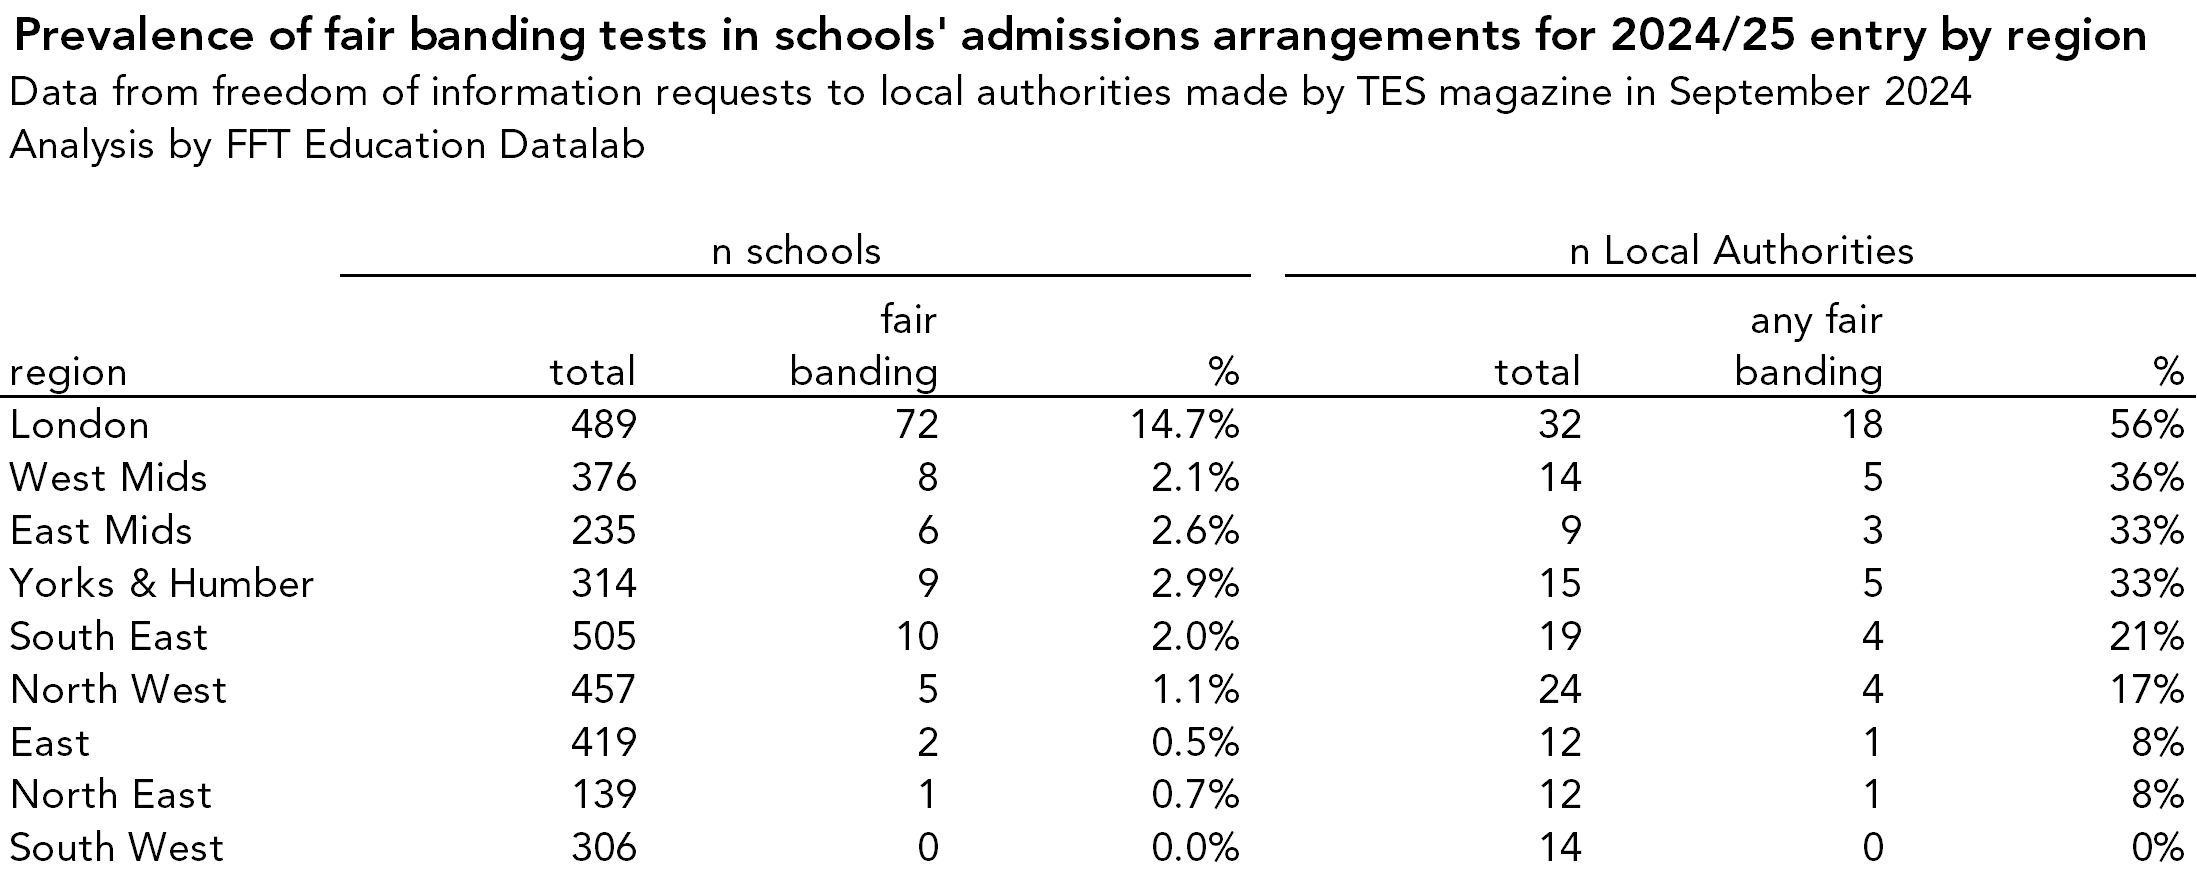
Overall, TES identified 112 secondary schools which used fair banding tests, with the majority (72) located in London. The South East (10) and Yorkshire and the Humber (9) were the regions with the second and third highest numbers of fair banding schools.
Proportionally then, fair banding is relatively rare. Even in London, the area with the highest prevalence, only 15% of schools used them. Outside of London, just 1.5% of schools did.
When we look at prevalence by local authority, however, we see a different picture. In London, just over half of local authorities (18 of 32, 56%) had at least one school which used fair banding. In the West Midlands (5 out of 14, 36%), East Midlands (5 out of 15, 33%), and Yorkshire and the Humber (3 out of 9, 33%), it’s around a third. Overall, outside of London, around 20% of local authorities had at least one fair banding school.
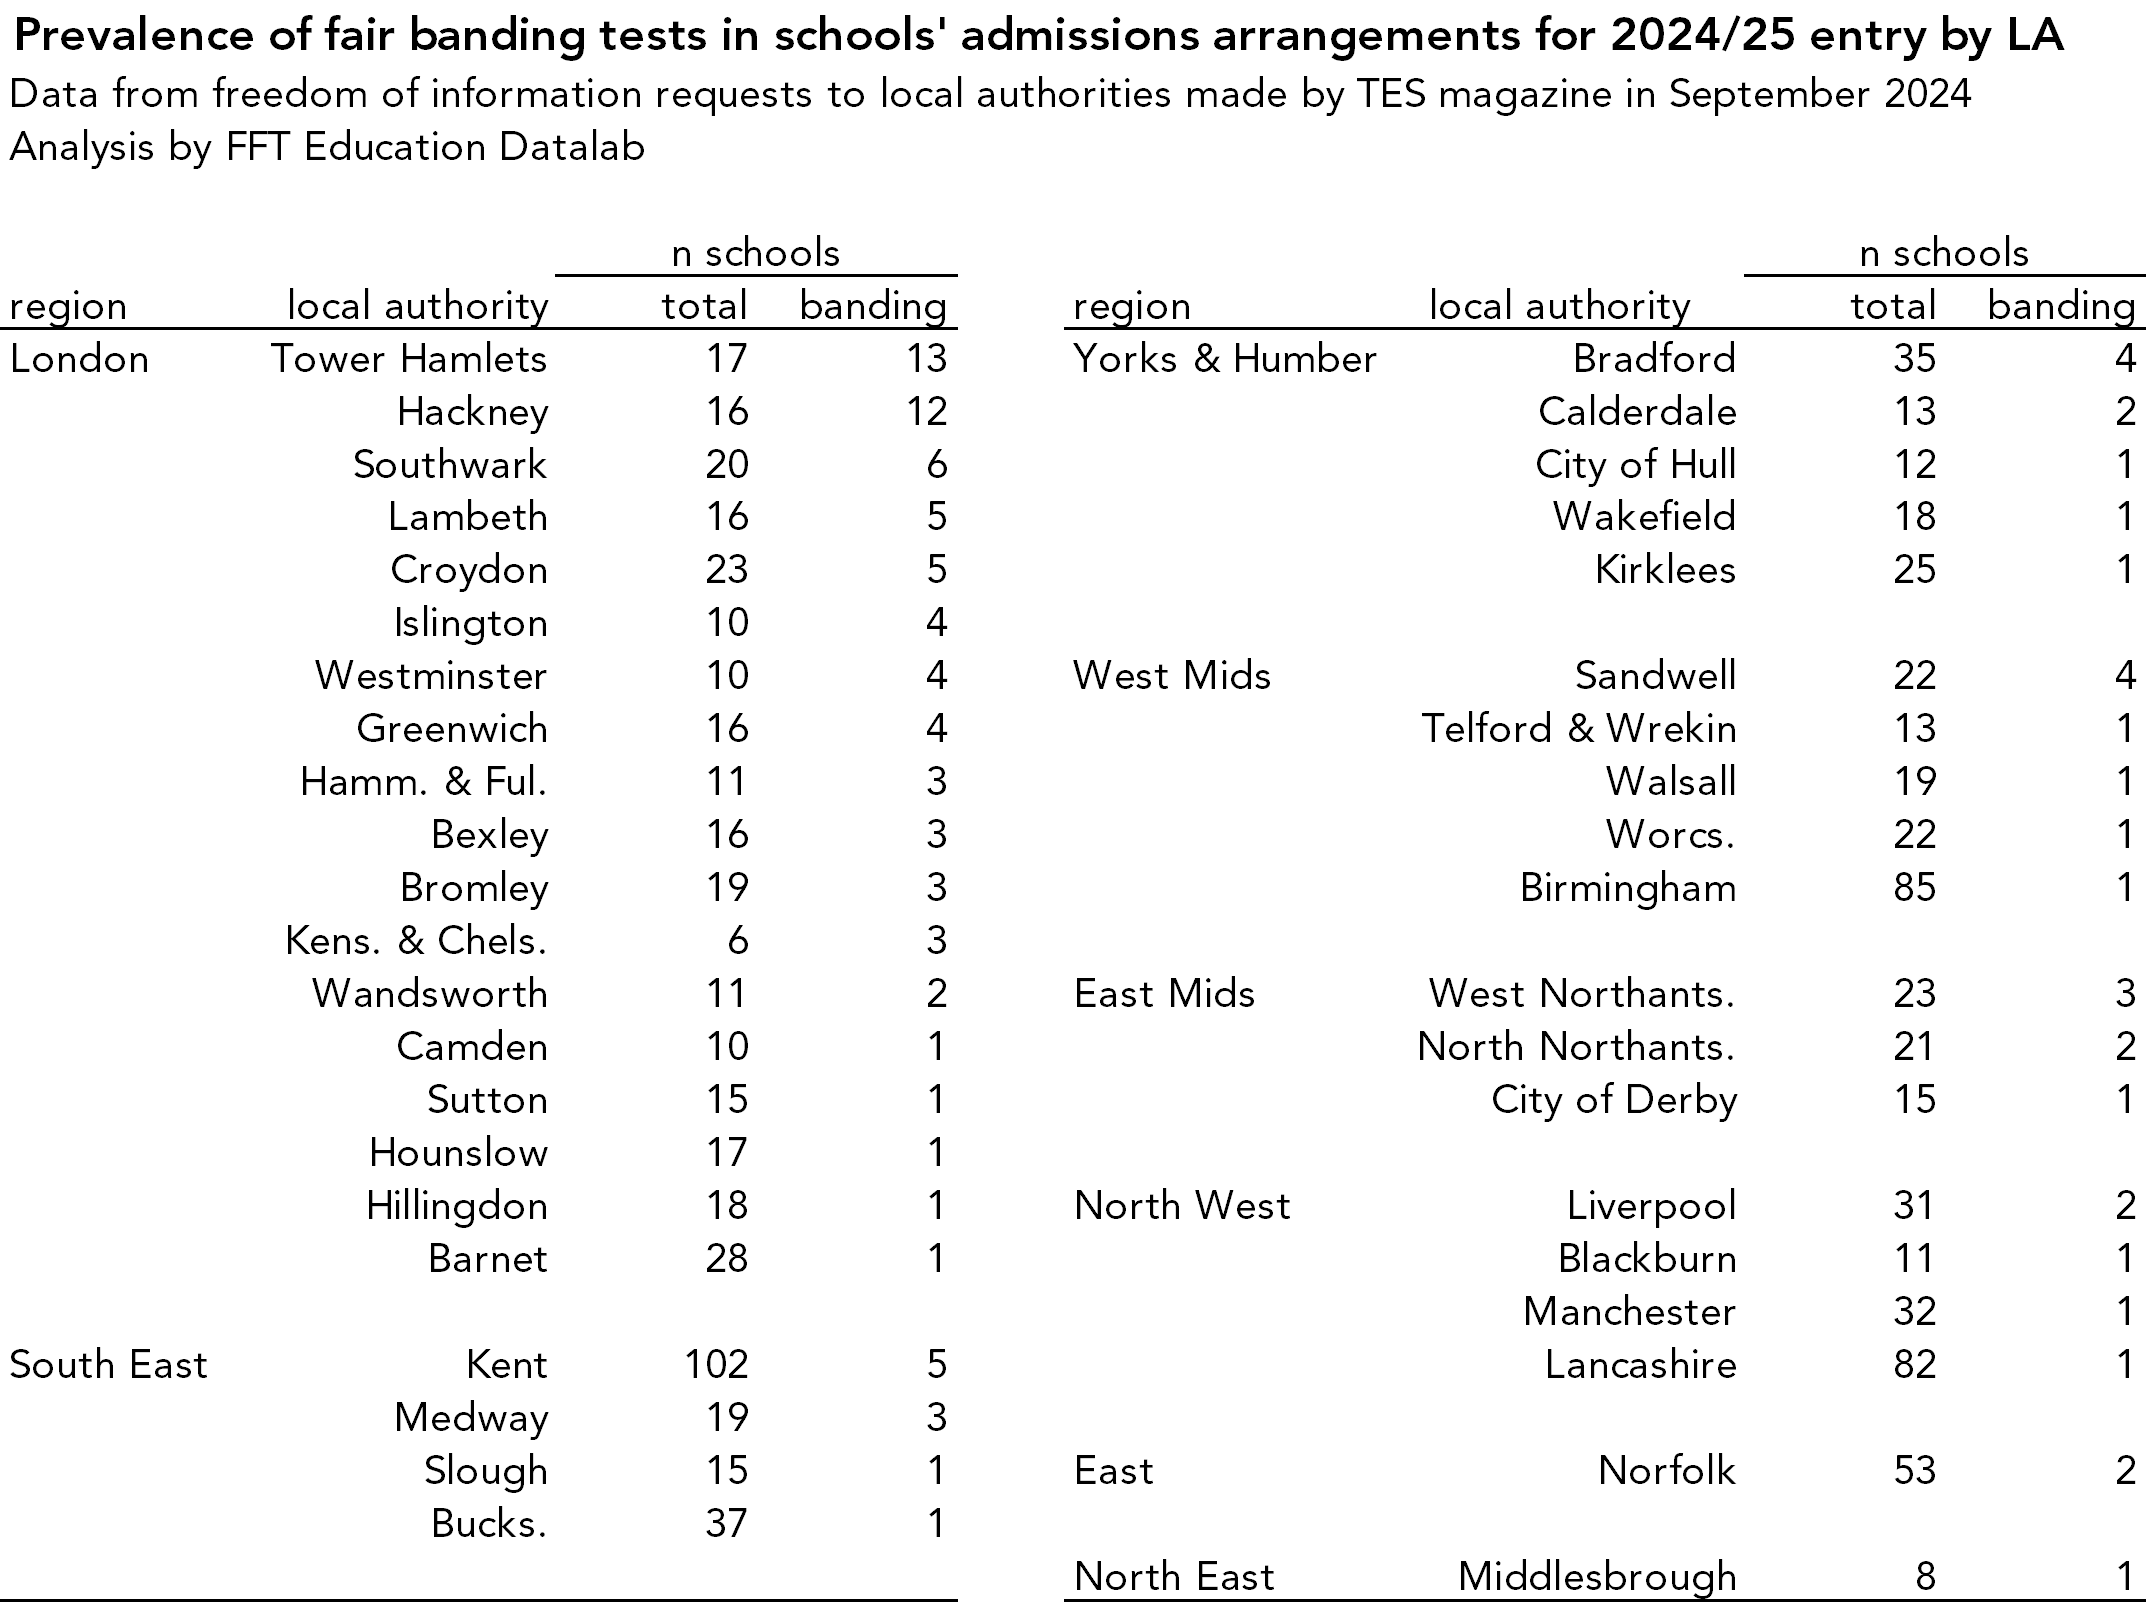
There were two local authorities where almost all schools used fair banding: Hackney (12 of 16) and Tower Hamlets (13 of 17).
Outside of London, the local authorities with the highest numbers of fair banding schools were Kent (5 of 102), Bradford (4 out of 35) and Sandwell (4 out of 22).
Pupil characteristics – all schools
Now let’s move on to the characteristics of pupils who attended these schools.
As we’re interested in the potential selection effects caused by schools running their own banding tests, and both Tower Hamlets and Hackney administer their tests centrally during primary school time, we excluded Tower Hamlets and Hackney fair banding schools from our analysis. We present a version with them included as an appendix (xlsx).
First, we compare fair banding schools with all other schools in the same local authorities.
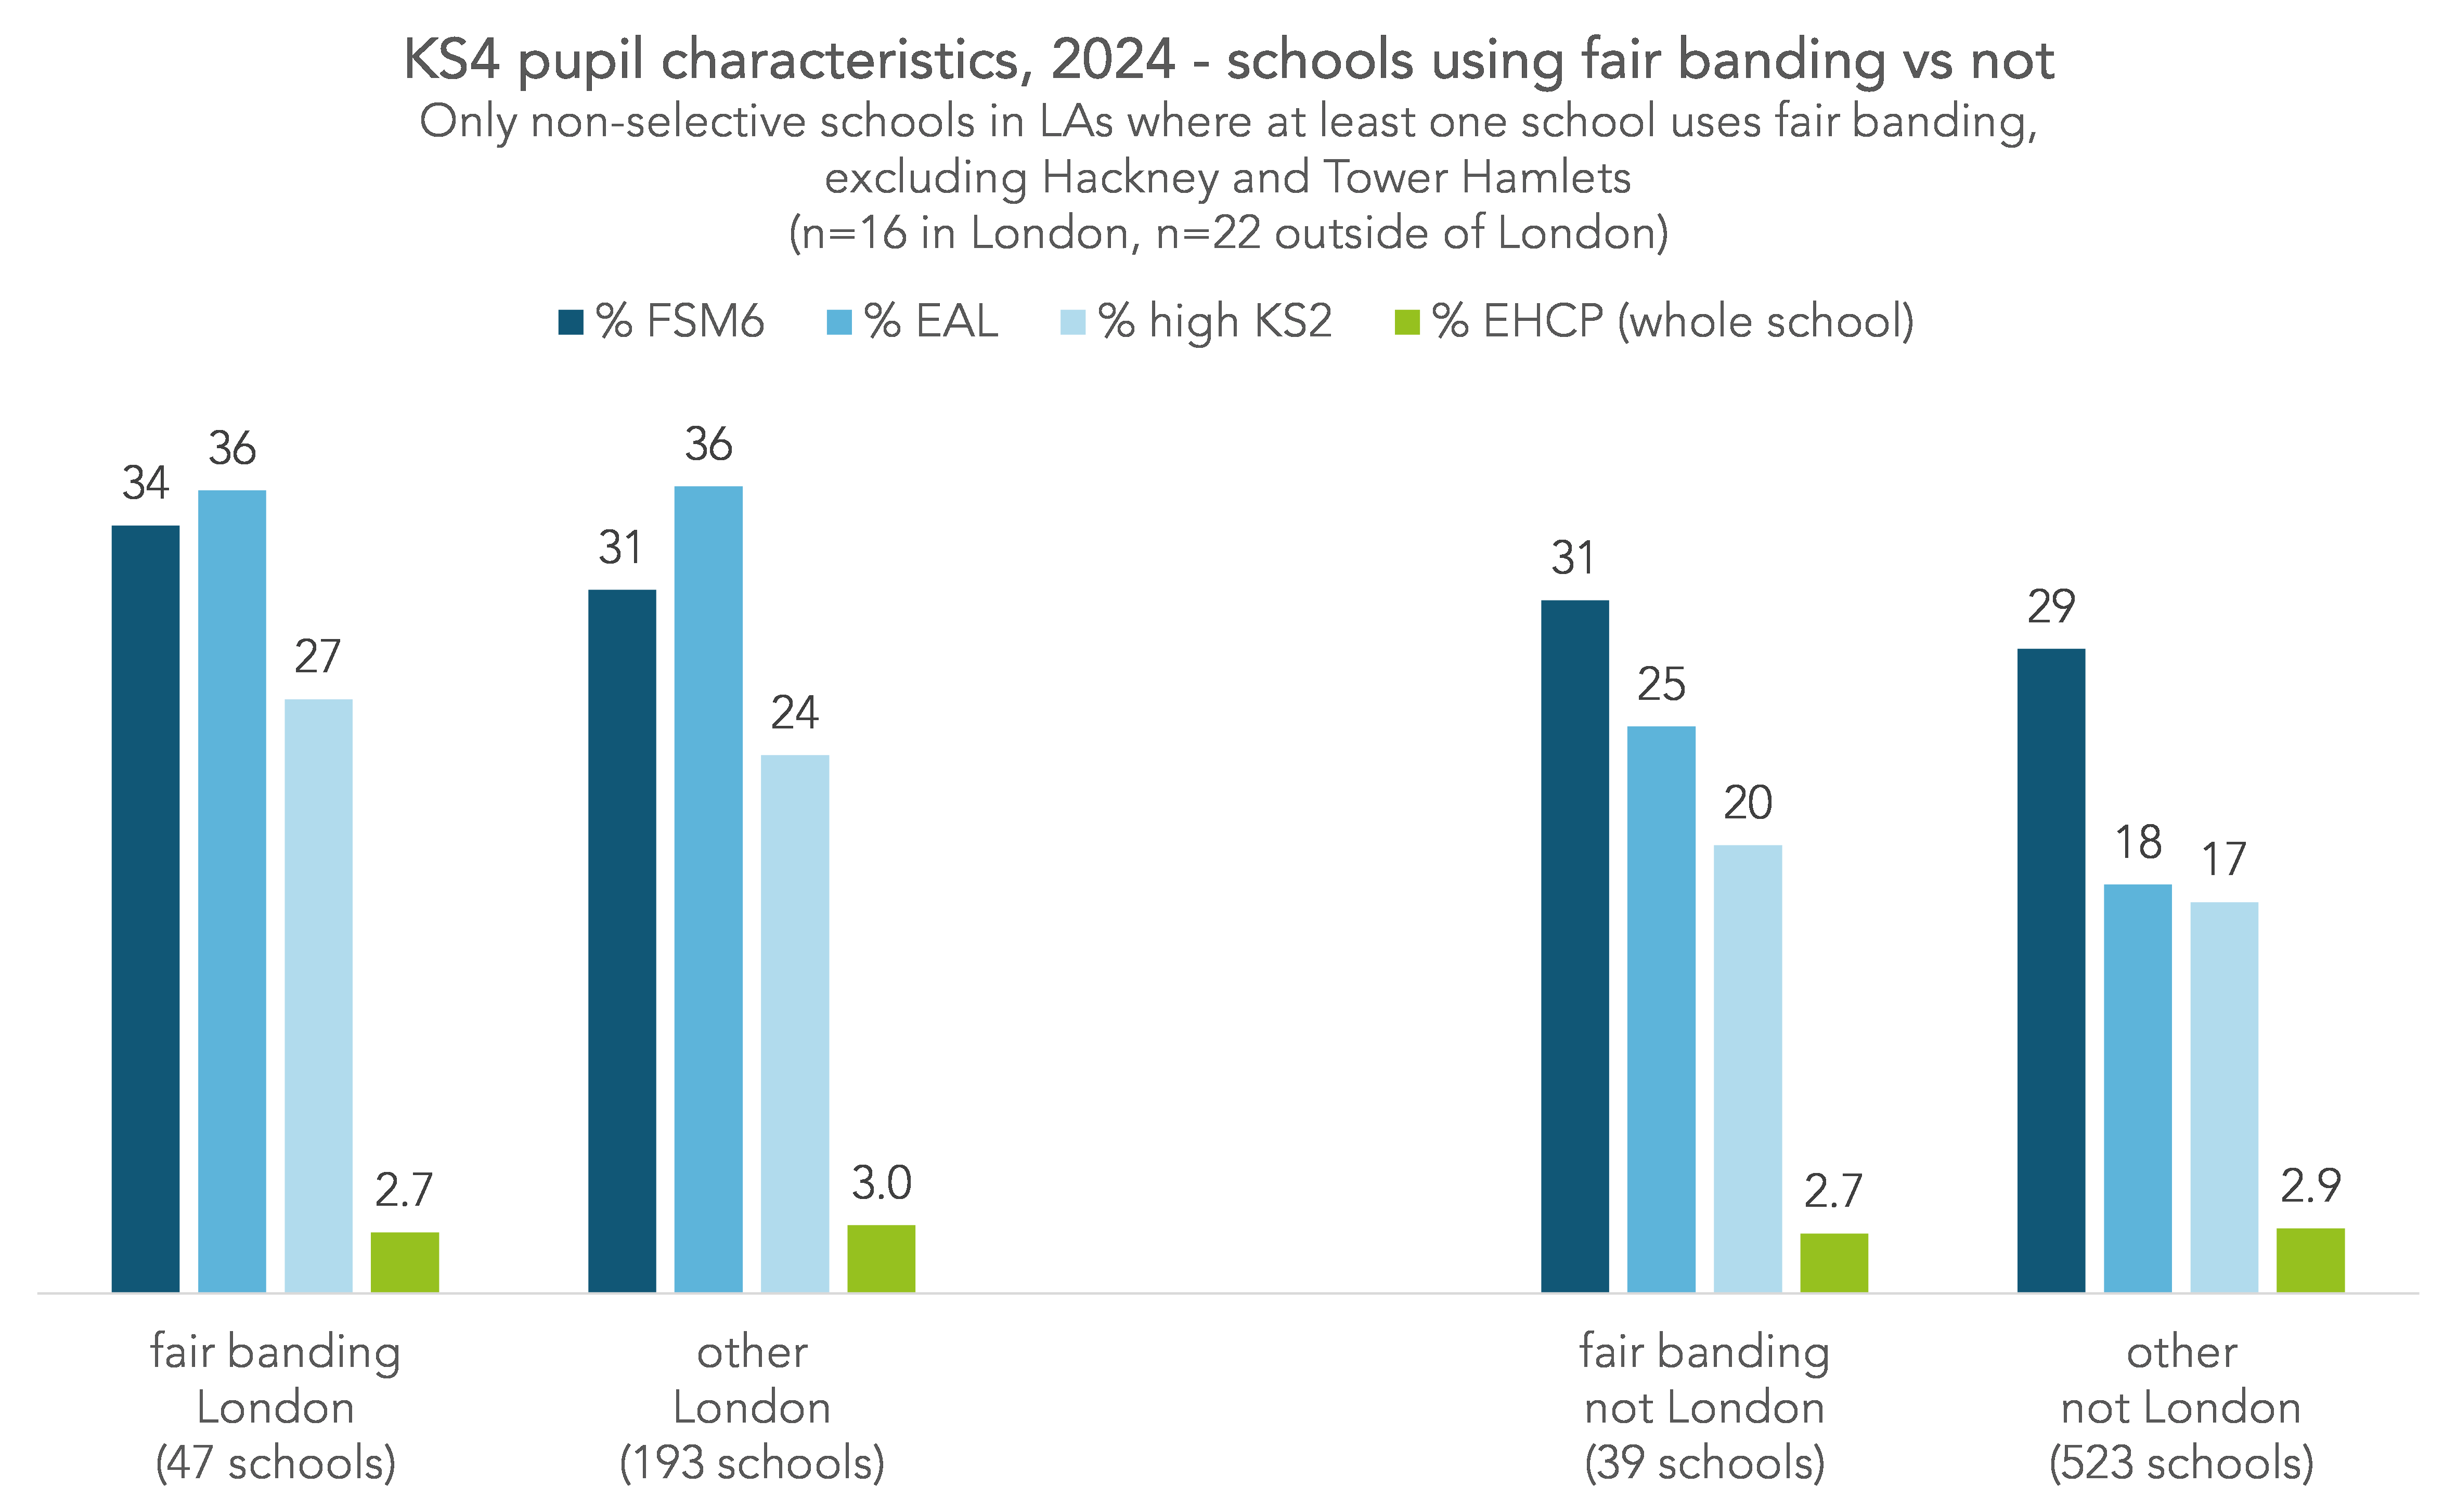
In London, fair banding schools had a slightly higher proportion of disadvantaged pupils than other schools, a similar proportion of pupils with a first language other than English (EAL), and a slightly higher proportion of pupils with high Key Stage 2 (KS2) scores. They also had a slightly lower proportion of pupils with an Education, Health and Care Plan (EHCP).
The picture outside London is similar, though fair banding schools tended to have higher proportions of pupils with EAL than other schools.
Pupil characteristics – neighbouring schools
Now we narrow down our sample of comparison schools. Instead of using all other schools in the same local authorities as a fair banding school, we just use schools which are geographically closest.
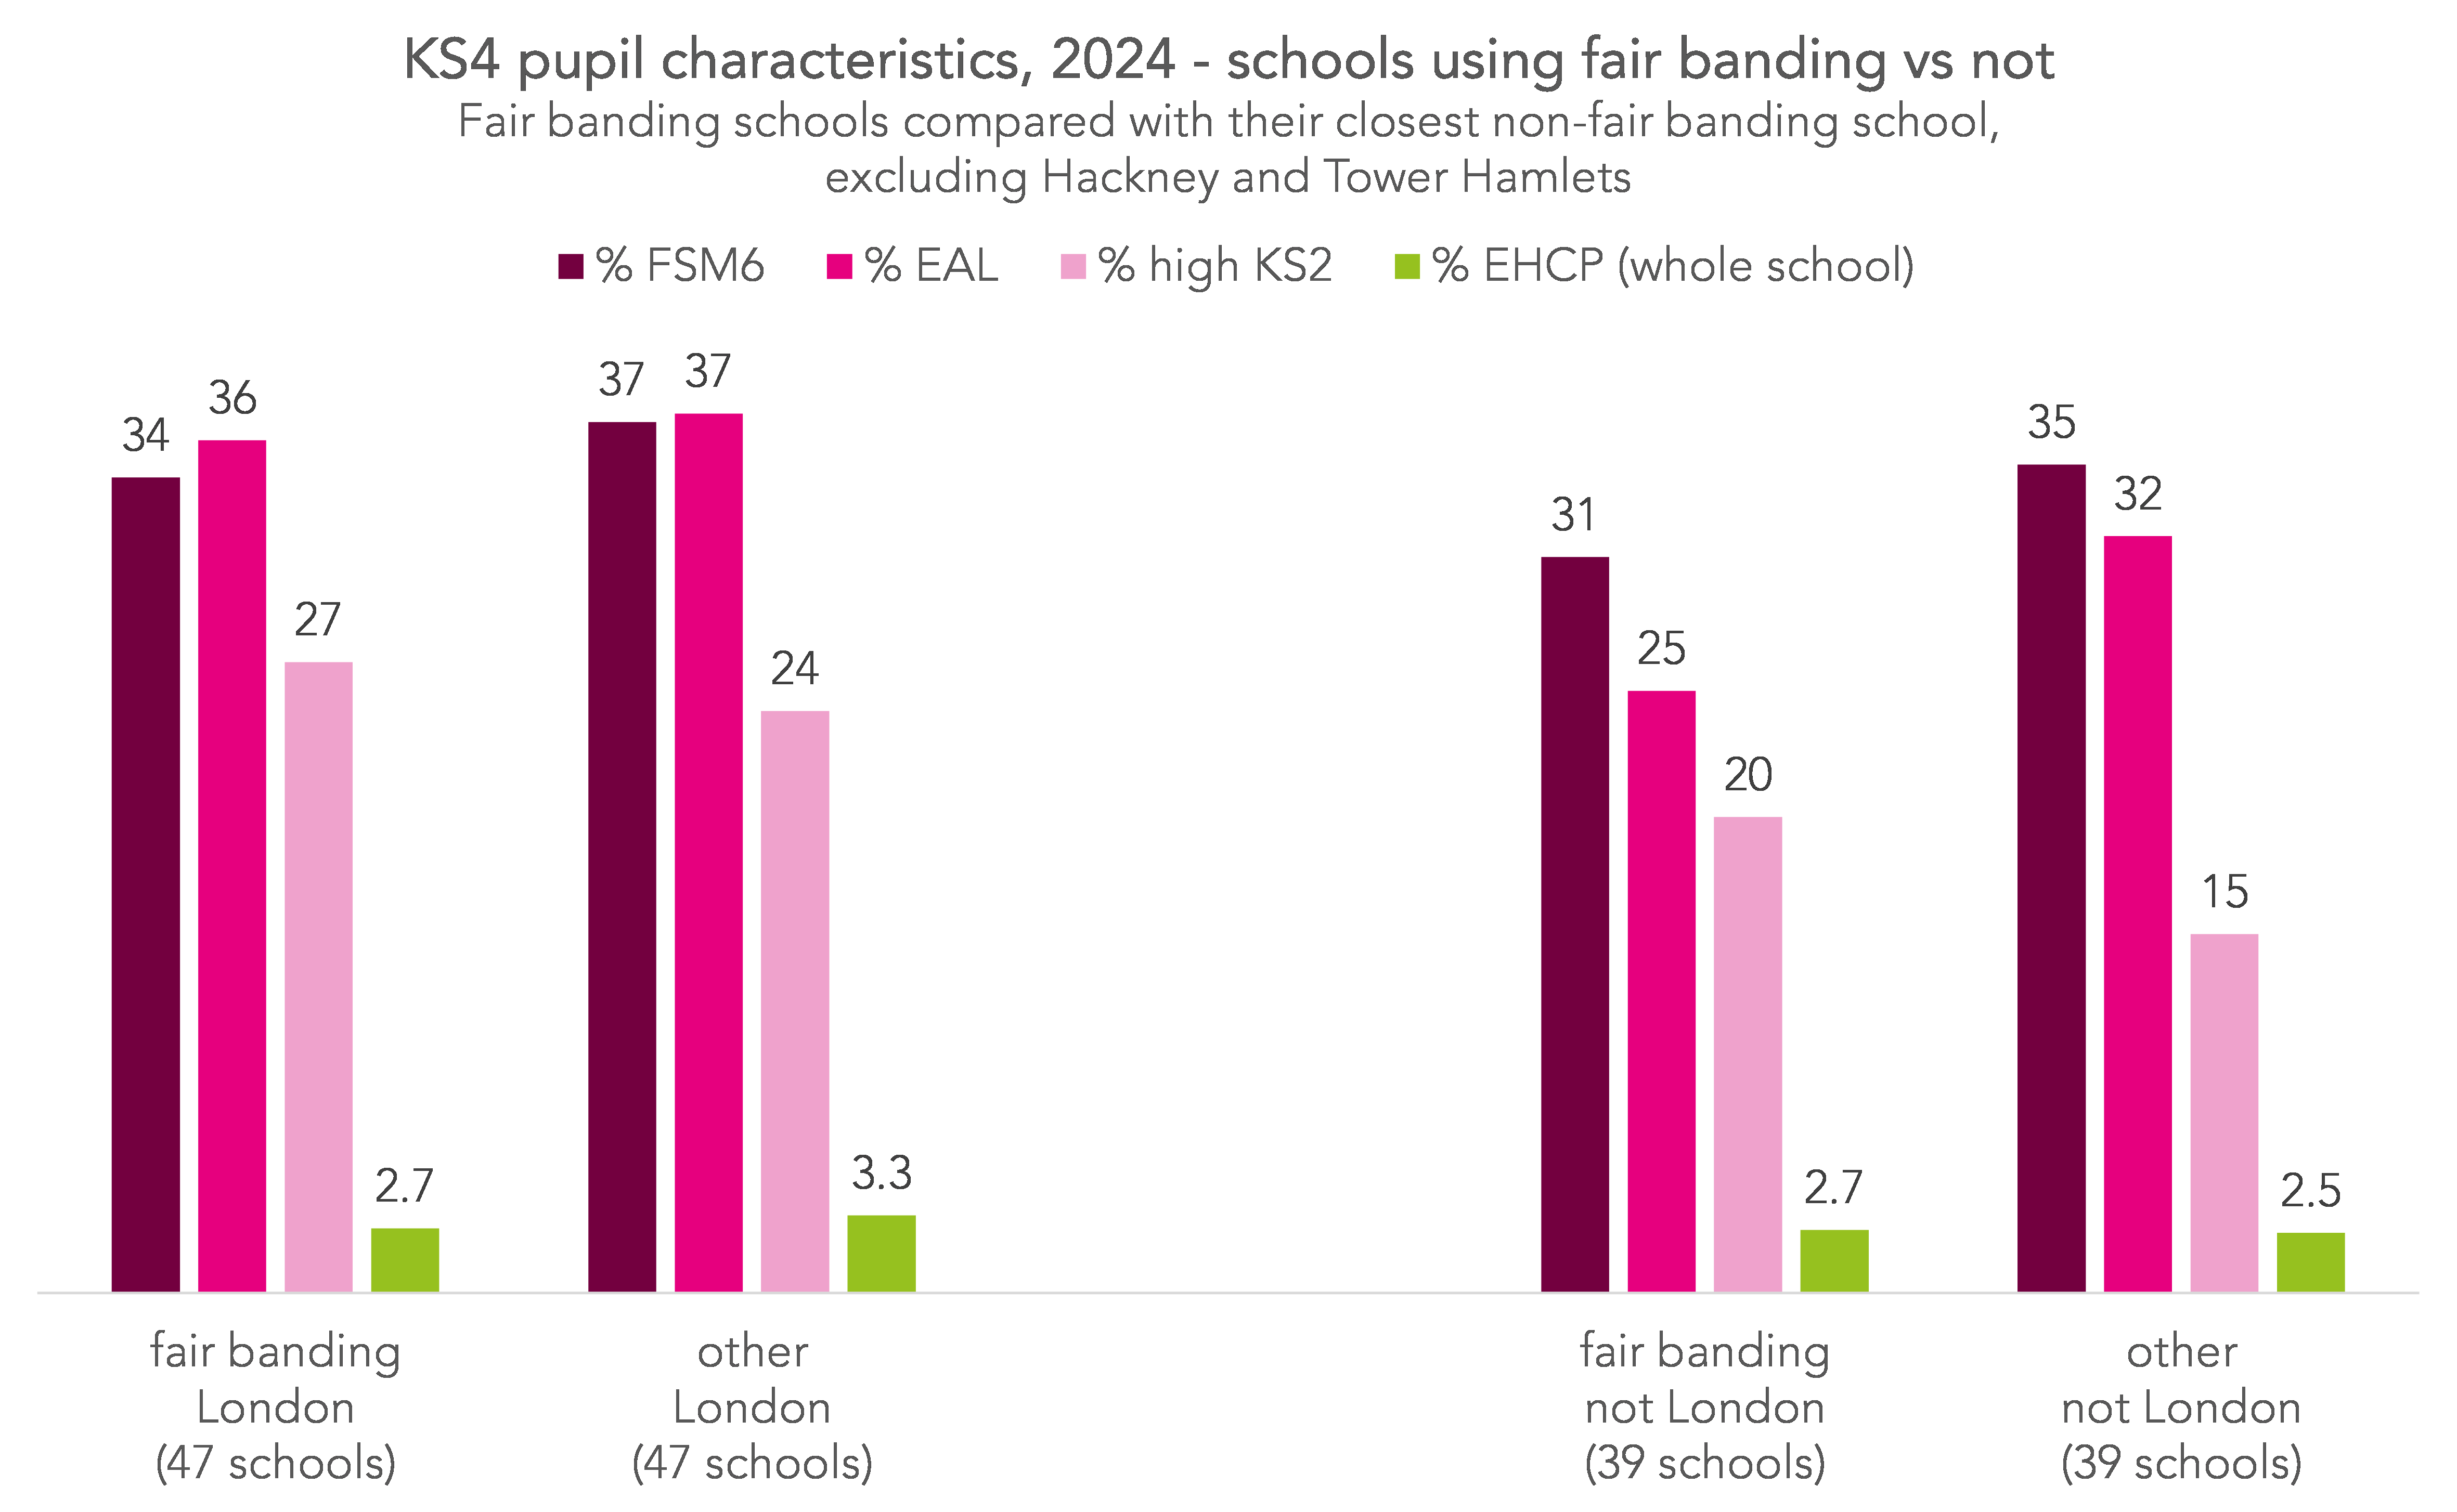
Firstly, both in London and elsewhere, there was a lower proportion of disadvantaged pupils in fair banding schools than in neighbouring schools. This is the opposite of the pattern we saw in the previous section.
Secondly, outside of London, the skew toward pupils with high prior attainment is larger.
And finally, in London schools, there were fewer pupils with EHCPs in fair banding schools than in neighbouring schools. Outside of London, fair banding schools had a slightly higher proportion of pupils with EHCPs than neighbouring schools.
Progress 8 scores
To finish, we look at the 2024 Progress 8 scores of fair banding schools compared with their neighbours.
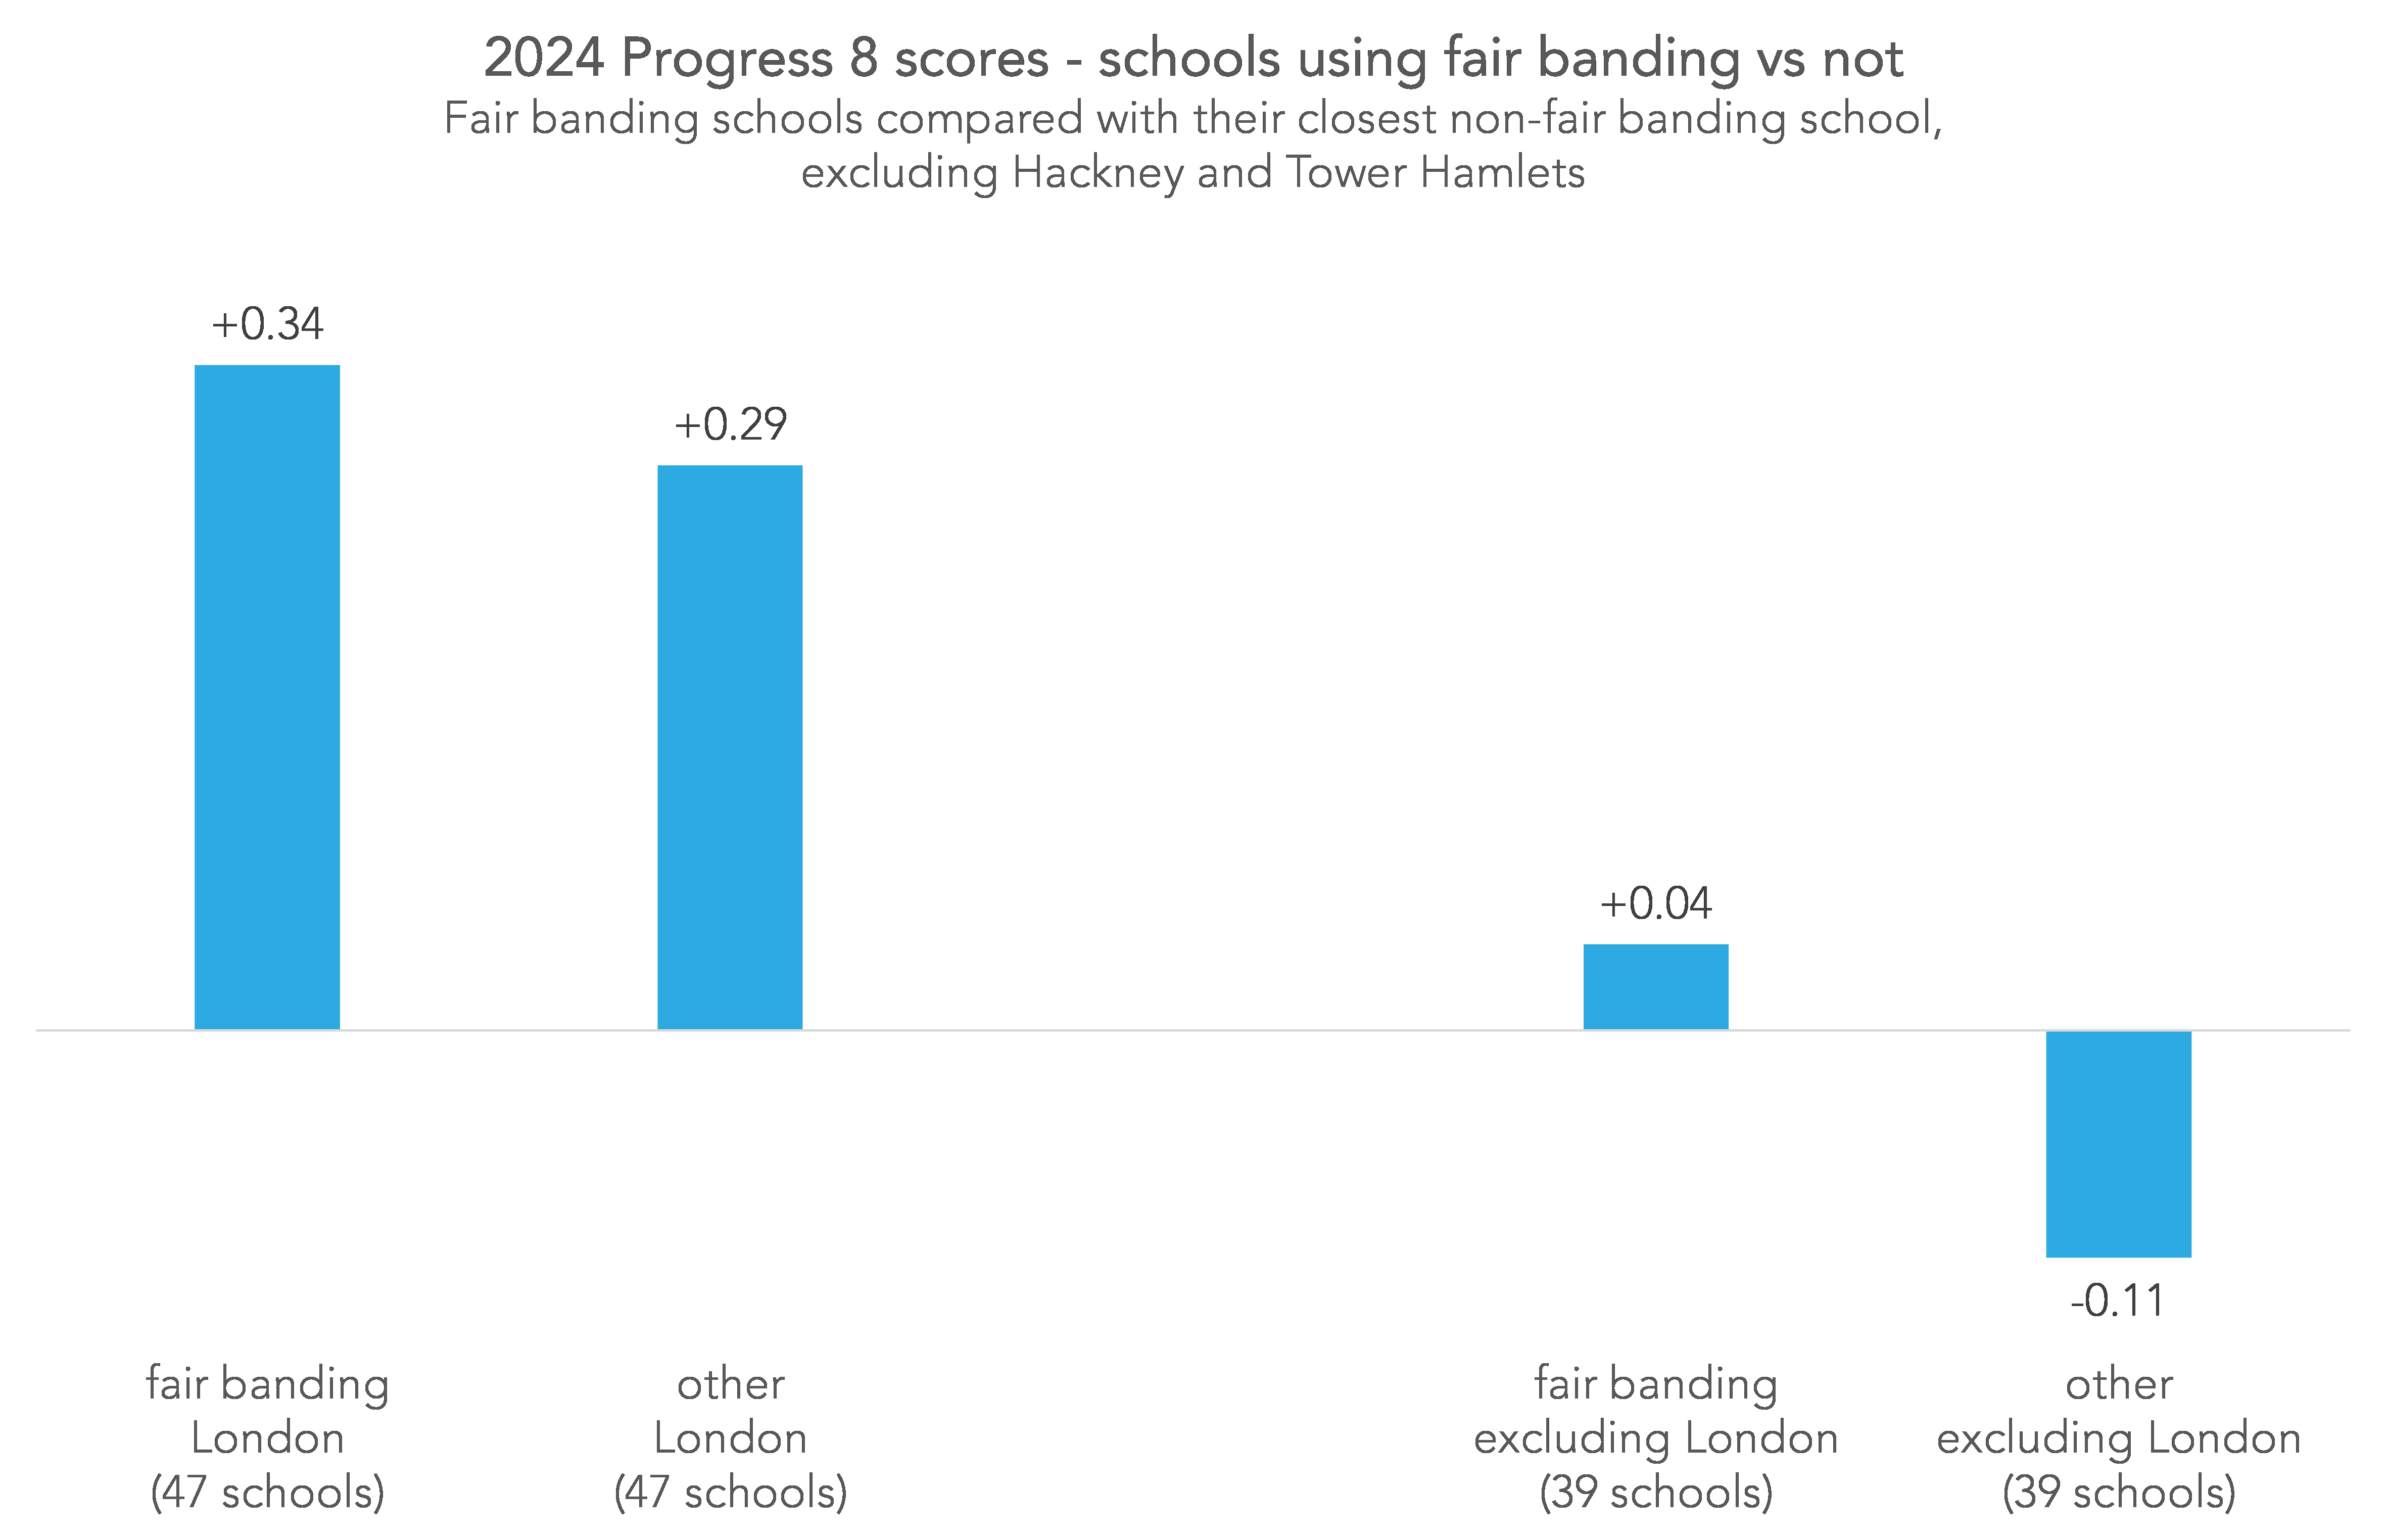
In London, fair banding schools and their neighbours both had high Progress 8 scores, on average. There was a small difference between the two groups, with the average score for fair banding schools 0.05 higher than for their neighbours (+0.34 vs +0.29).
Outside of London, fair banding schools had a Progress 8 score slightly above zero (+0.04). The difference between them and neighbouring schools was greater than in London, with fair banding schools outside of London 0.15 higher than their neighbouring schools (-0.11).
Discussion
There are a few things to think about here.
What we’ve shown is that schools which used fair banding in their 2024/25 admissions tended to have KS4 populations in 2024 with slightly lower proportions of disadvantaged pupils and higher proportions of pupils with high KS2 scores than in neighbouring schools. They also tended to achieve higher Progress 8 scores, particularly outside of London.
However, there is one major factor which we haven’t attempted to account for: how oversubscribed schools were.
In order for schools to be able to choose which pupils they make offers to, for example, by using banding, they must have received more applications than they have available places. It’s quite possible, then, that when we’re comparing a fair banding school with its nearest neighbour, we’re comparing an extremely popular school with an undersubscribed school. In this situation, we might expect the applicant pool for the former school to be from more affluent families than the latter, given that housing costs and proximity to “good” schools are often linked (pdf).
It’s possible that, given this, if these schools did not use fair banding, the gap between them and their neighbours in terms of the proportion of disadvantaged pupils and pupils with high KS2 scores, might be even wider.
We should also bear in mind that not all schools which use fair banding tests do so aiming for a nationally representative distribution of abilities. Some aim for a distribution which is representative of their applicant pool. If the applicant pool skews towards higher ability and low disadvantage, then so may the intake.
Finally, there is a situation where even aiming for a nationally representative distribution of abilities could lead to an intake with higher prior attainment than neighbouring schools: when it happens in an area where KS2 attainment is low. A school in such a situation would end up admitting a higher proportion of their local high ability applicants, and a lower proportion of their local low ability applicants.
Summing up
In summary then, we’ve shown that banding is associated with lower rates of disadvantage and higher prior attainment compared to neighbouring schools.
However, we have not shown that the tests themselves introduce an extra hurdle at which vulnerable pupils are more likely to fall. Our findings can also be explained by fair banding schools being more likely to be oversubscribed, or by the choices schools make about how they use the results of the tests.
Most likely, the answer is a combination of factors. To unpick them would require a much more detailed study.
Want to stay up-to-date with the latest research from FFT Education Datalab? Sign up to Datalab’s mailing list to get notifications about new blogposts, or to receive the team’s half-termly newsletter.
[1] “Finally, we are making the operation of banding arrangements clearer by requiring schools to set out more details about how their arrangements work in practice and tightening the rules that ensure banding produces representative intakes. We will consult on all changes to the School Admissions Code, including these changes, later in the year.”
[2] This would go against the admissions code of practice, which does not allow schools to select their pupils based on ability (unless they are designated grammar schools, or were already partially selective in 1997/98)
[3] We assigned each fair banding school a unique nearest neighbour school, measuring distance as the crow flies.
Leave A Comment