




Results for A-Levels, T-Levels and other Level 3 qualifications are out today. And we’ve crunched the numbers to bring you all the headlines from the data published today.
That data comes from the Joint Council for Qualifications and Ofqual and tends to mostly focus on A-Levels. Because of that, this post will also focus largely on A-Levels, but it’s worth remembering that only around 40% of young people take this route. A further 10% or so take a vocational route to Level 3, for example, via Applied Generals or T-levels. And lots of post-16 students are taking qualifications at Level 2 and below, and won’t receive their results until next week.
In a couple of weeks, we’ll also be running a results day webinar where we’ll talk you through all of our results day analysis along with exclusive insights from FFT’s Early Results Service. It’s on 10 September and is completely free. Sign up now to book your place.
You might also want to visit our dedicated results microsite for more detail on individual A-level subjects.
Grades are up very, very slightly this year
Since 2023, top grades have been increasing slightly each year. But this year, there’s been virtually no change: in 2025, 28.2% of entries in England were graded A* or A, and this year it’s 28.3%.
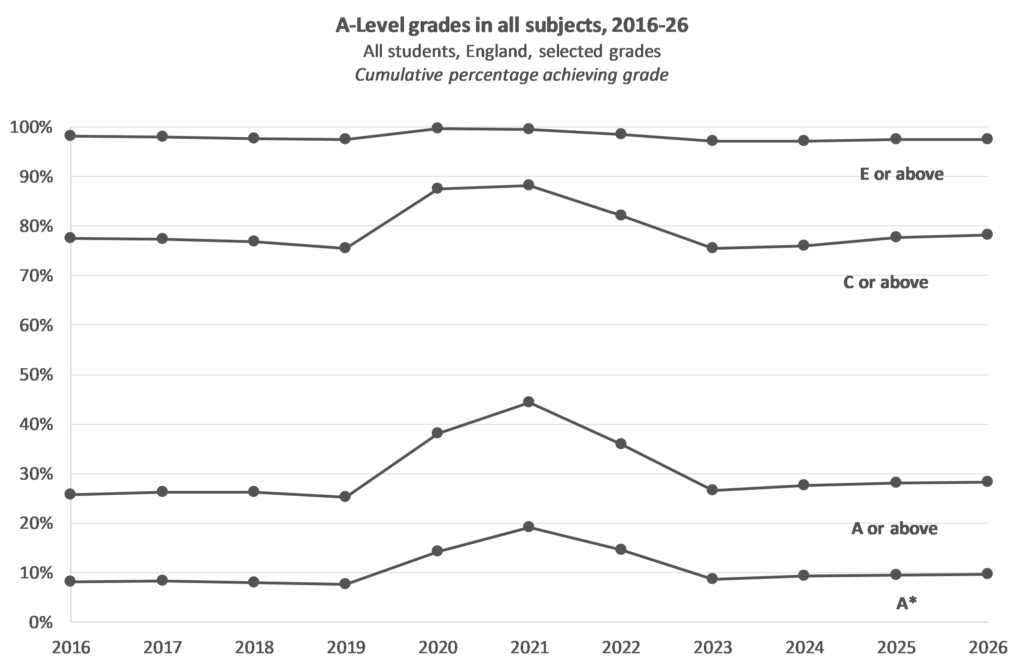
The proportion of entries graded C or above has increased slightly, from 77.7% to 78.1%. Grades at both A*-A and A-C remain above pre-pandemic levels by around 3 percentage points.
Looking at Wales and Northern Ireland, we see a similar picture.
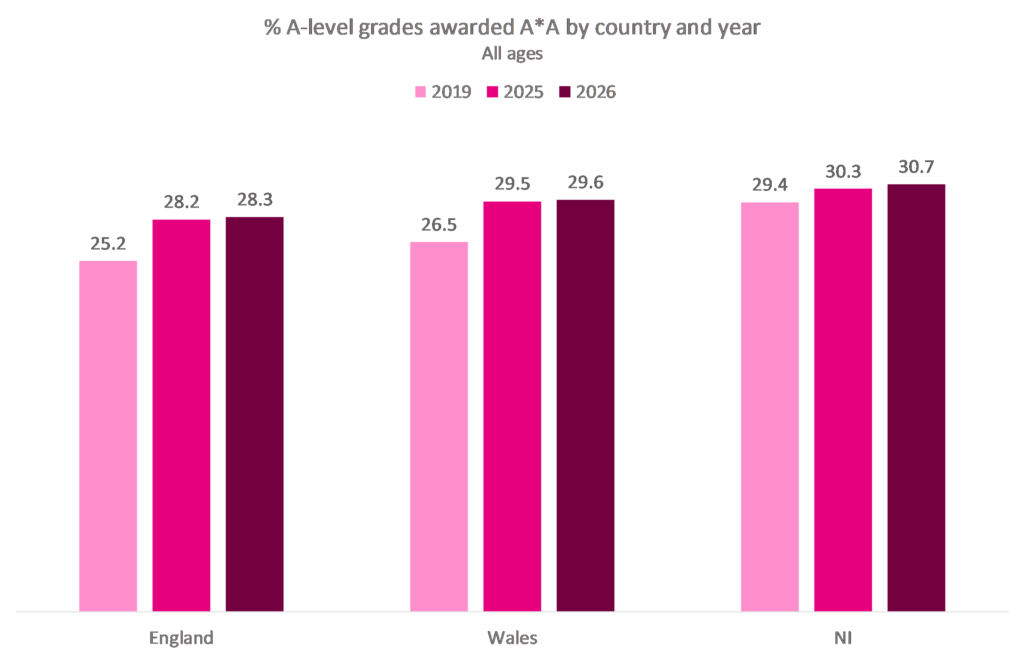
In both Wales and England, top grades have remained broadly stable, up by just 0.1 percentage points. In Northern Ireland, there was a larger increase, but still well under 1 percentage point.
Results in most subjects remain stable
At subject level, there is also very little change in grading.
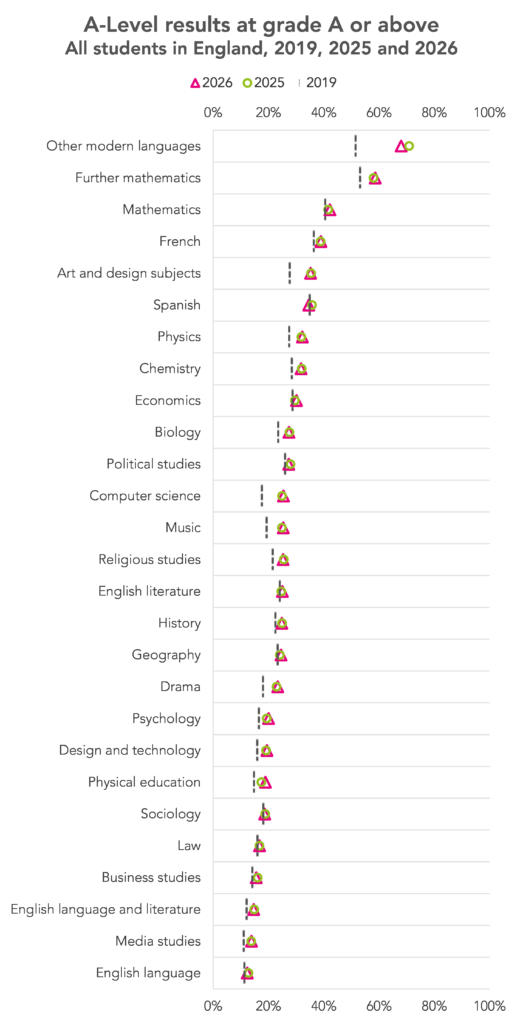
Across virtually all subjects, grades are above pre-pandemic levels.
Subjects with the largest changes since last year include other modern languages, Spanish and physical education. Both other modern languages and Spanish saw a fall in top grades, while physical education saw an increase.
Other modern languages remains the subject with the highest proportion of top grades, with 67.9% of entries receiving a grade of A*-A. It is made up of all modern languages except French, German, Irish, Spanish and Welsh, and includes community languages like Arabic, Chinese, Italian, Polish, and Urdu, which are often taken by students who speak the language at home.
At A*-C, we see a slightly different picture.
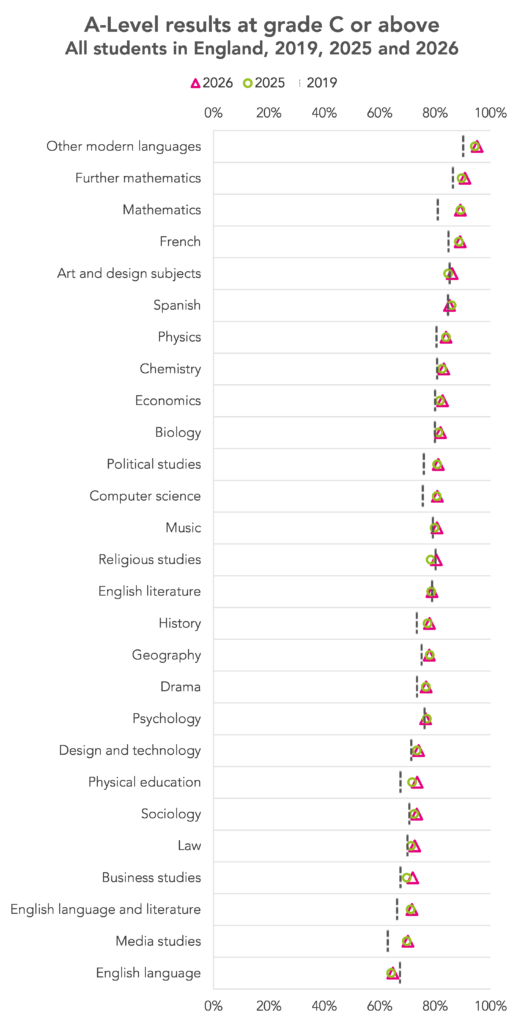
Here the subjects with the largest changes since last year are Spanish, physical education and media studies. As at A*-A, Spanish saw a fall in the proportion achieving these grades while physical education saw an increase. Media studies saw an increase, while at A*-A there was virtually no change. Unlike at A*-A, other modern languages entries graded at A*-C has increased slightly since last year.
Regional differences in grading persist
Mirroring the national picture, there’s been little change in the percentage of A*-A grades awarded by region.
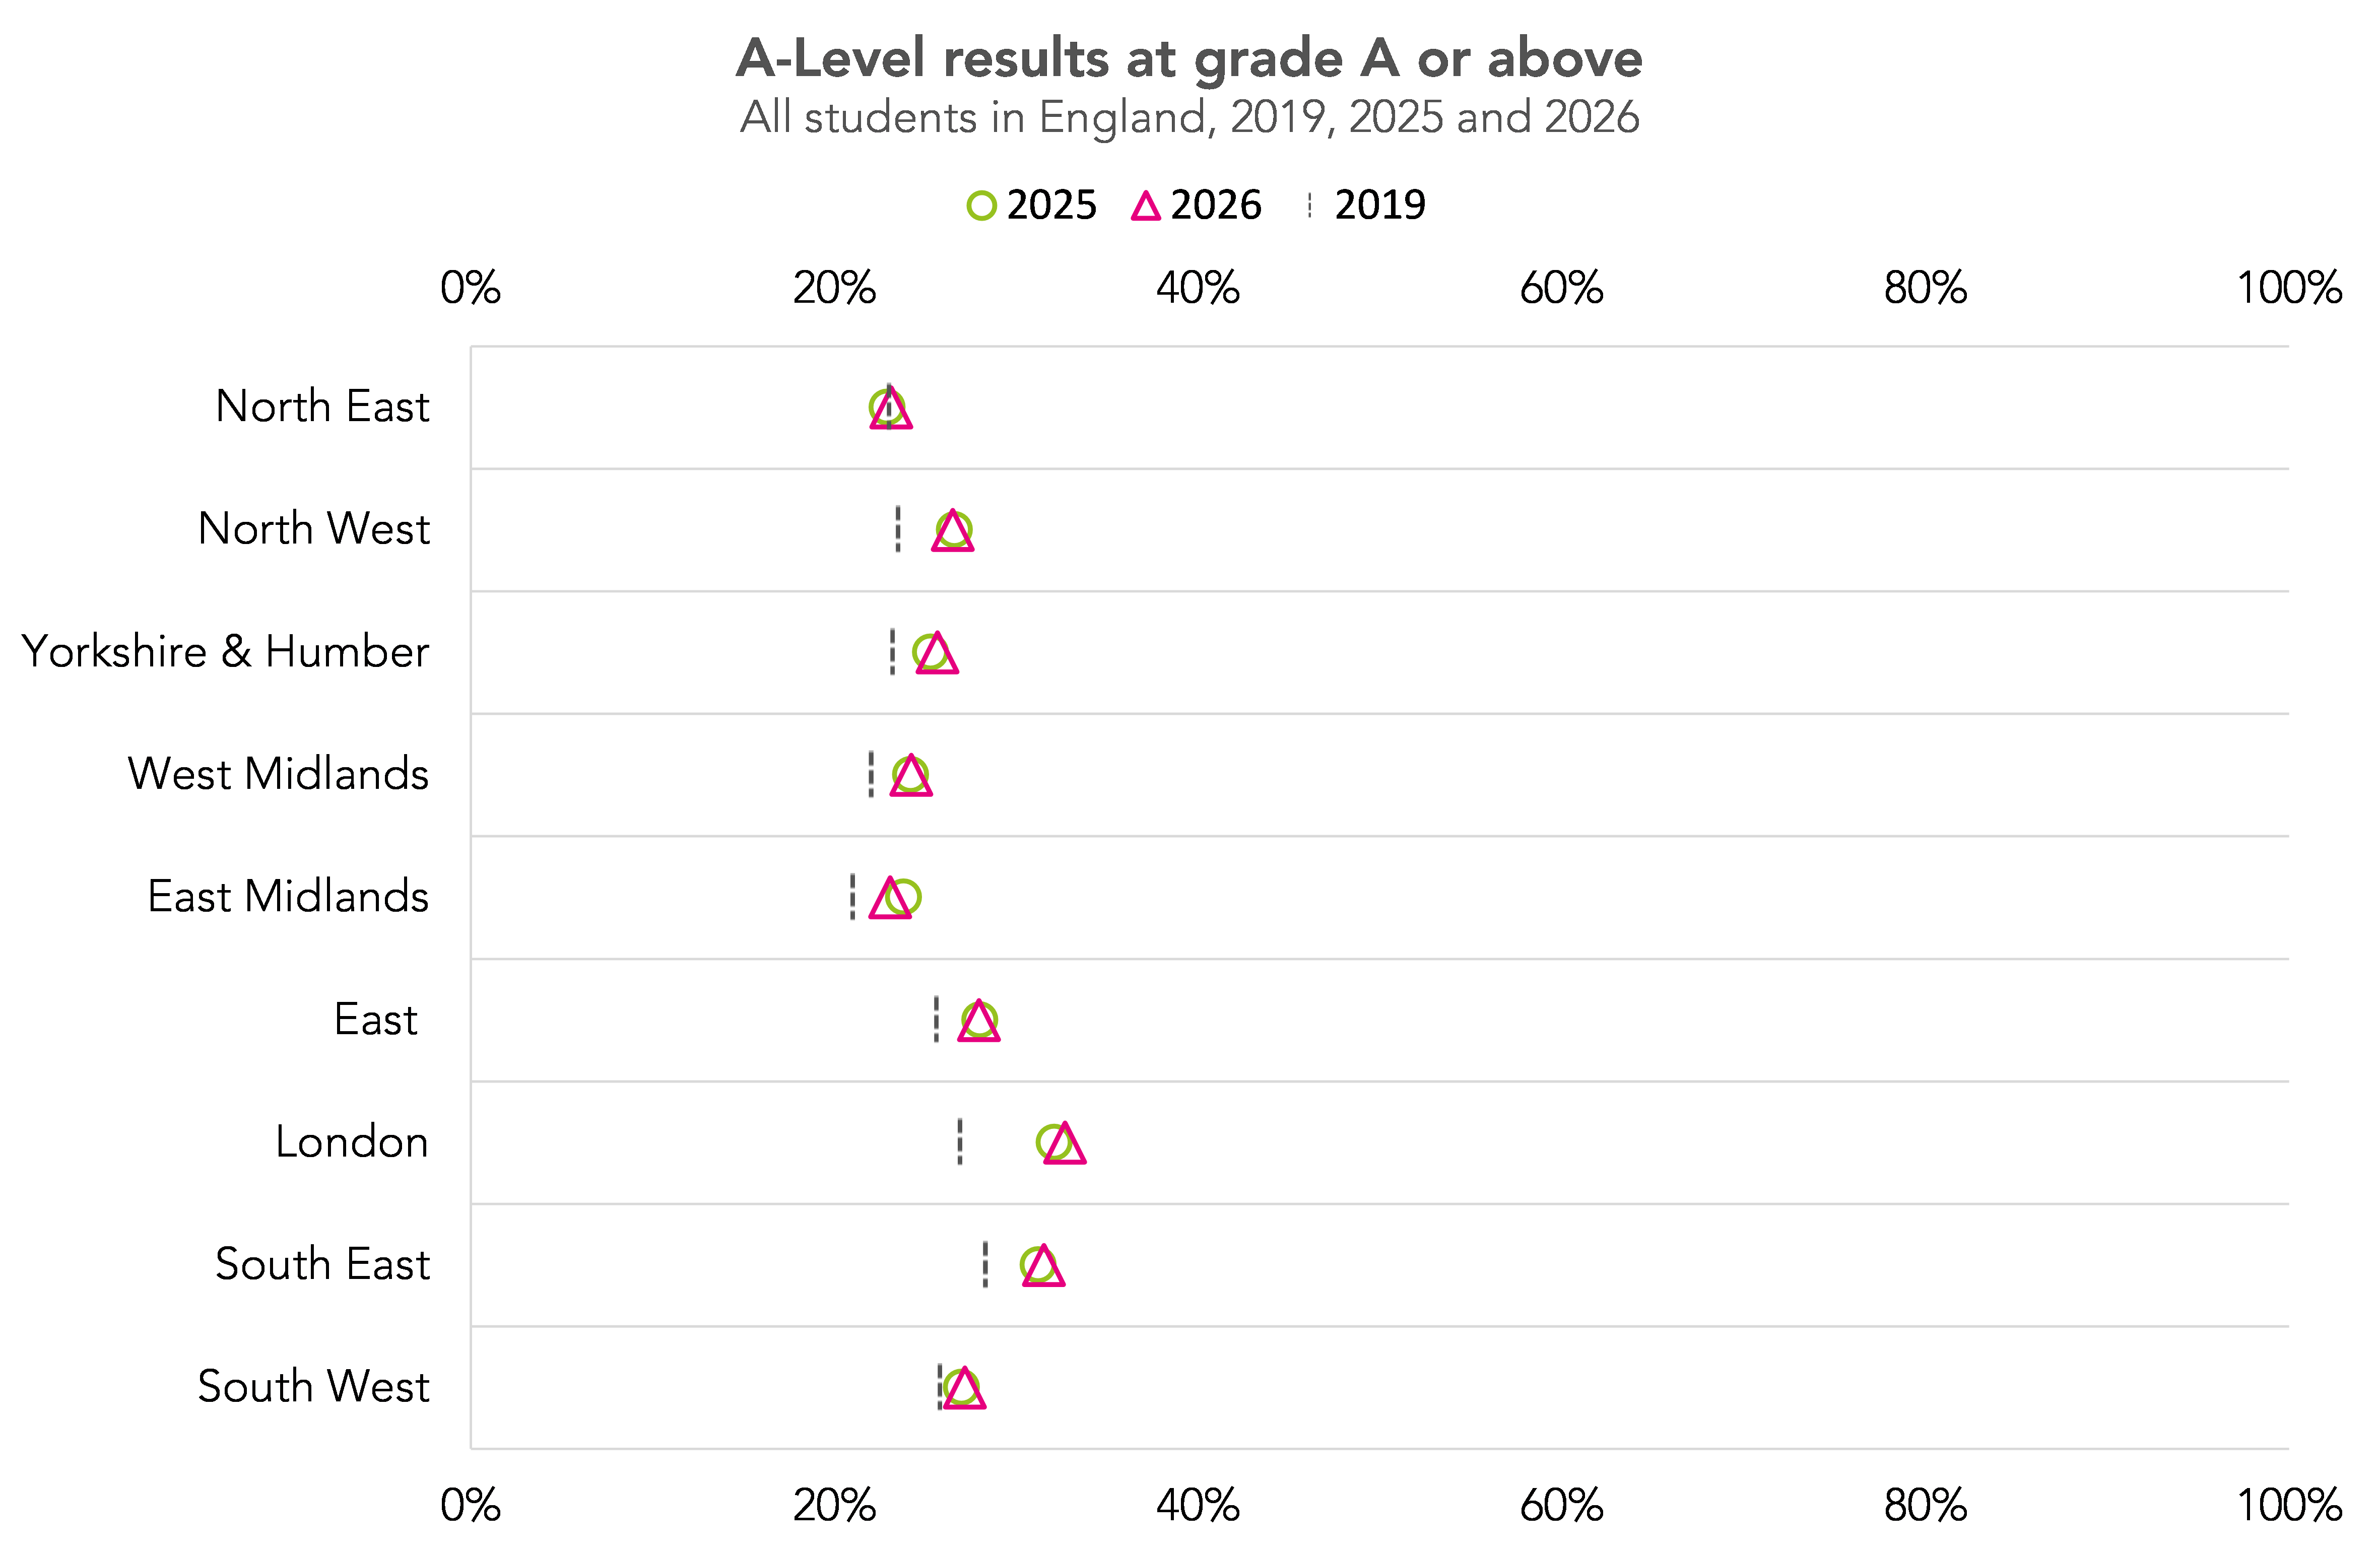
Grades in London and the South East remain higher than other areas, with 32.7% of entries in London and 31.5% in the South East receiving an A*-A grade. This compares to 23.1% in both the North East and the East Midlands.
Although this gap hasn’t grown much since last year, it’s much wider than it was pre-pandemic. Then, 26.9% of entries in London and 28.3% in the South East received an A*-A grade, compared with 23.0% in the North East and 21.0% in the East Midlands.
The North East is also the only region where the percentage of entries receiving an A*-A grade has not increased compared with 2019.
T-level retention has improved
Almost 20 thousand T-level results were awarded this year, an increase of 65% on last year, as the rollout of these qualifications continues. By way of comparison, this number is similar to the number of entrants to A-level further maths.
The proportion of students “retained and assessed”, i.e. the proportion of starters who completed their T-level is also up slightly this year, from 74% to 77% (for all students, for 16-year-old starters the figures are 76% to 80%).
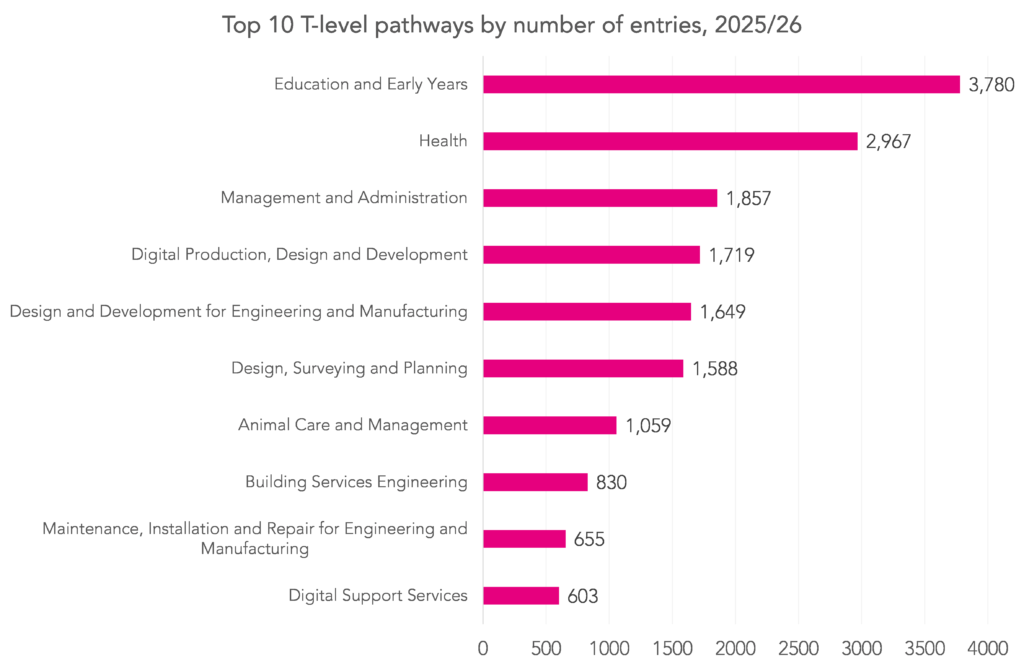
This covers 21 separate “pathways”, three of which are awarding results for the first time this year (animal care and management, craft and design, and media, broadcast and production). We show the number of entries for the top ten most popular pathways, below:
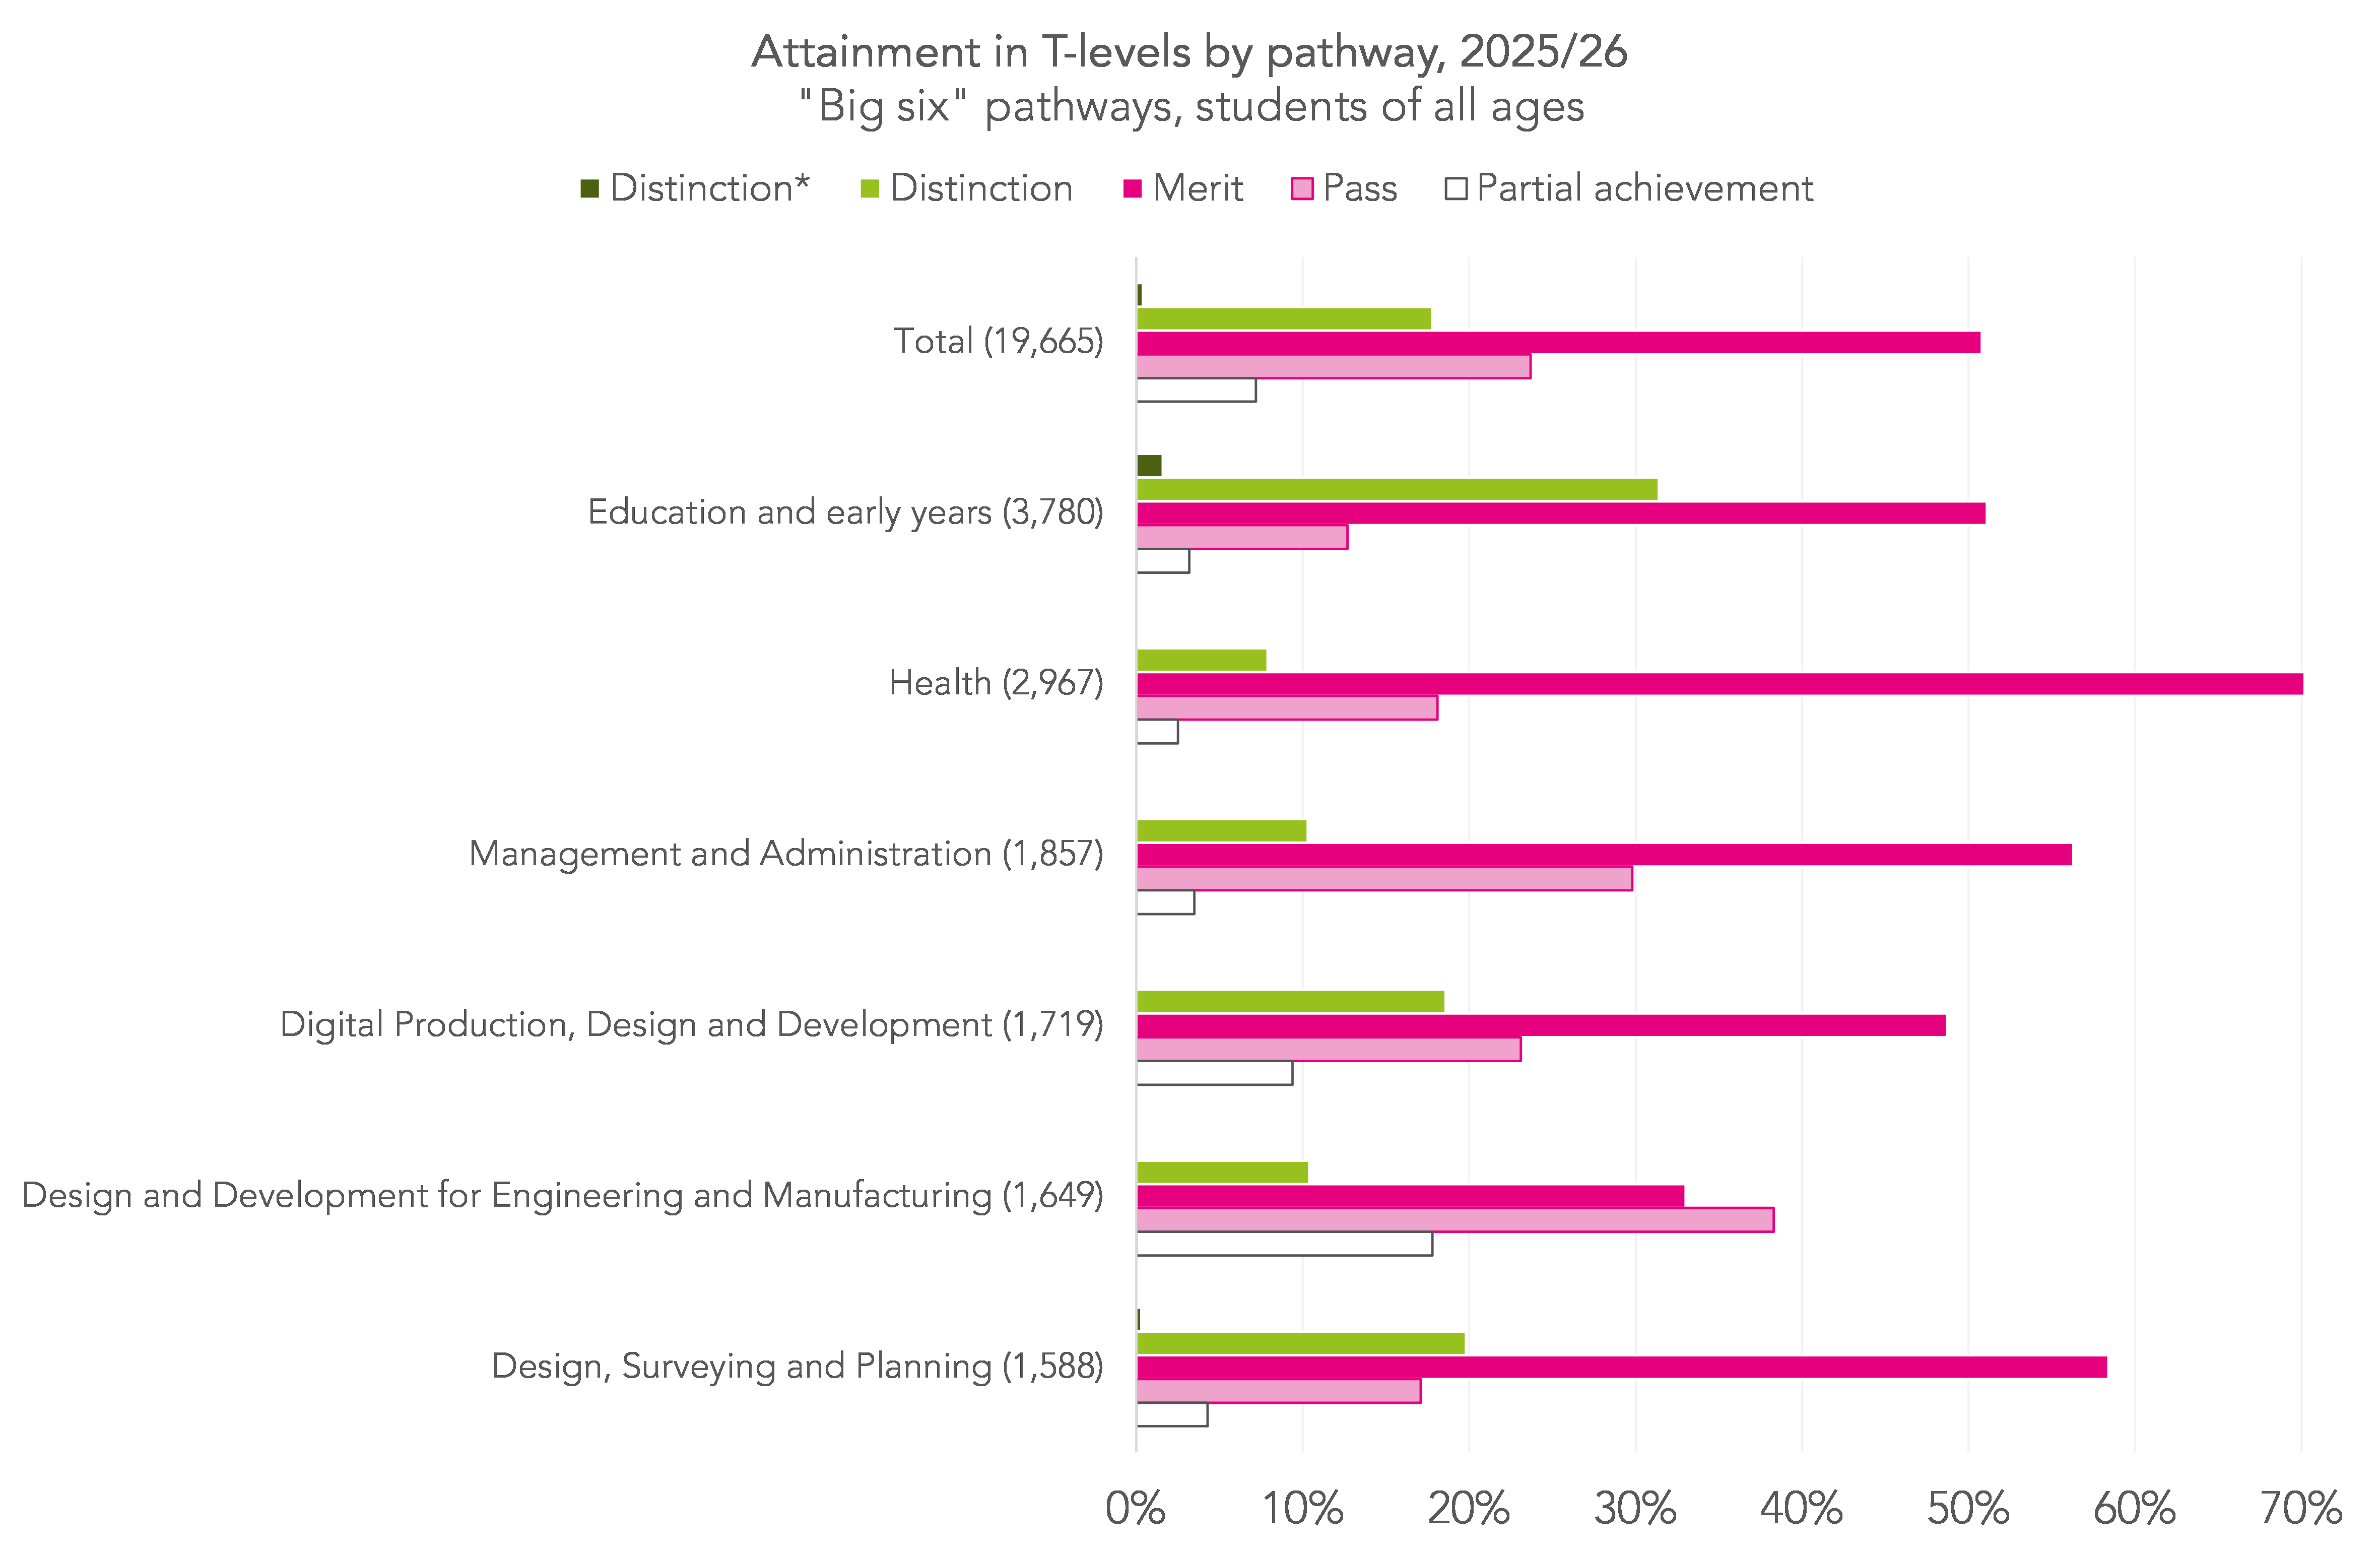
Overall, 0.4% of T-levels were awarded the highest grade, a Distinction*, 17.8% a Distinction, 50.8% a Merit, and 23.7% a Pass. The remainder consists of 7.2% which were achieved partially, having completed the industrial placement but passed only one of the core or occupational specialisms, and 0.1% unclassified.
Attainment rates varied by pathway. For example, in education and early years, the largest pathway by entries, 33.0% achieved at Distinction or better, whereas in management and administration, only 10.3% did. Rates of partial achievement also varied by pathway: in health, 2.5% of T-levels were achieved partially, while in design and development for engineering and manufacturing, 17.8% were.
Are there regional disparities in T-level take-up?
The Department for Education has published a breakdown of T-level results by region.
Although useful, it does not give us a sense of the number of pupils in each region. We can see that more students in London achieved a T-level (1,619) than in the North East (1,474). But that ignores the fact that there tend to be around 3 times as many students in London than the North East.
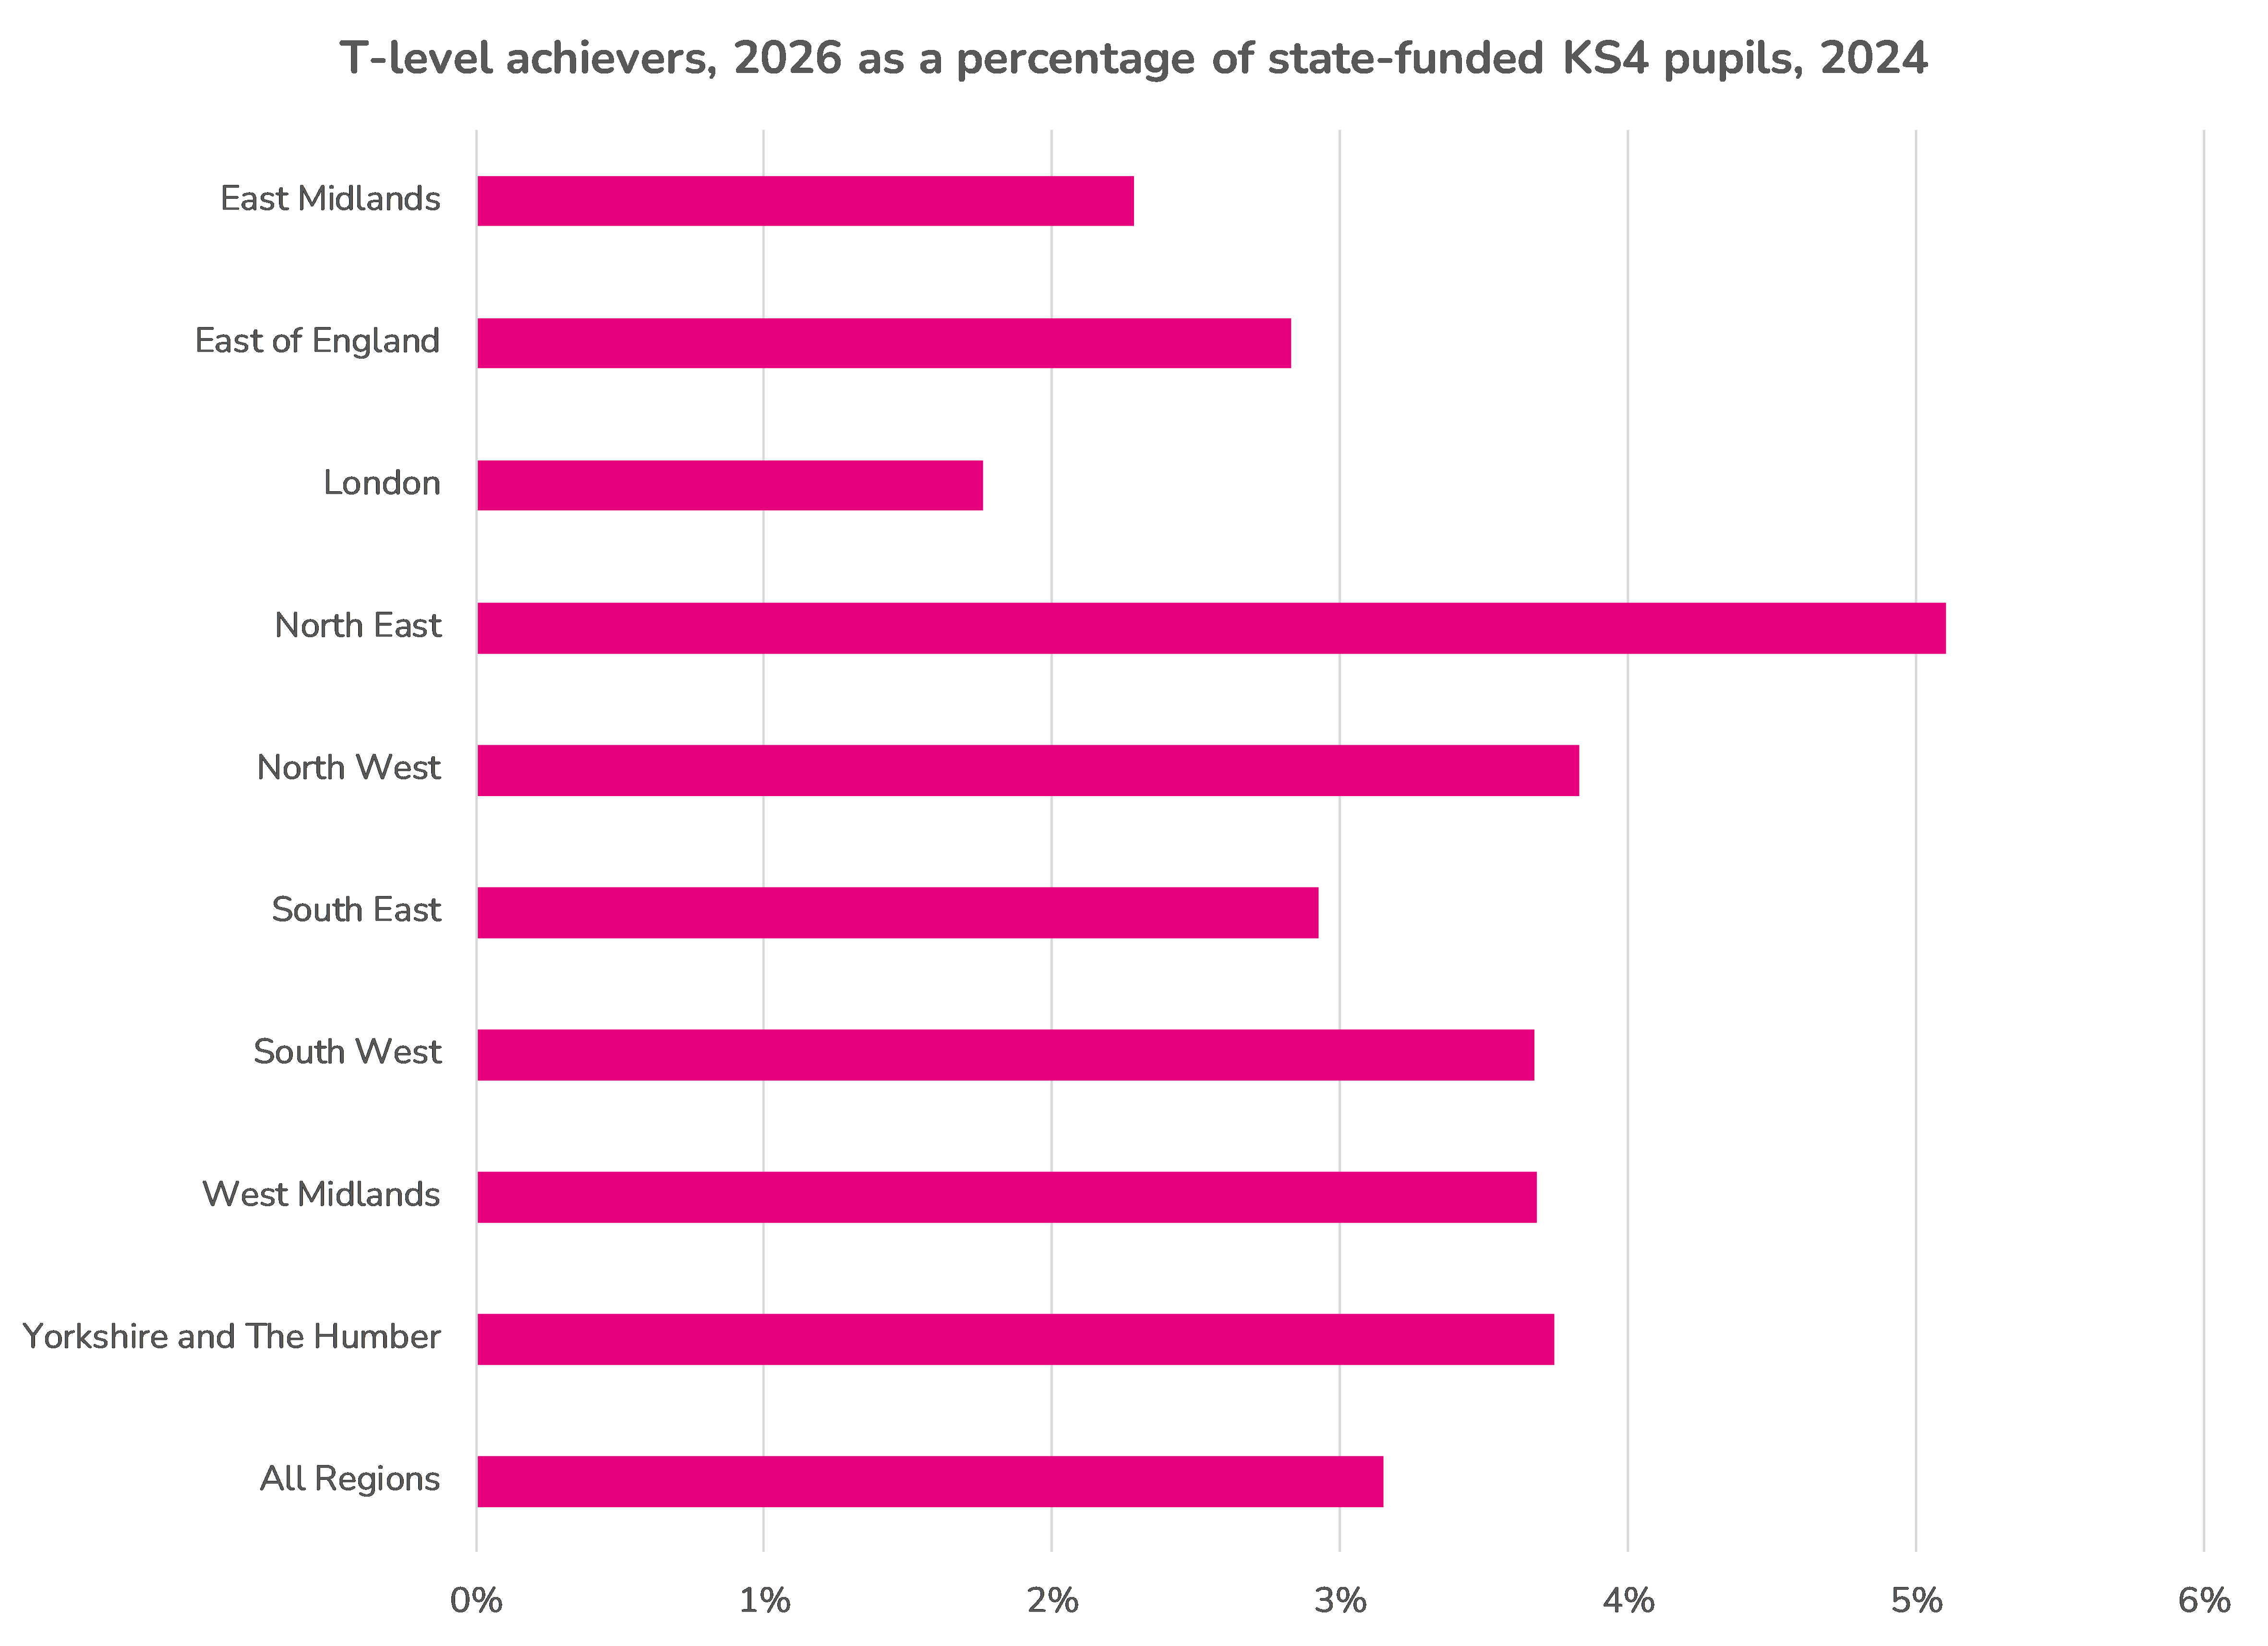
We would need to access student-level data to do a proper analysis of take-up rates. But in the meantime we can do something approximate by dividing the total number of T-level achievers in each region by the number of students in state-funded schools at the end of Key Stage 4 in 2024.
There are some obvious problems with this: The numbers of T-level achievers include older students as well as 18 year olds, and some students move regions (some achievers may even have been overseas at the end of KS4).
That notwithstanding, we calculate approximate T-level take-up rates below. Take-up of T-levels appears to be highest in the North East and the lowest in London.
Top grades in applied generals have increased
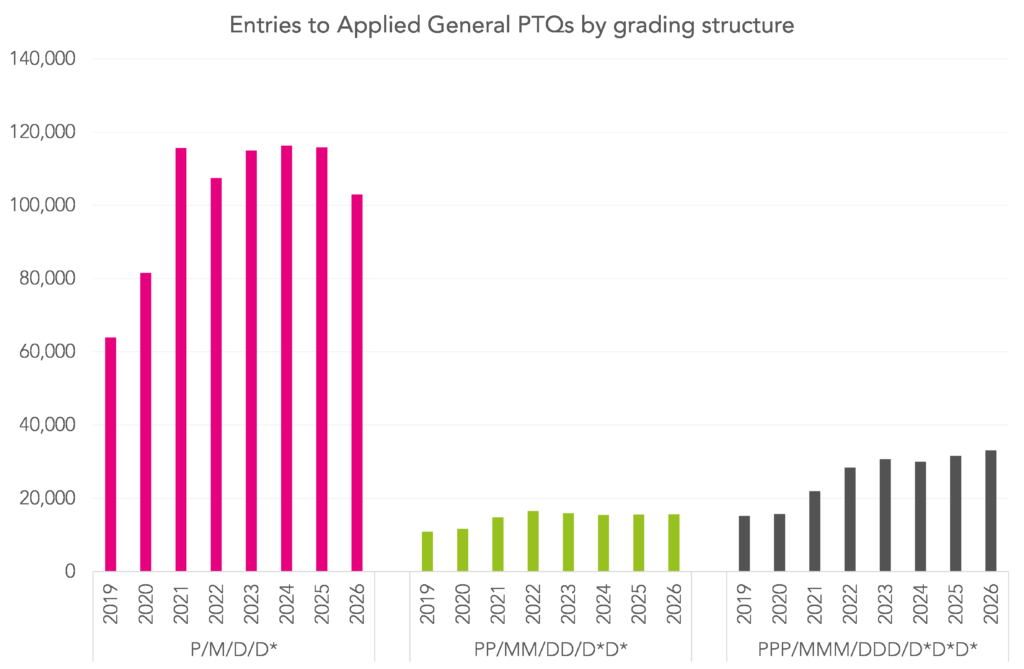
Unlike A-levels, the proportion of top grades awarded in Applied General qualifications has increased. Applied Generals, which include BTECs, are the most widely taken vocational qualification, with around 150 thousand entries this year (to the subset of qualifications included in performance tables, and graded P/M/D/D*, PP/MM/DD/D*D* or PPP/MMM/DDD/D*D*D*.)
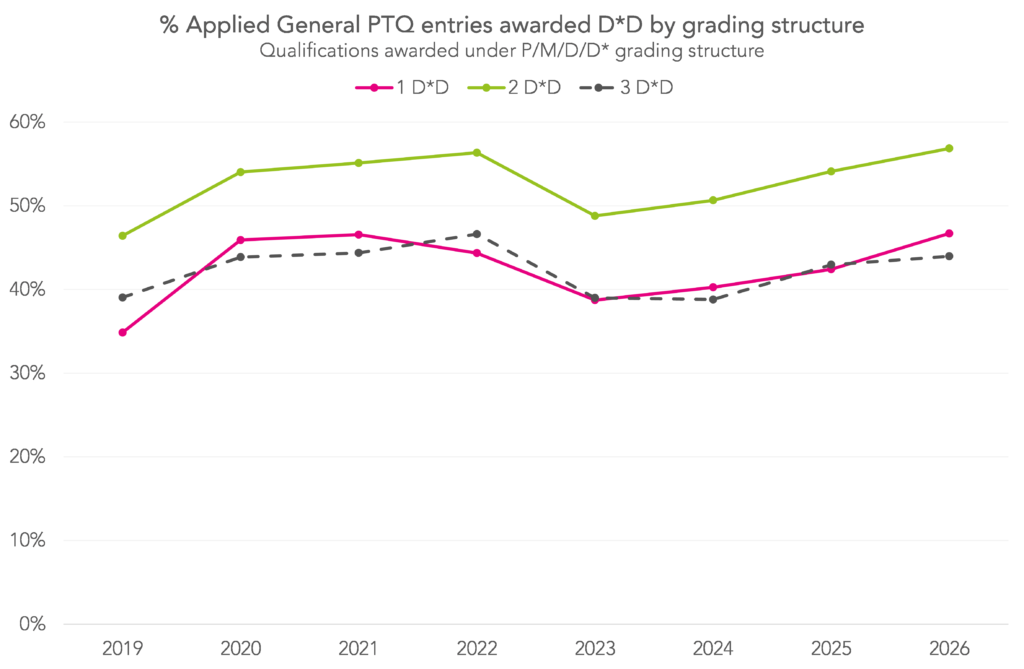
Perhaps surprisingly, given the uncertainty around funding for these qualifications over the past few years, the number of entries to the largest Applied Generals have increased this year. But entries to the smallest and most popular Applied Generals have decreased.
A-Level entries are up in economics, political studies and law
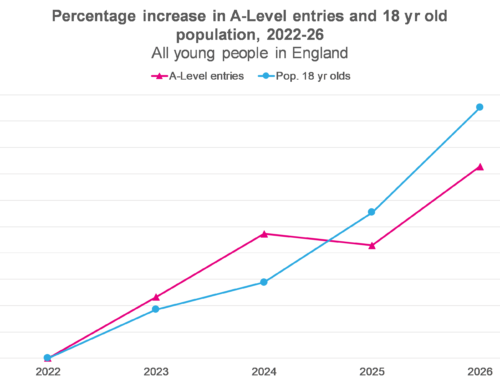
Overall, A-Level entry numbers are up 2.6% this year but, as we wrote in our preview post earlier this week, this reflects an increase in the 18-year-old population.
Some individual subjects have seen increases well above the overall level, and others have seen entry numbers fall.
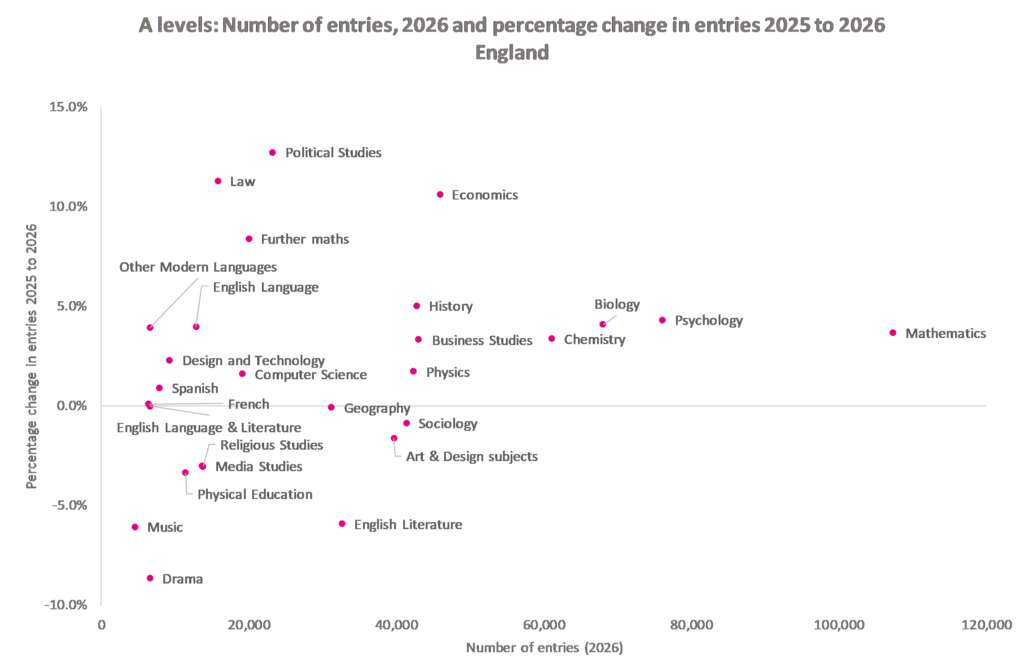
The subjects with the largest increases are political studies (up 12.7%), law (up 11.3%) and economics (up 10.6%). This brings economics up to the fifth most popular A-Level subject. The increase in popularity for economics comes as new research has identified it as the degree subject associated with the highest lifetime earnings.
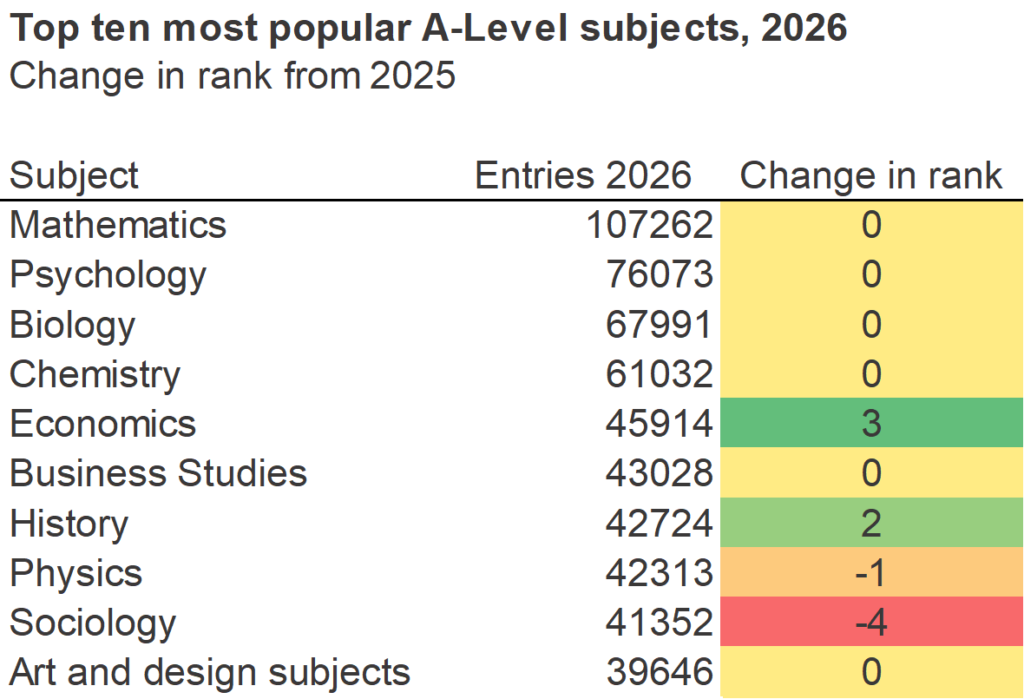
Of the most popular subjects, physics and sociology have seen a fall in ranking. Overall, subjects with the largest drop in entries are English literature, drama and music. As we wrote in our preview post, all three subjects have seen year-on-year falls in entries for the last three years. Entries in drama are 15.2% below levels in 2024, English literature 10.1% and music 8.6%.
The gender gap in A-level grading has grown slightly, but subject choice remains the key factor
Last year, male A-level students overtook female students in terms of the percentage of grades awarded A*-A for the first time since 2019. And this year, the gap has increased slightly, from 0.36%pt last year to 1%pt this year.
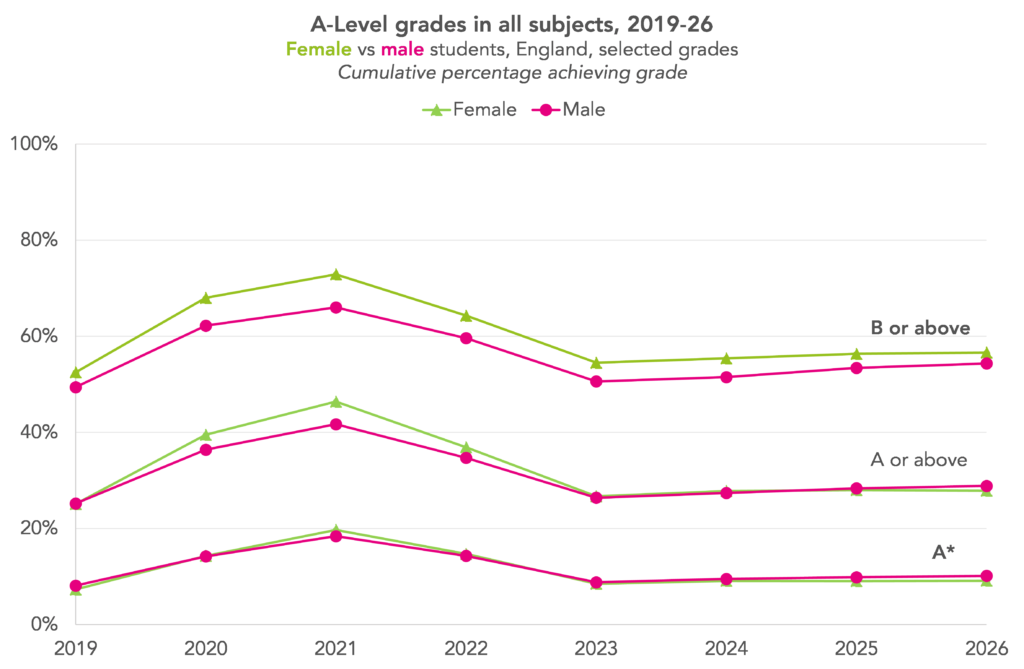
However, when we look at grades awarded by subject, the gap either disappears or is reversed. That is, for a given subject, it is not the case that male students get a higher proportion of A*-A grades than female. In fact often it’s the other way around.
What’s driving the higher A*-A percentage overall among male students than female is that male students disproportionately take subjects where high numbers of top grades are awarded, particularly maths.
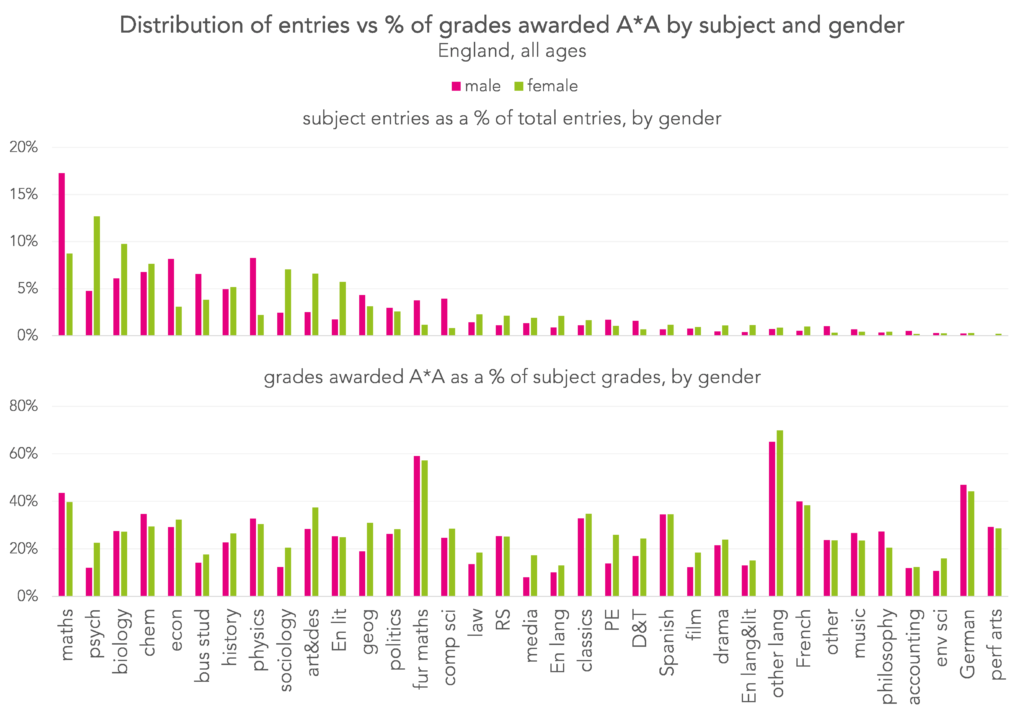
If female students had the same distribution of entries by subject as male students (but the A*-A rates by gender in each subject remained as observed) then the overall gender gap would reverse. 30.5% of grades awarded to female students would be at A*-A, 1.7%pts higher than the 28.9% of A*-A grades awarded to male students.
A-Level grades in independent and selective schools remain well above other centre types
There’s little change in grades by centre type this year, which means that top grades in independent and selective schools remain above those in other centre types.
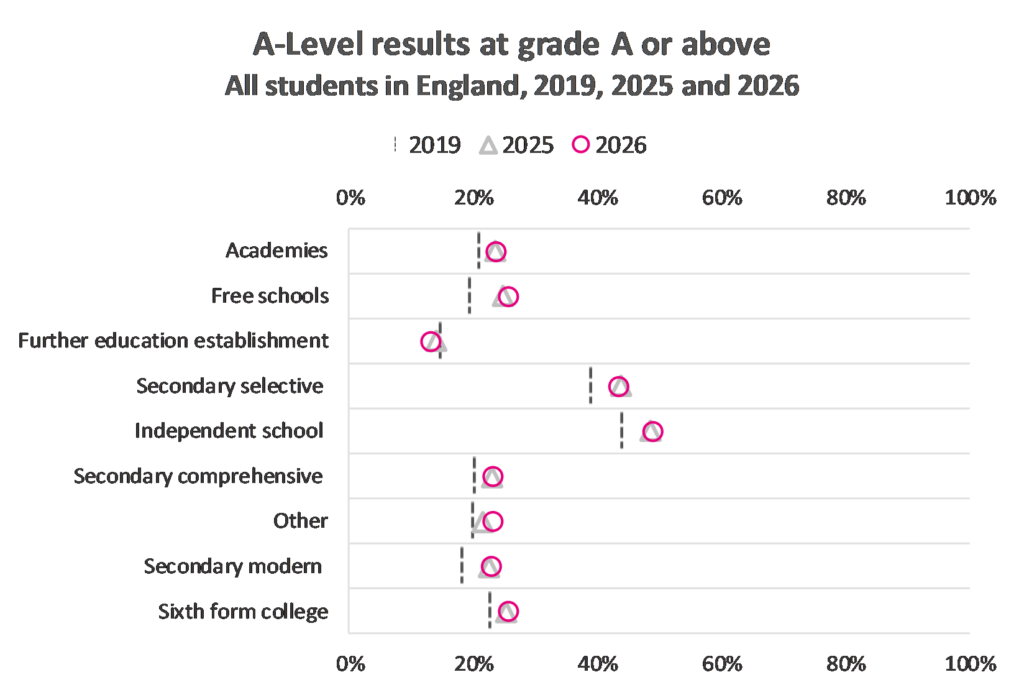
Among entries from independent schools, nearly half (48.9%) received a grade A*-A, as did 43.4% of entries from selective (grammar) schools. This compares to just 23.6% of entries from academies and 13.1% from further education establishments.
Leave A Comment