One of the big announcements in the schools White Paper released earlier this year was an ambition to halve the disadvantage gap at Key Stage 4. This would be achieved, it said, by grades increasing across the board, with bigger increases for disadvantaged than the non-disadvantaged pupils. And would happen by the time those born at the start of the current Labour Government sit their Key Stage 4 exams, i.e. 2040.
There have already been some criticisms of this ambition, mostly around a perceived lack of planning to allow it to be realised. There have also been questions about how we’ll measure it, given that the definition of “disadvantage” is going to change over time, as is the composition of attainment measures. (The DfE did acknowledge both of these points in the White Paper, saying that they would be monitored, but that “the ambition will remain commensurate with halving the gap”.)
We’re not going to offer a view on either of these issues today. Instead, we’re going to quantify the scale of the challenge.
To do this, we use 2025 Key Stage 4 data from the National Pupil Database (NPD). We try to match the population used in performance tables as closely as possible but, inevitably, there are some small discrepancies between our figures and those published by the DfE[1].
The scale of the challenge
Let’s start with what we know from the technical details of the White Paper: the aim is for the average Attainment 8 (A8) score, nationally, to increase from 45.9 points in 2024 to 50.0 in 2040. At the same time, the difference in average A8 score between disadvantaged and non-disadvantaged pupils would halve, from 15.4 points to 7.7.
To visualise this, we first plot the distribution of pupils by A8 score in 2025. We divide the population into 100 equally sized groups in order of A8 score. The group with the lowest scores is assigned a “percentile rank” of 1, and the highest a rank of 100. On the x-axis we plot percentile rank, and on the y-axis, mean A8 score.
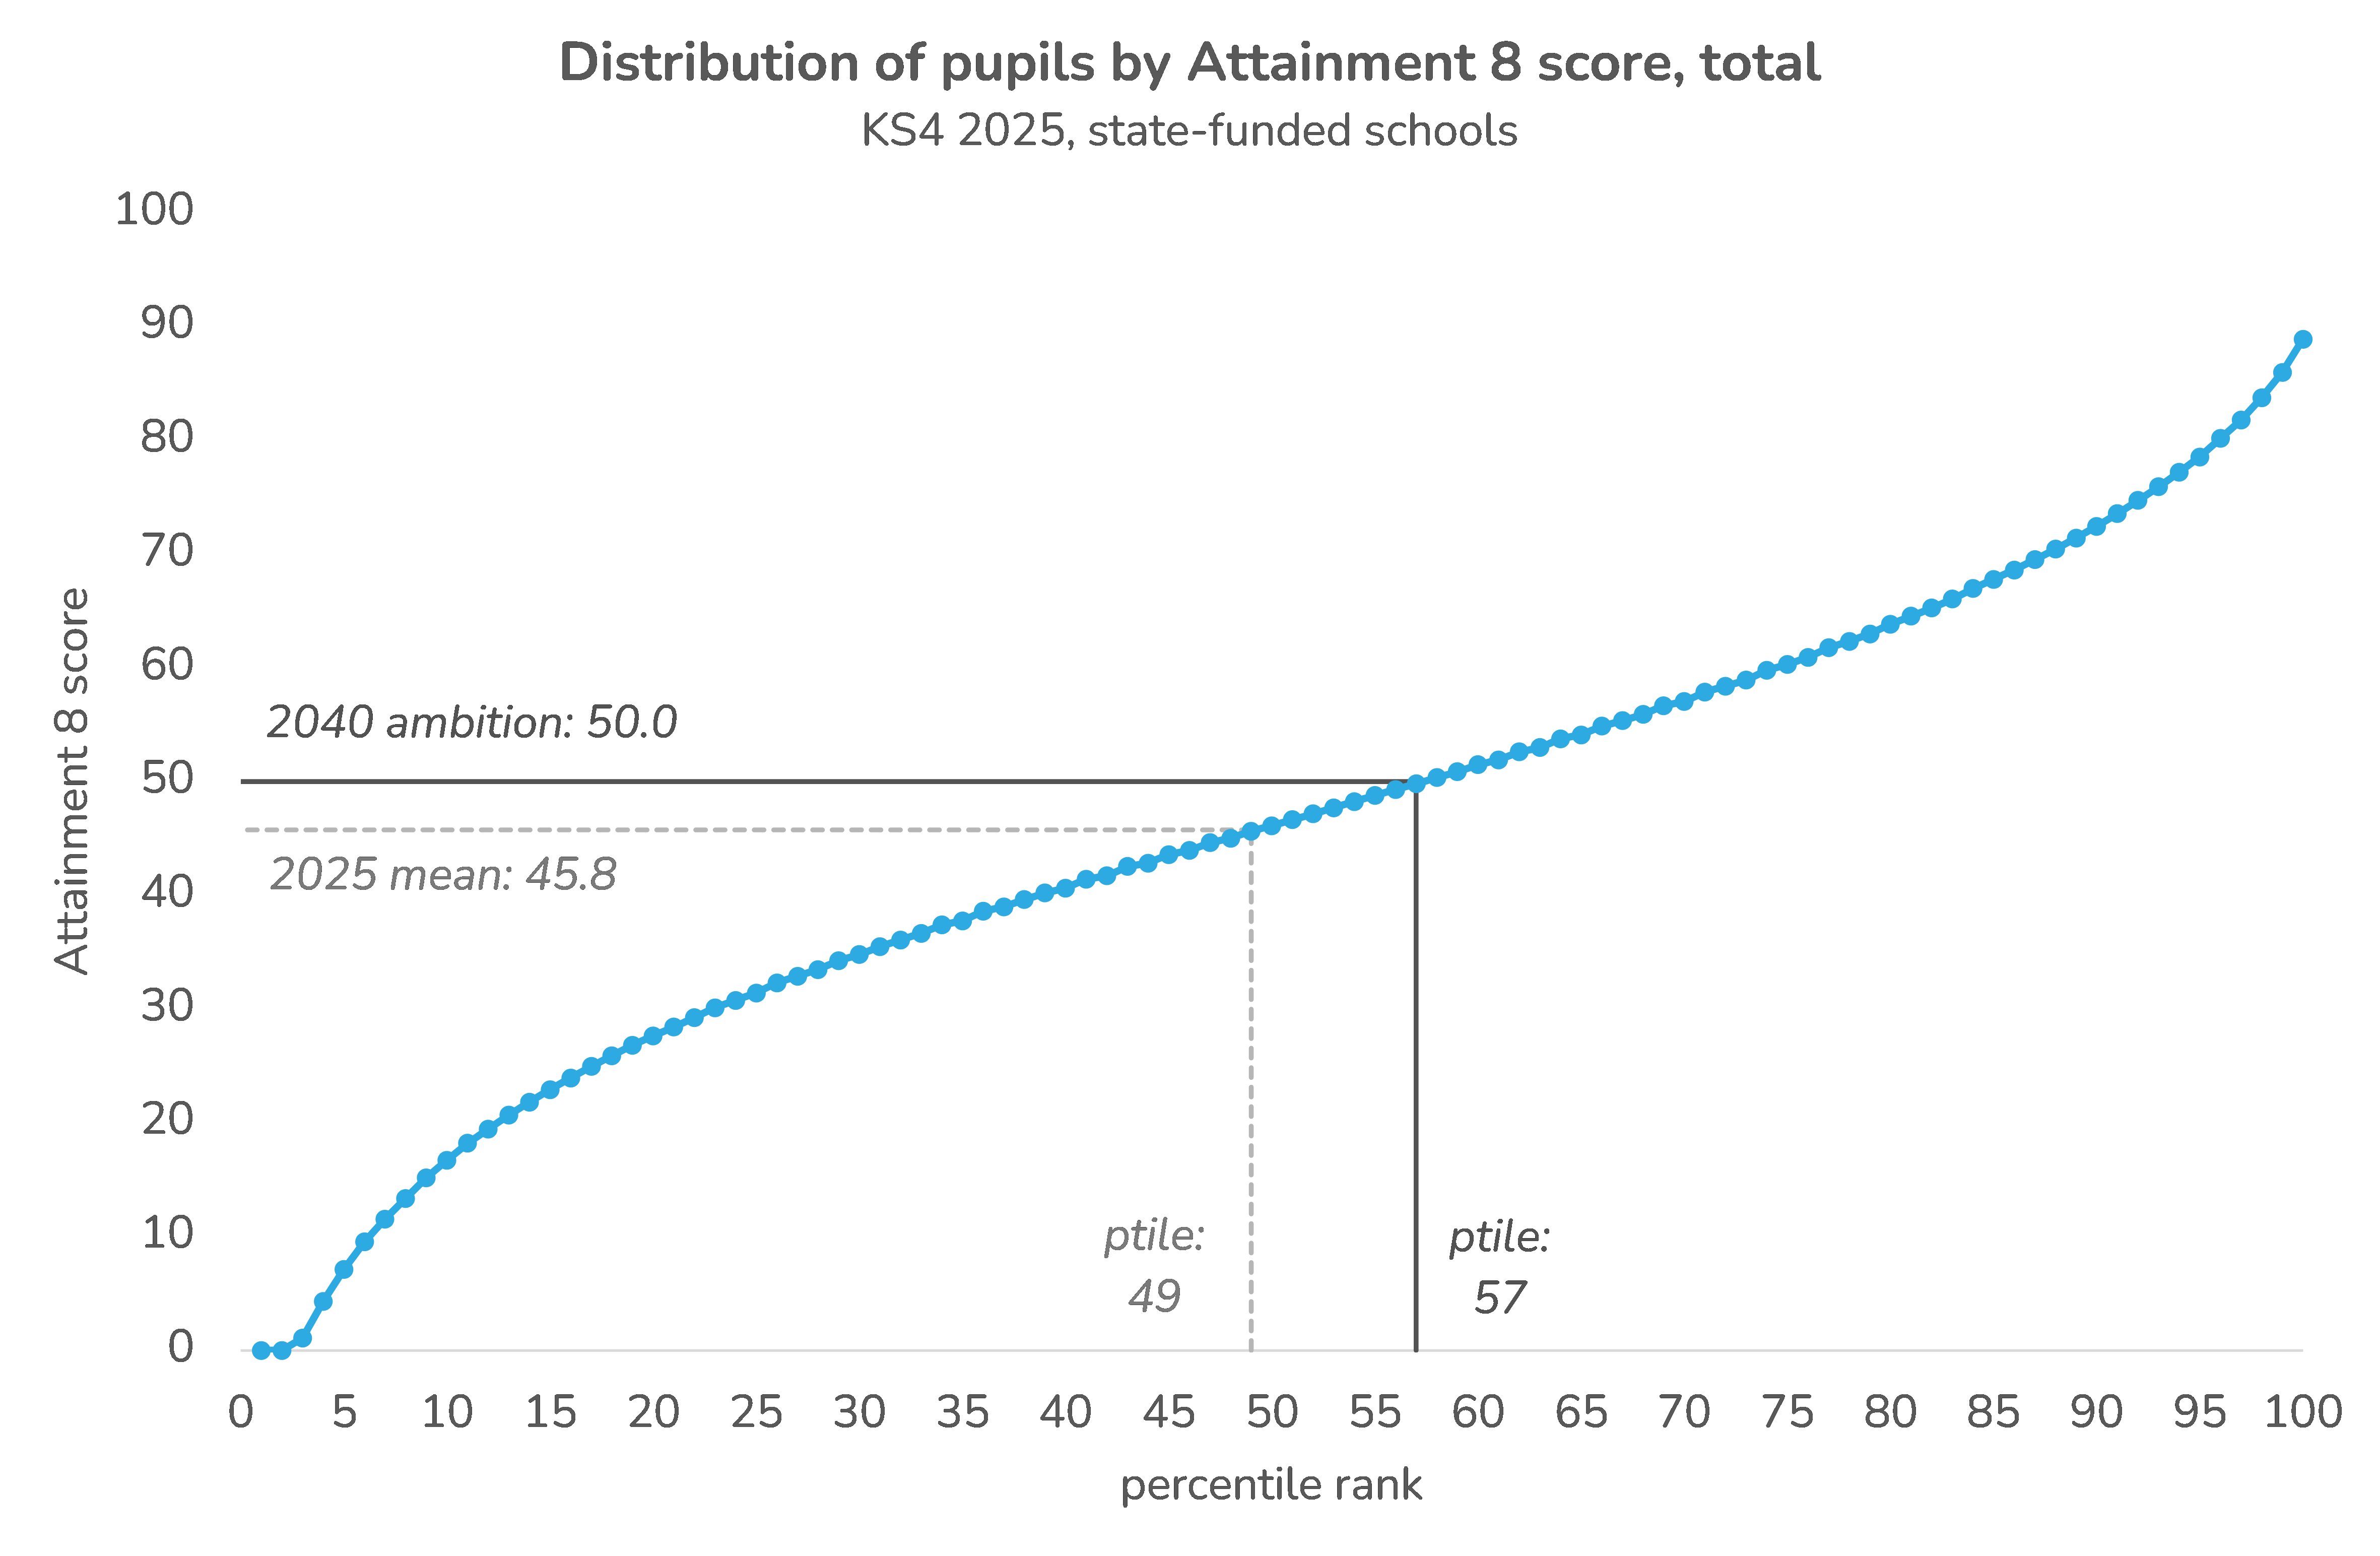
The overall mean A8 score in 2025 in our analysis population was 45.8. This score lies somewhere between the 49th and 50th percentile[2]. The ambition is for this score to increase to 50.0 by 2040. By reading the corresponding percentile from the chart, we see that this is equivalent to the mean pupil in 2040 achieving an A8 score higher than 57% of 2025 pupils.
For context, the national A8 score in 2021, when grades were much higher than usual due to pandemic-related awarding mechanisms (teacher assessed grades, or TAGs), was only slightly higher than the ambition at 50.8. This score would be at the 59th percentile of the 2025 distribution.
Now, because it’s to be accompanied by a halving of the disadvantage gap, disadvantaged pupils must see a bigger increase than non-disadvantaged pupils. So how big is “bigger”? Well, we know that the overall mean A8 score should be 50, and that the gap between disadvantaged pupils and their peers should be 7.7 points. We also know the proportion of disadvantaged pupils in the 2025 KS4 cohort (27%).
Using these facts and a bit of maths gives us a mean “ambition” A8 score of 44.4 for disadvantaged pupils, 9.4 points higher than their mean score in 2025 of 35.0. (This matches the DfE’s analysis that meeting both ambitions would see disadvantaged pupils achieve “roughly one grade higher in each GCSE slot”.) The corresponding increase for non-disadvantaged pupils would be from 49.8 in 2025 to 52.1.
Let’s plot these points on the distributions of disadvantaged (FSM6) and non-disadvantaged pupils by A8 in 2025.
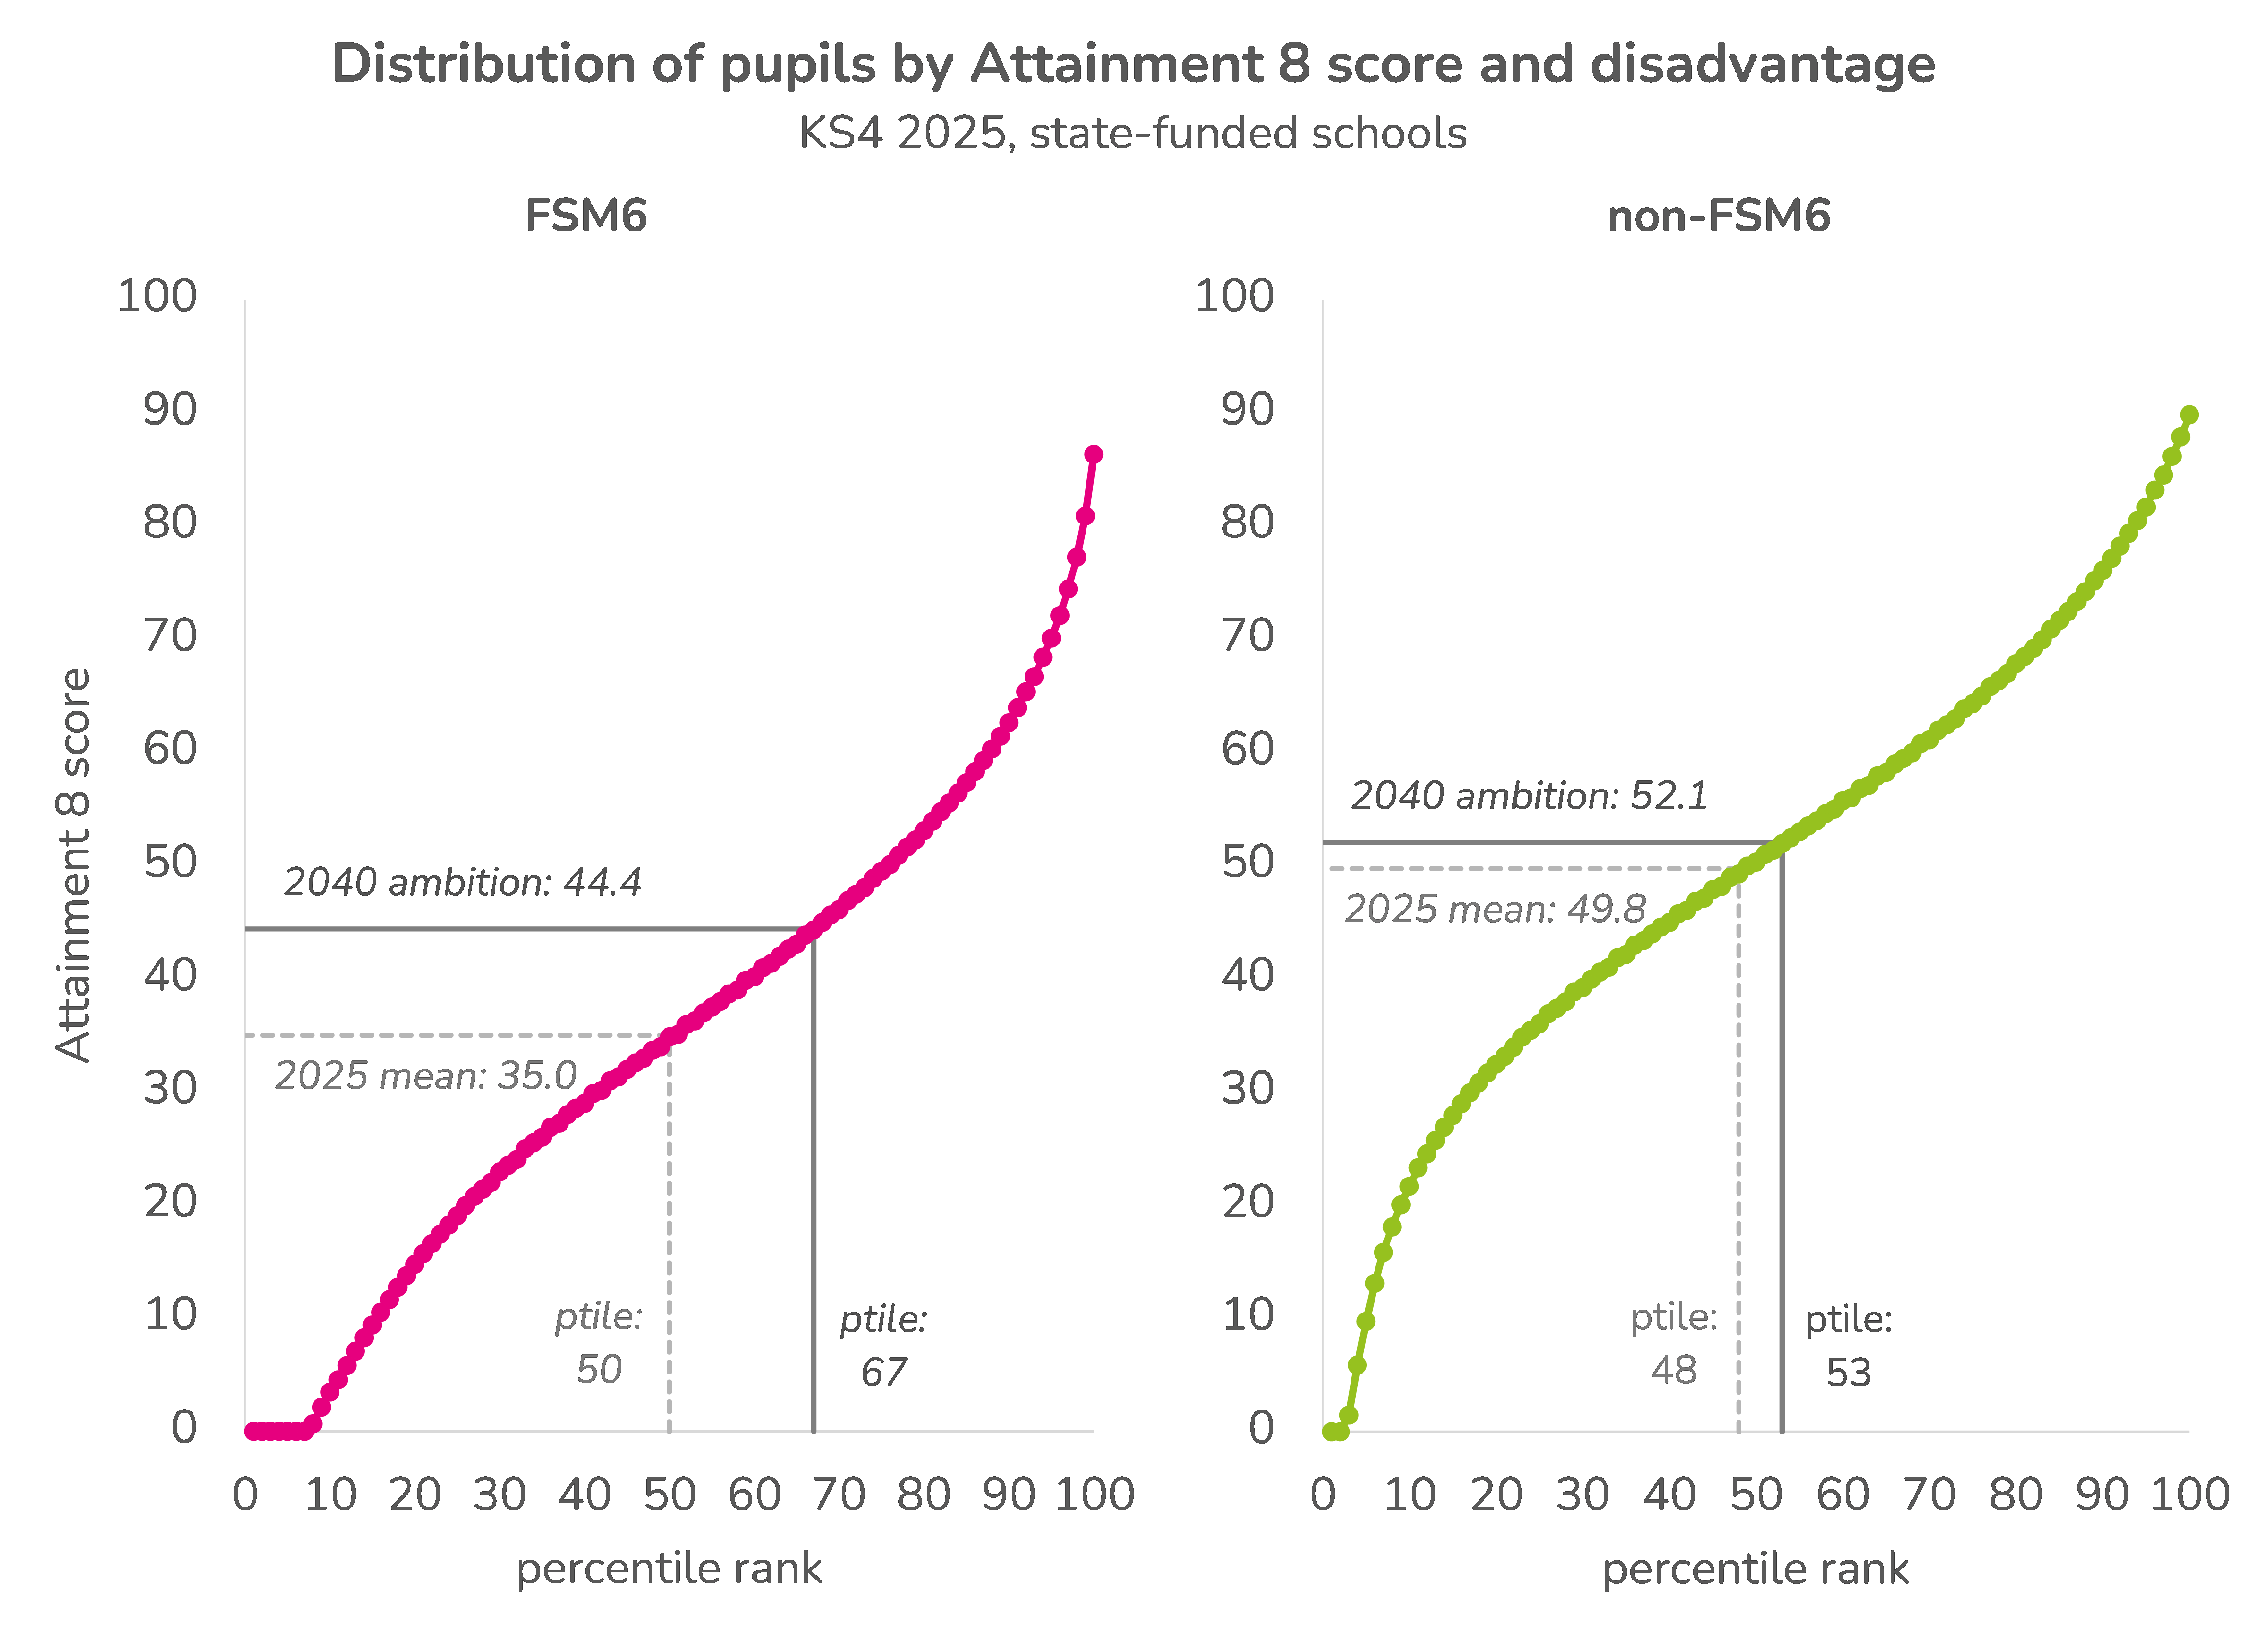
The mean A8 score for disadvantaged pupils in 2025 of 35.0 is around the 50th percentile. The ambition of 44.4 is around the 67th. In other words, the mean disadvantaged pupil in 2040 would need to reach a better level of achievement than two-thirds of disadvantaged pupils in 2025.
Again, for context, in 2021, the national A8 score for disadvantaged pupils was 40.5, around the 60th percentile of the 2025 distribution for disadvantaged pupils, and 4 points shy of the ambition.
Overall then, in order for the White Paper’s ambitions to be met, we’d need to see attainment increase nationally to something like the levels seen in 2021 under TAGs, but disadvantaged pupils would need to see a much greater share of the increase.
Impact at different parts of the attainment distribution
So far, we’ve been talking about averages: there would need to be an average increase of 9.4 in disadvantaged pupils’ A8 scores by 2040. But what might that look like across the whole attainment distribution?
We’ll first look at the simplest option: every disadvantaged pupil sees their score increase by 9.4 points. Below, we again plot the 2025 A8 distributions for disadvantaged and non-disadvantaged pupils. This time, we put them on the same chart, and we model the hypothetical distribution for disadvantaged pupils with this uniform increase applied.
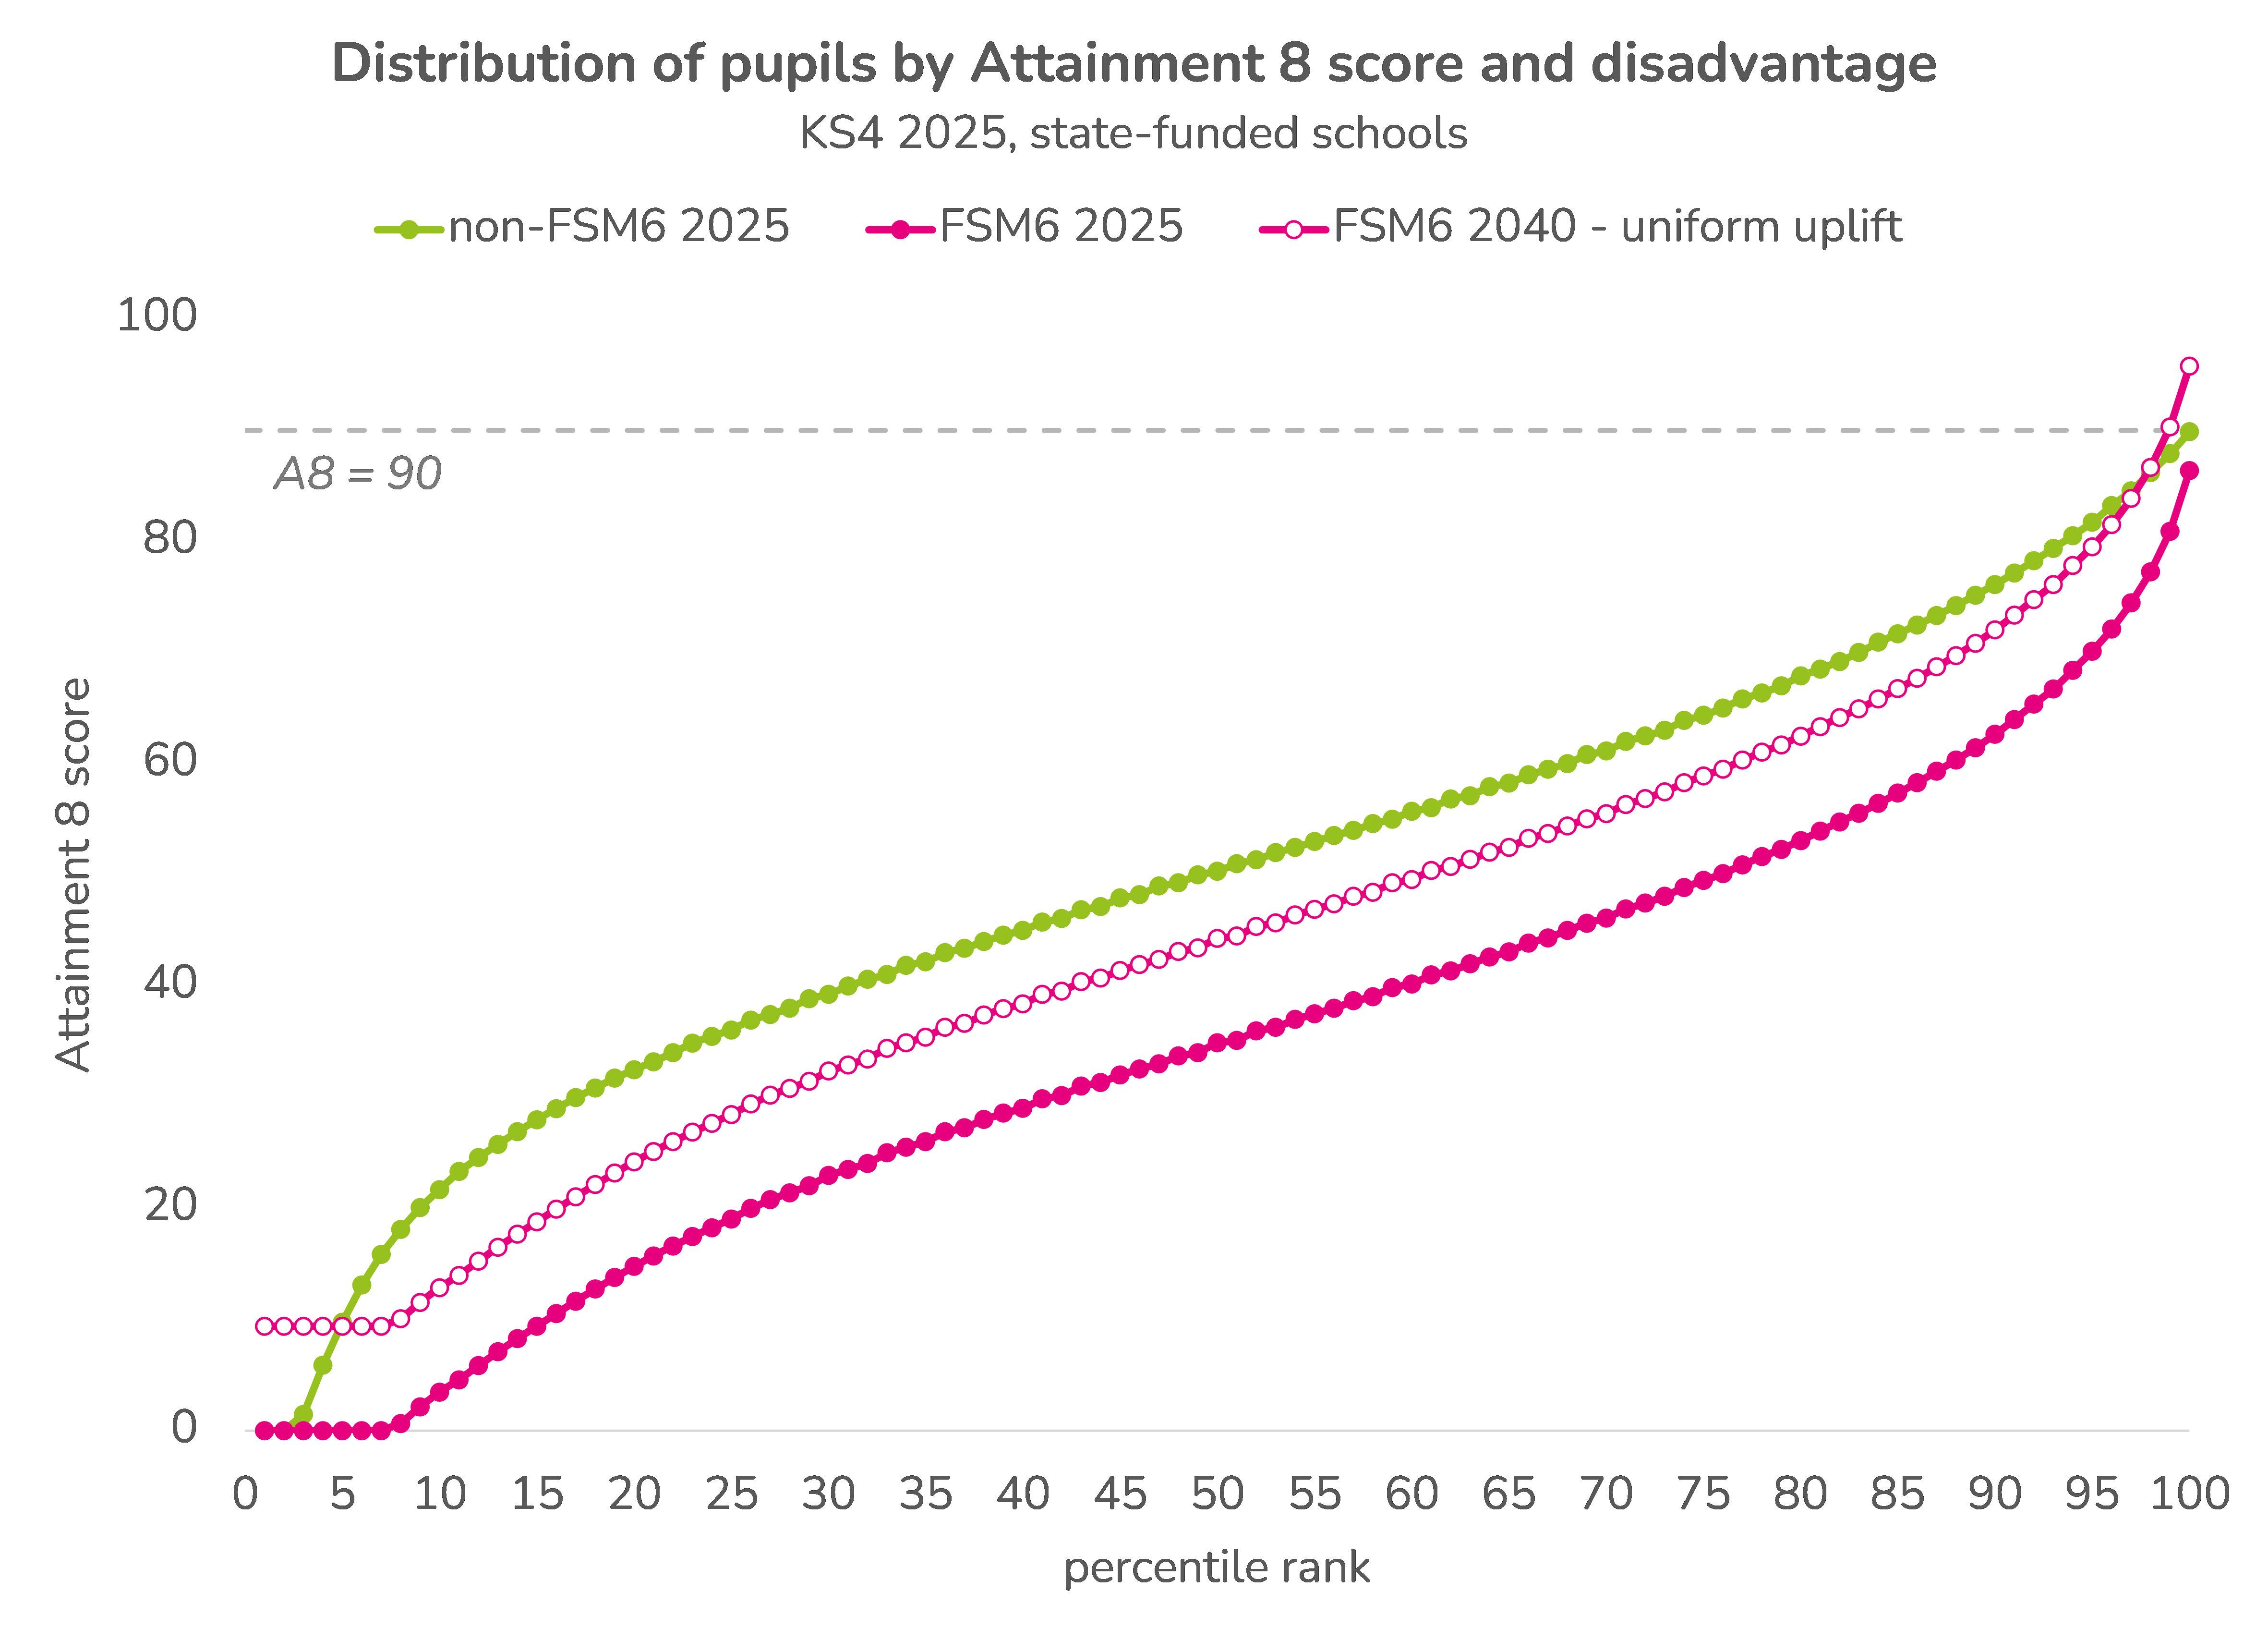
Two things jump out immediately. Firstly, pupils at the top of the distribution, those whose A8 scores put them in the top 2% of disadvantaged pupils, would need to see their scores increase above 90, i.e. they’d need to achieve an average above the maximum of a grade 9 at GCSE. Secondly, there would need to be no disadvantaged pupils with zero A8 points (currently 7%). While both of these things are technically possible[3], neither is likely.
There’s also a subtler consequence. Although all disadvantaged pupils would see their scores increase by the same absolute amount, the disadvantage gap would be narrowed to a greater extent at the top end of the distribution than the bottom. For example, at the 10th percentile in 2025, the disadvantage gap was 18.2 points (21.7 vs 3.5). This would reduce to 8.8 points under the uniform uplift scenario (21.7 vs 12.9), a reduction of 52%. Meanwhile, at the 90th percentile, the gap would reduce from 13.5 (76.1 vs 62.6) to 4.1 (76.1 vs 72.0), a reduction of 70%.
What would it look like then if, instead of a uniform uplift for all pupils, we saw the disadvantage gap narrow by the same proportion across the whole distribution? We plot this below:
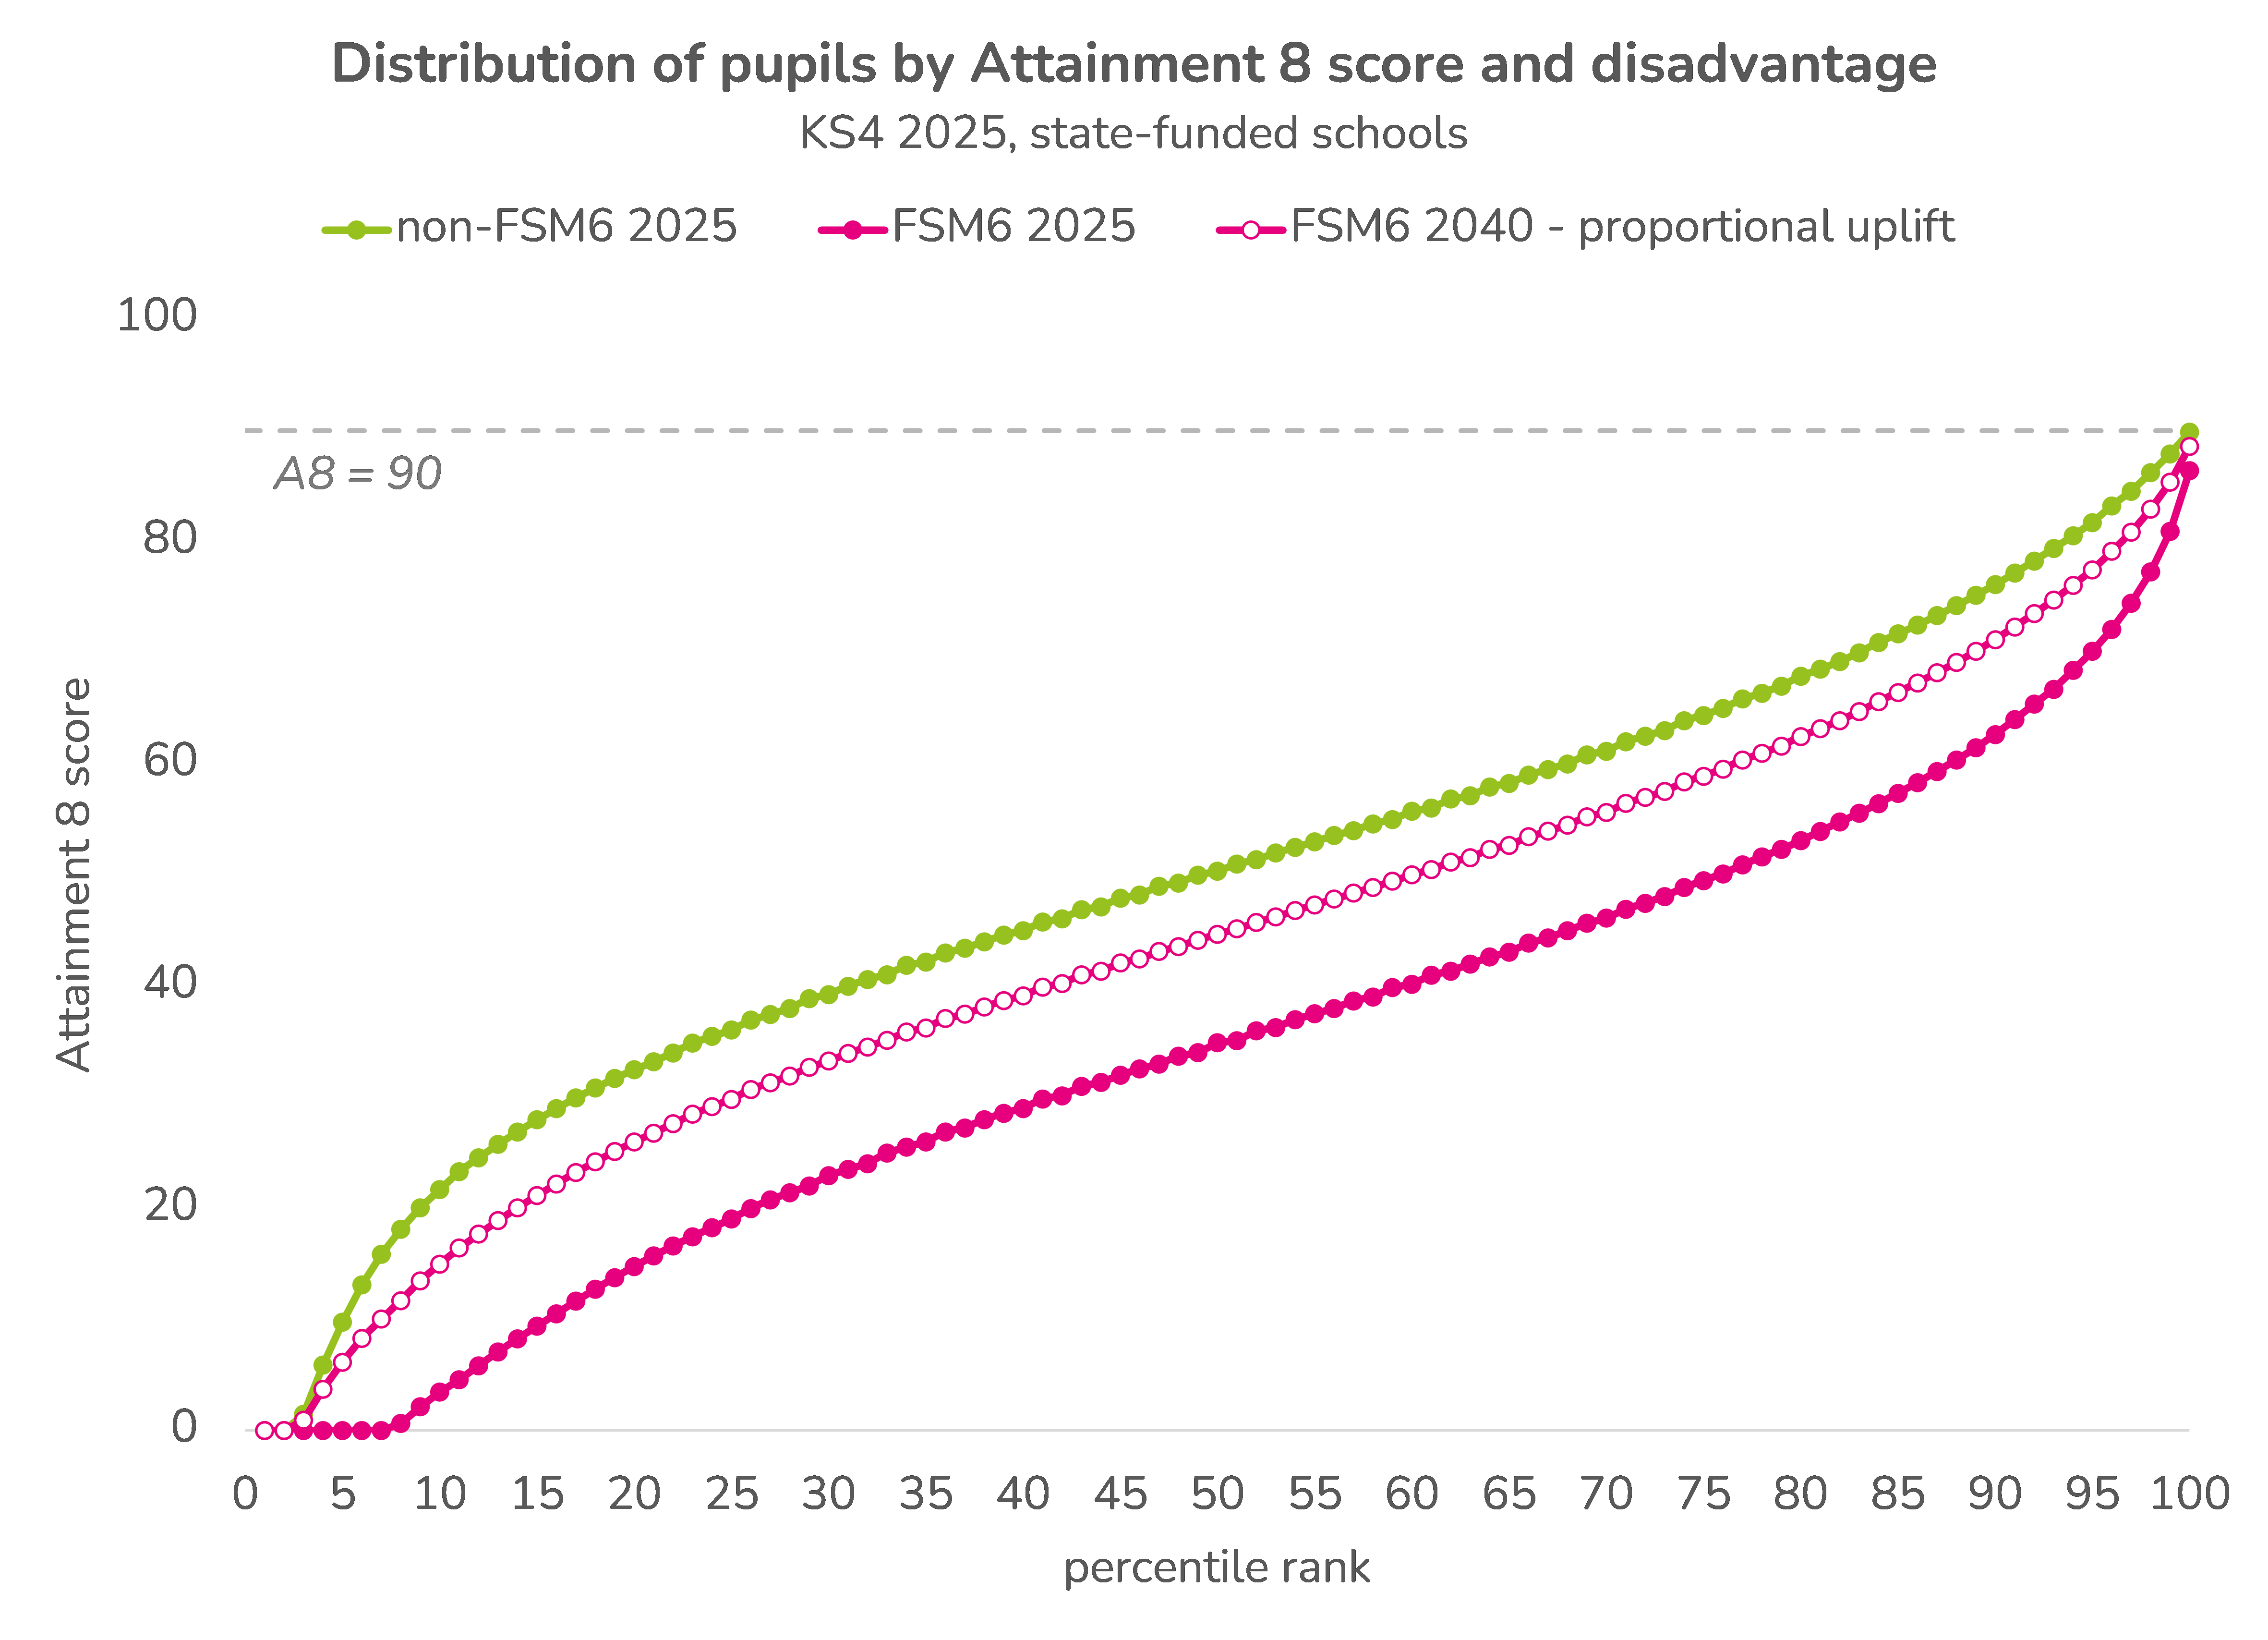
Compared with the uniform uplift scenario, the top end of the distribution appears more realistic. This is also true for the very bottom end, where there’s a more gradual increase, though still a large reduction in the proportion of disadvantaged students scoring zero points, from 7% to 2%.
Pupils scoring zero aside, bigger gains in absolute terms would need to be made by those whose current attainment is lower, and vice versa. We can see this more directly by plotting the increase in disadvantaged students’ A8 scores under each model by their A8 scores in 2025.
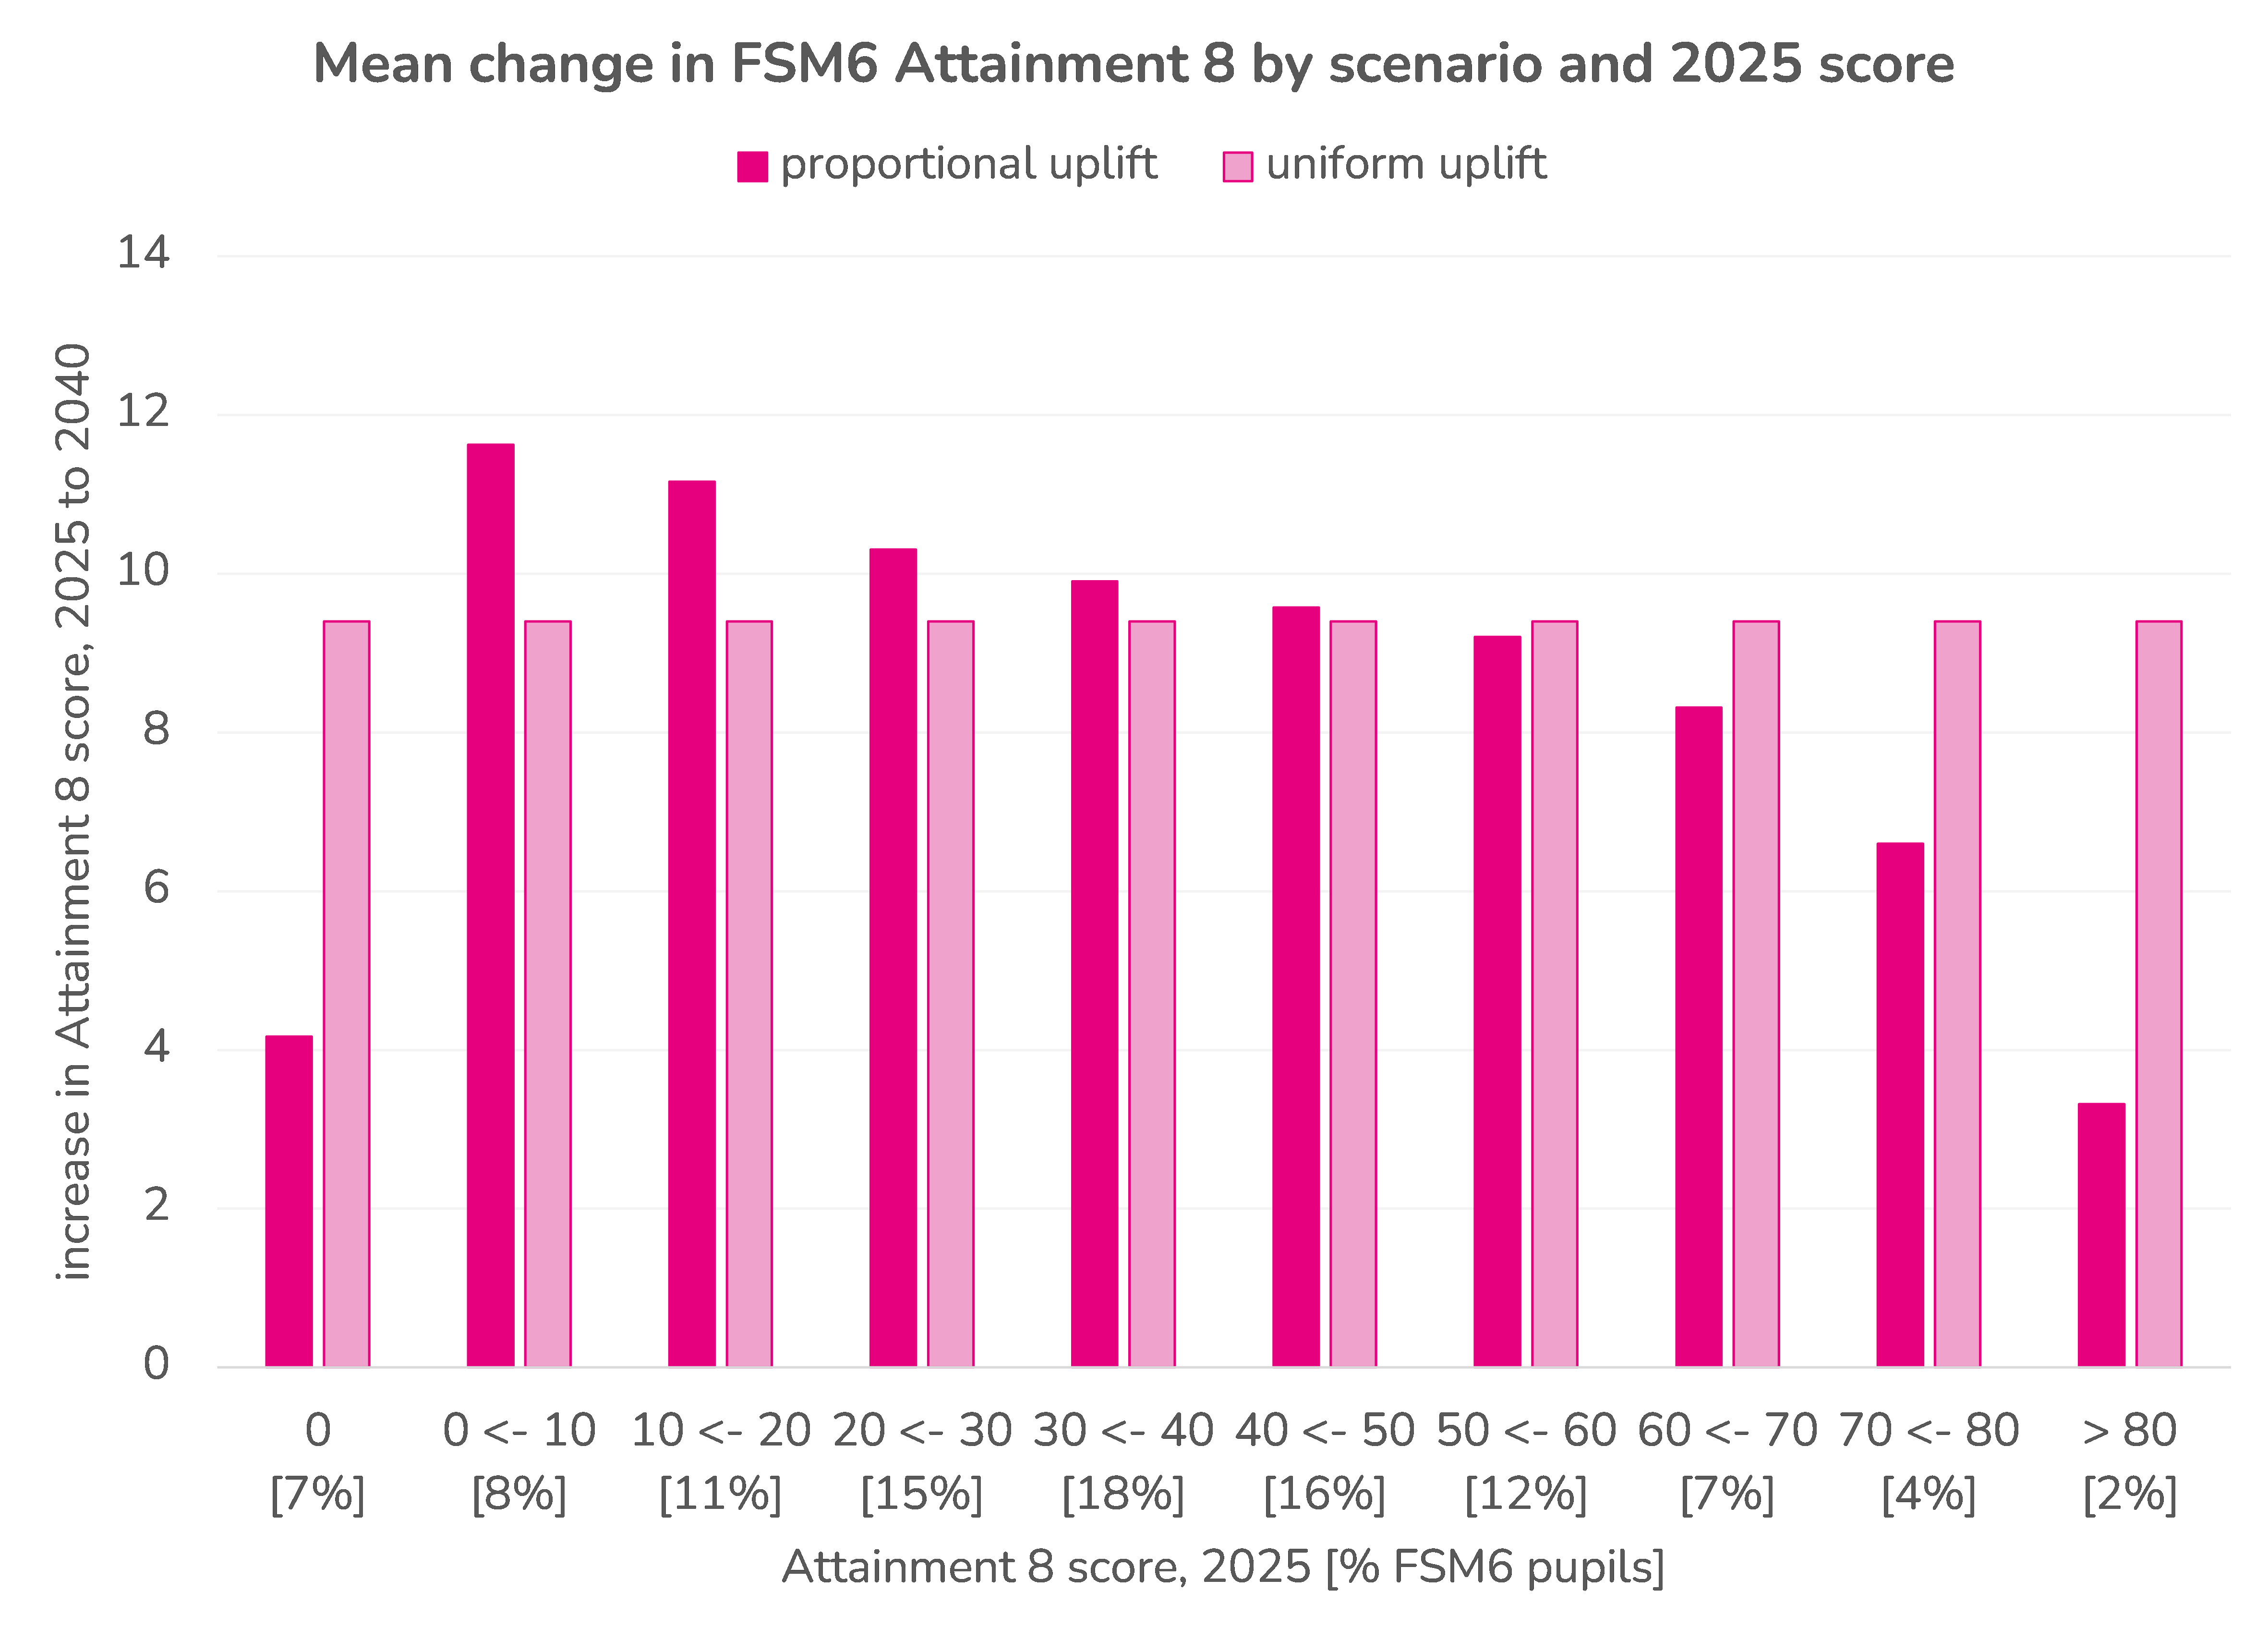
Finally, under either scenario, the proportional increase in attainment would be much greater among lower attainers than higher. For example, disadvantaged pupils currently scoring between 0 and 10 would need to see their A8 scores approximately triple, while those scoring between 60 and 70 would need to see their scores increase by around 15%.
Summing up
The overall increase in Attainment 8 targeted in the White Paper is of a similar size to the increase seen between 2019 and 2021, when TAGs were used to award grades instead of exams. Putting aside the question of whether this is actually possible in a world where KS4 results have largely tended to stay the same from year to year, it’s definitely a big challenge.
Bigger still is the challenge of increasing disadvantaged pupils’ attainment beyond levels seen in 2021. This will require all disadvantaged students to make considerable gains. But the biggest gains are likely to be needed among those with the lowest levels of attainment. Overcoming the diverse and complex barriers faced by this group in particular would therefore need to be a priority.
Want to stay up-to-date with the latest research from FFT Education Datalab? Sign up to Datalab’s mailing list to get notifications about new blogposts, or to receive the team’s half-termly newsletter.

[1] We’ve also used the unamended dataset rather than the final dataset, as that was the most recent one available to us at time of writing
[2] The median, scored by the group of pupils at the 50th and 51st percentiles, was slightly higher at 46.4.
[3] An A at AS-level attracts 10.75 points so, in theory, it’s possible for a pupil’s A8 score to be above 90.


It certainly signals virtue.
Nicely done Katie.
I don’t think we should put aside the issue of whether this is possible given the comparable outcomes methodology used at KS4; if heads are going to be held to account for this ambition (as they were for Ebacc entry in inspections) then we should all be clear they cannot, collectively, achieve it.