The Inquiry into White working class educational outcomes published its report earlier in the week, making a recommendation that improving reading fluency should be a central priority for improving outcomes for the group.
This makes some sense. A certain level of reading fluency is necessary to access the secondary curriculum.
But what do we know about how reading fluency develops during primary education for this group of pupils?
We take a look at the data from FFT’s Reading Assessment Programme, a simple online assessment tool to assess pupils on GPC [1] accuracy, decoding accuracy and reading fluency.
Data
We use data relating to 230,000 pupils in Years 1 to 6 in 1,600 schools from FFT’s Reading Assessment Programme (RAP) between September 2023 to 2026. In total, there are 1.06 million individual assessments.
Fluency is measured in terms of the number of words within a passage of text that a child can accurately read aloud in one minute. We take ‘words correct per minute’ (WCPM) as a broad indicator of fluency.
We acknowledge that assessments are entirely optional and are not undertaken in controlled conditions. Schools may assess some pupils and not others.
How fluency develops during primary school
First of all, we show how fluency changes from term to term between Year 1 and Year 6.
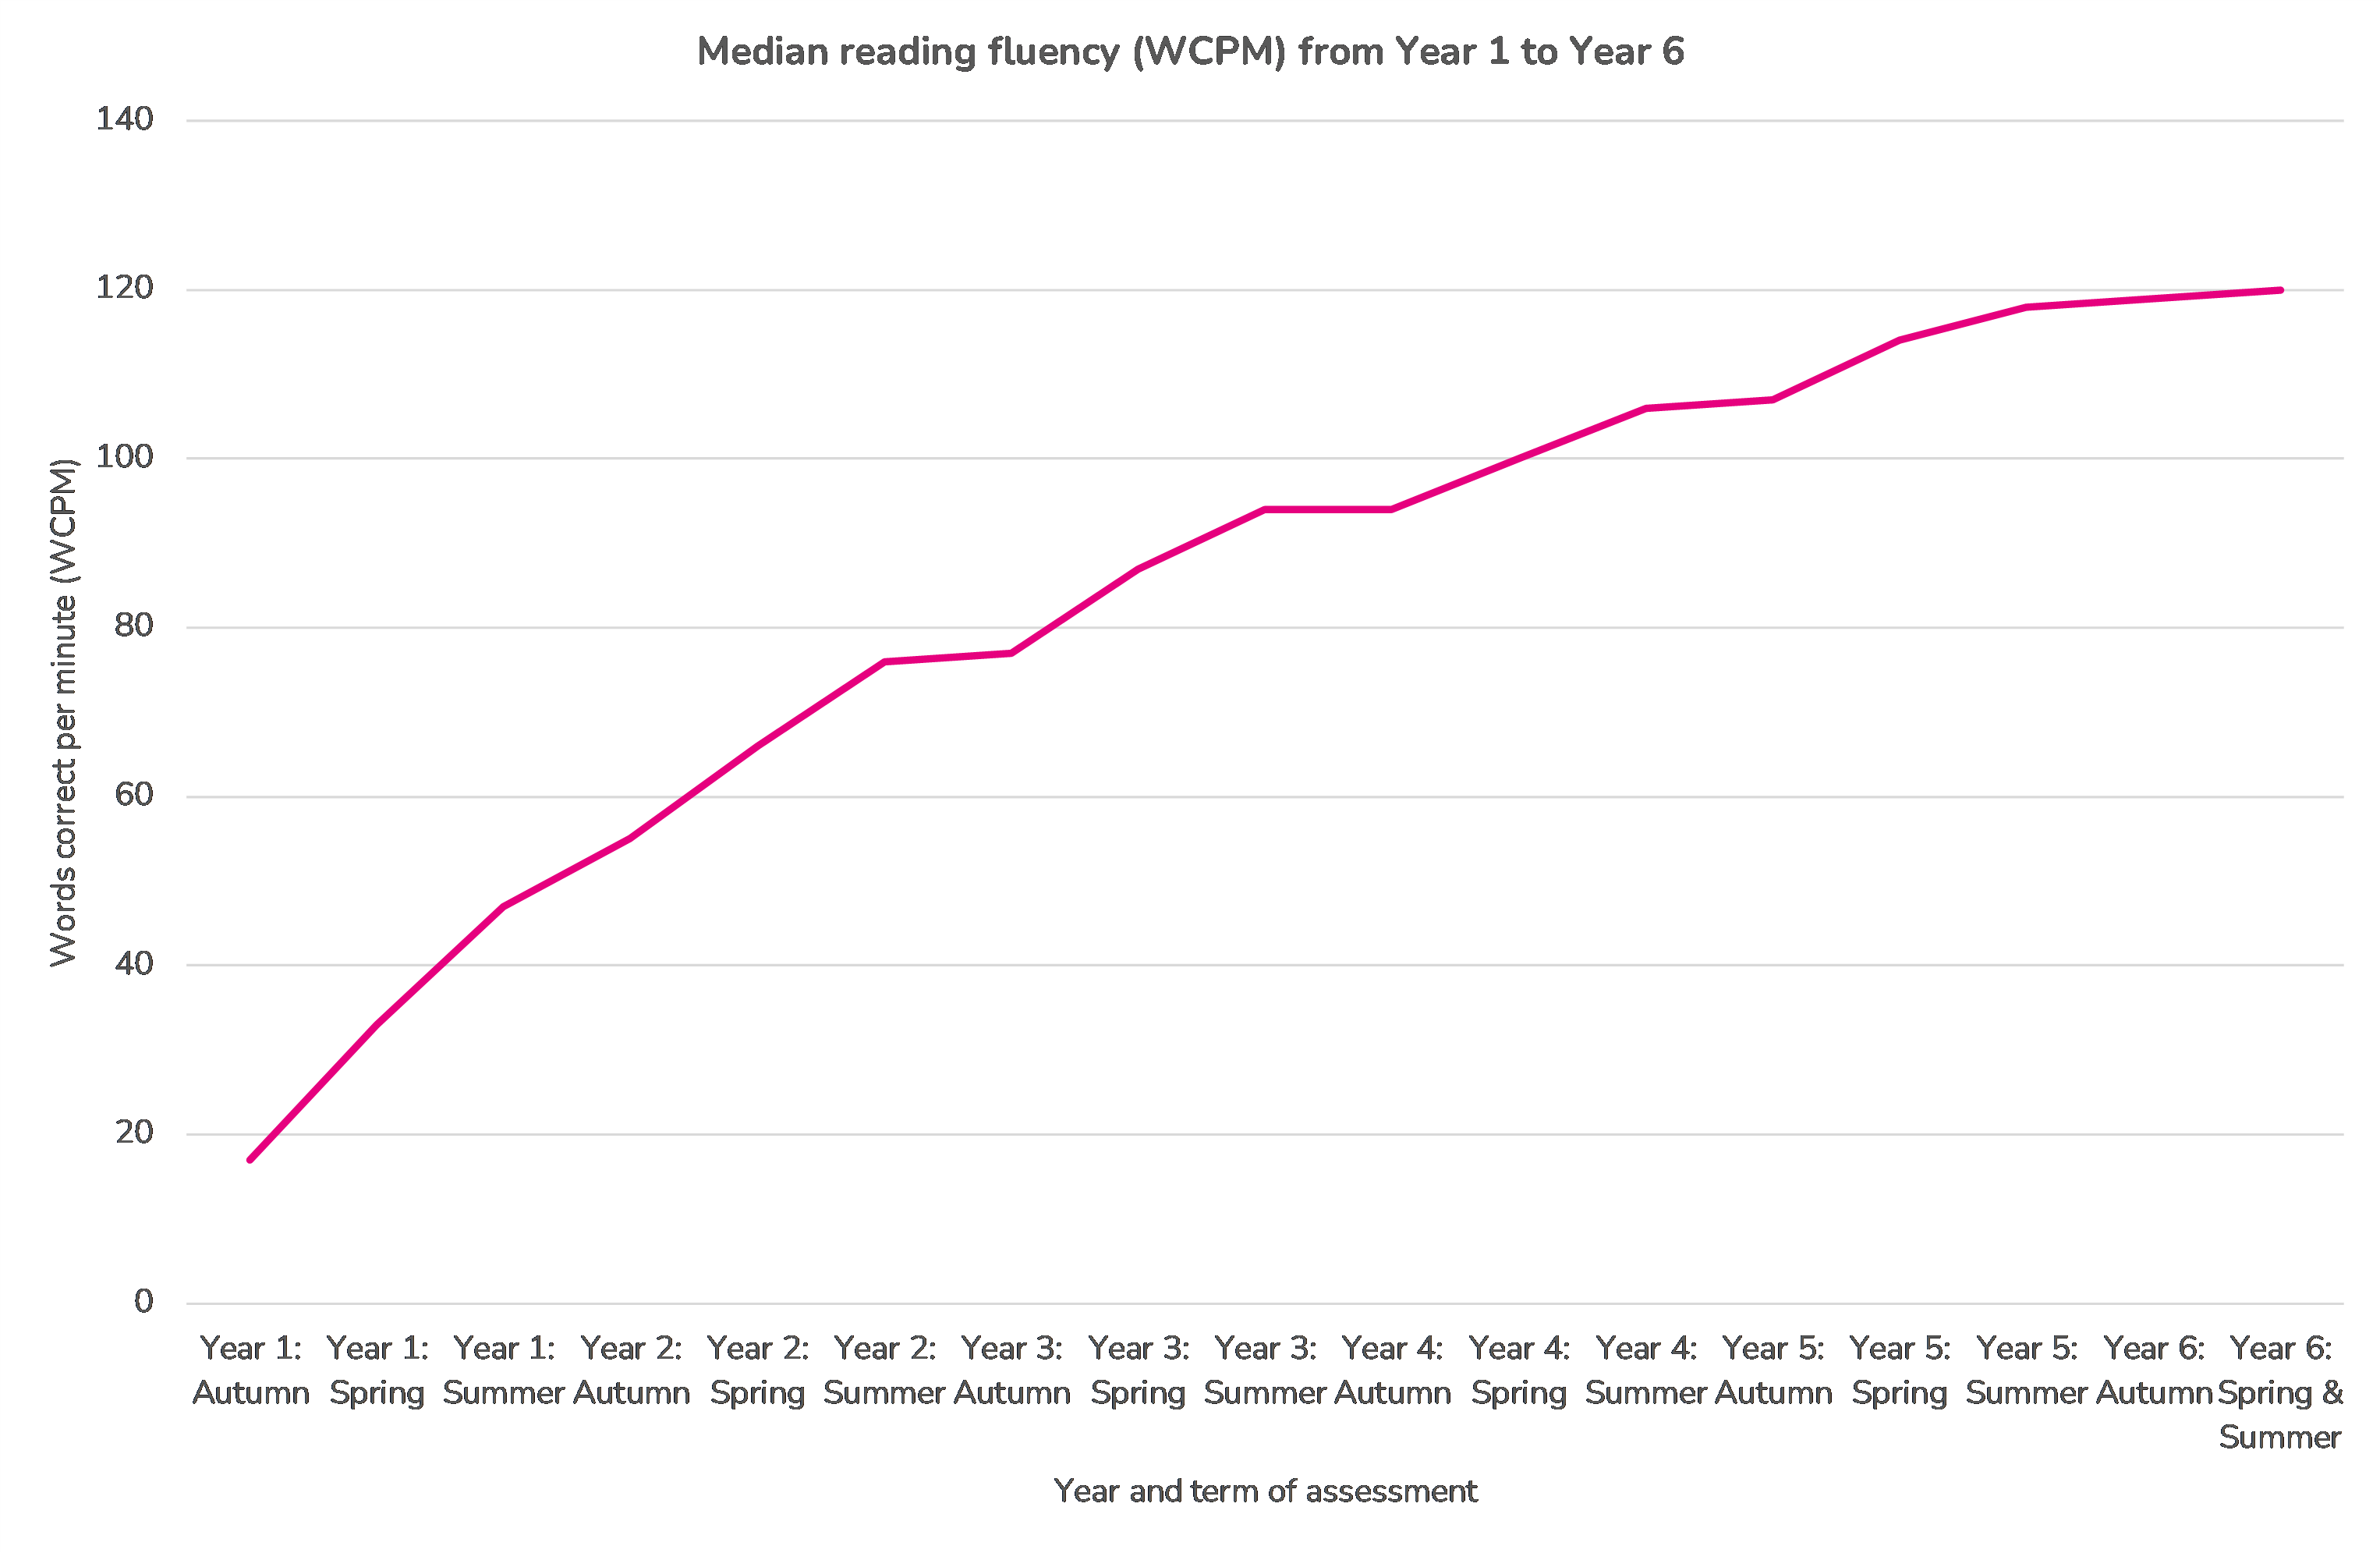
Median reading fluency increases from 16 WCPM in Autumn of Year 1 to 118 WCPM in Spring/Summer of Year 6.
Although the reading fluency of the median pupil generally increases each term, there is some plateauing between Summer and Autumn after both Year 2 and Year 3.
Fluency among White working class children
We divide all the pupils in our sample into four groups:
- Disadvantaged White pupils
- Disadvantaged pupils from other ethnic backgrounds
- Non-disadvantaged White pupils
- Non-disadvantaged pupils from other ethnic backgrounds
Of course, we don’t know who is working class. As is common, we use disadvantaged pupils, those eligible for free school meals in the last six years[2], as a proxy.
And as we’ve pointed out before, most recently here, disadvantaged Black Caribbean and Mixed White/ Black Caribbean pupils have similarly poor outcomes to disadvantaged White pupils.
Leaving those caveats to one side, we show median reading fluency from Year 1 to Year 6 for our 4 groups.
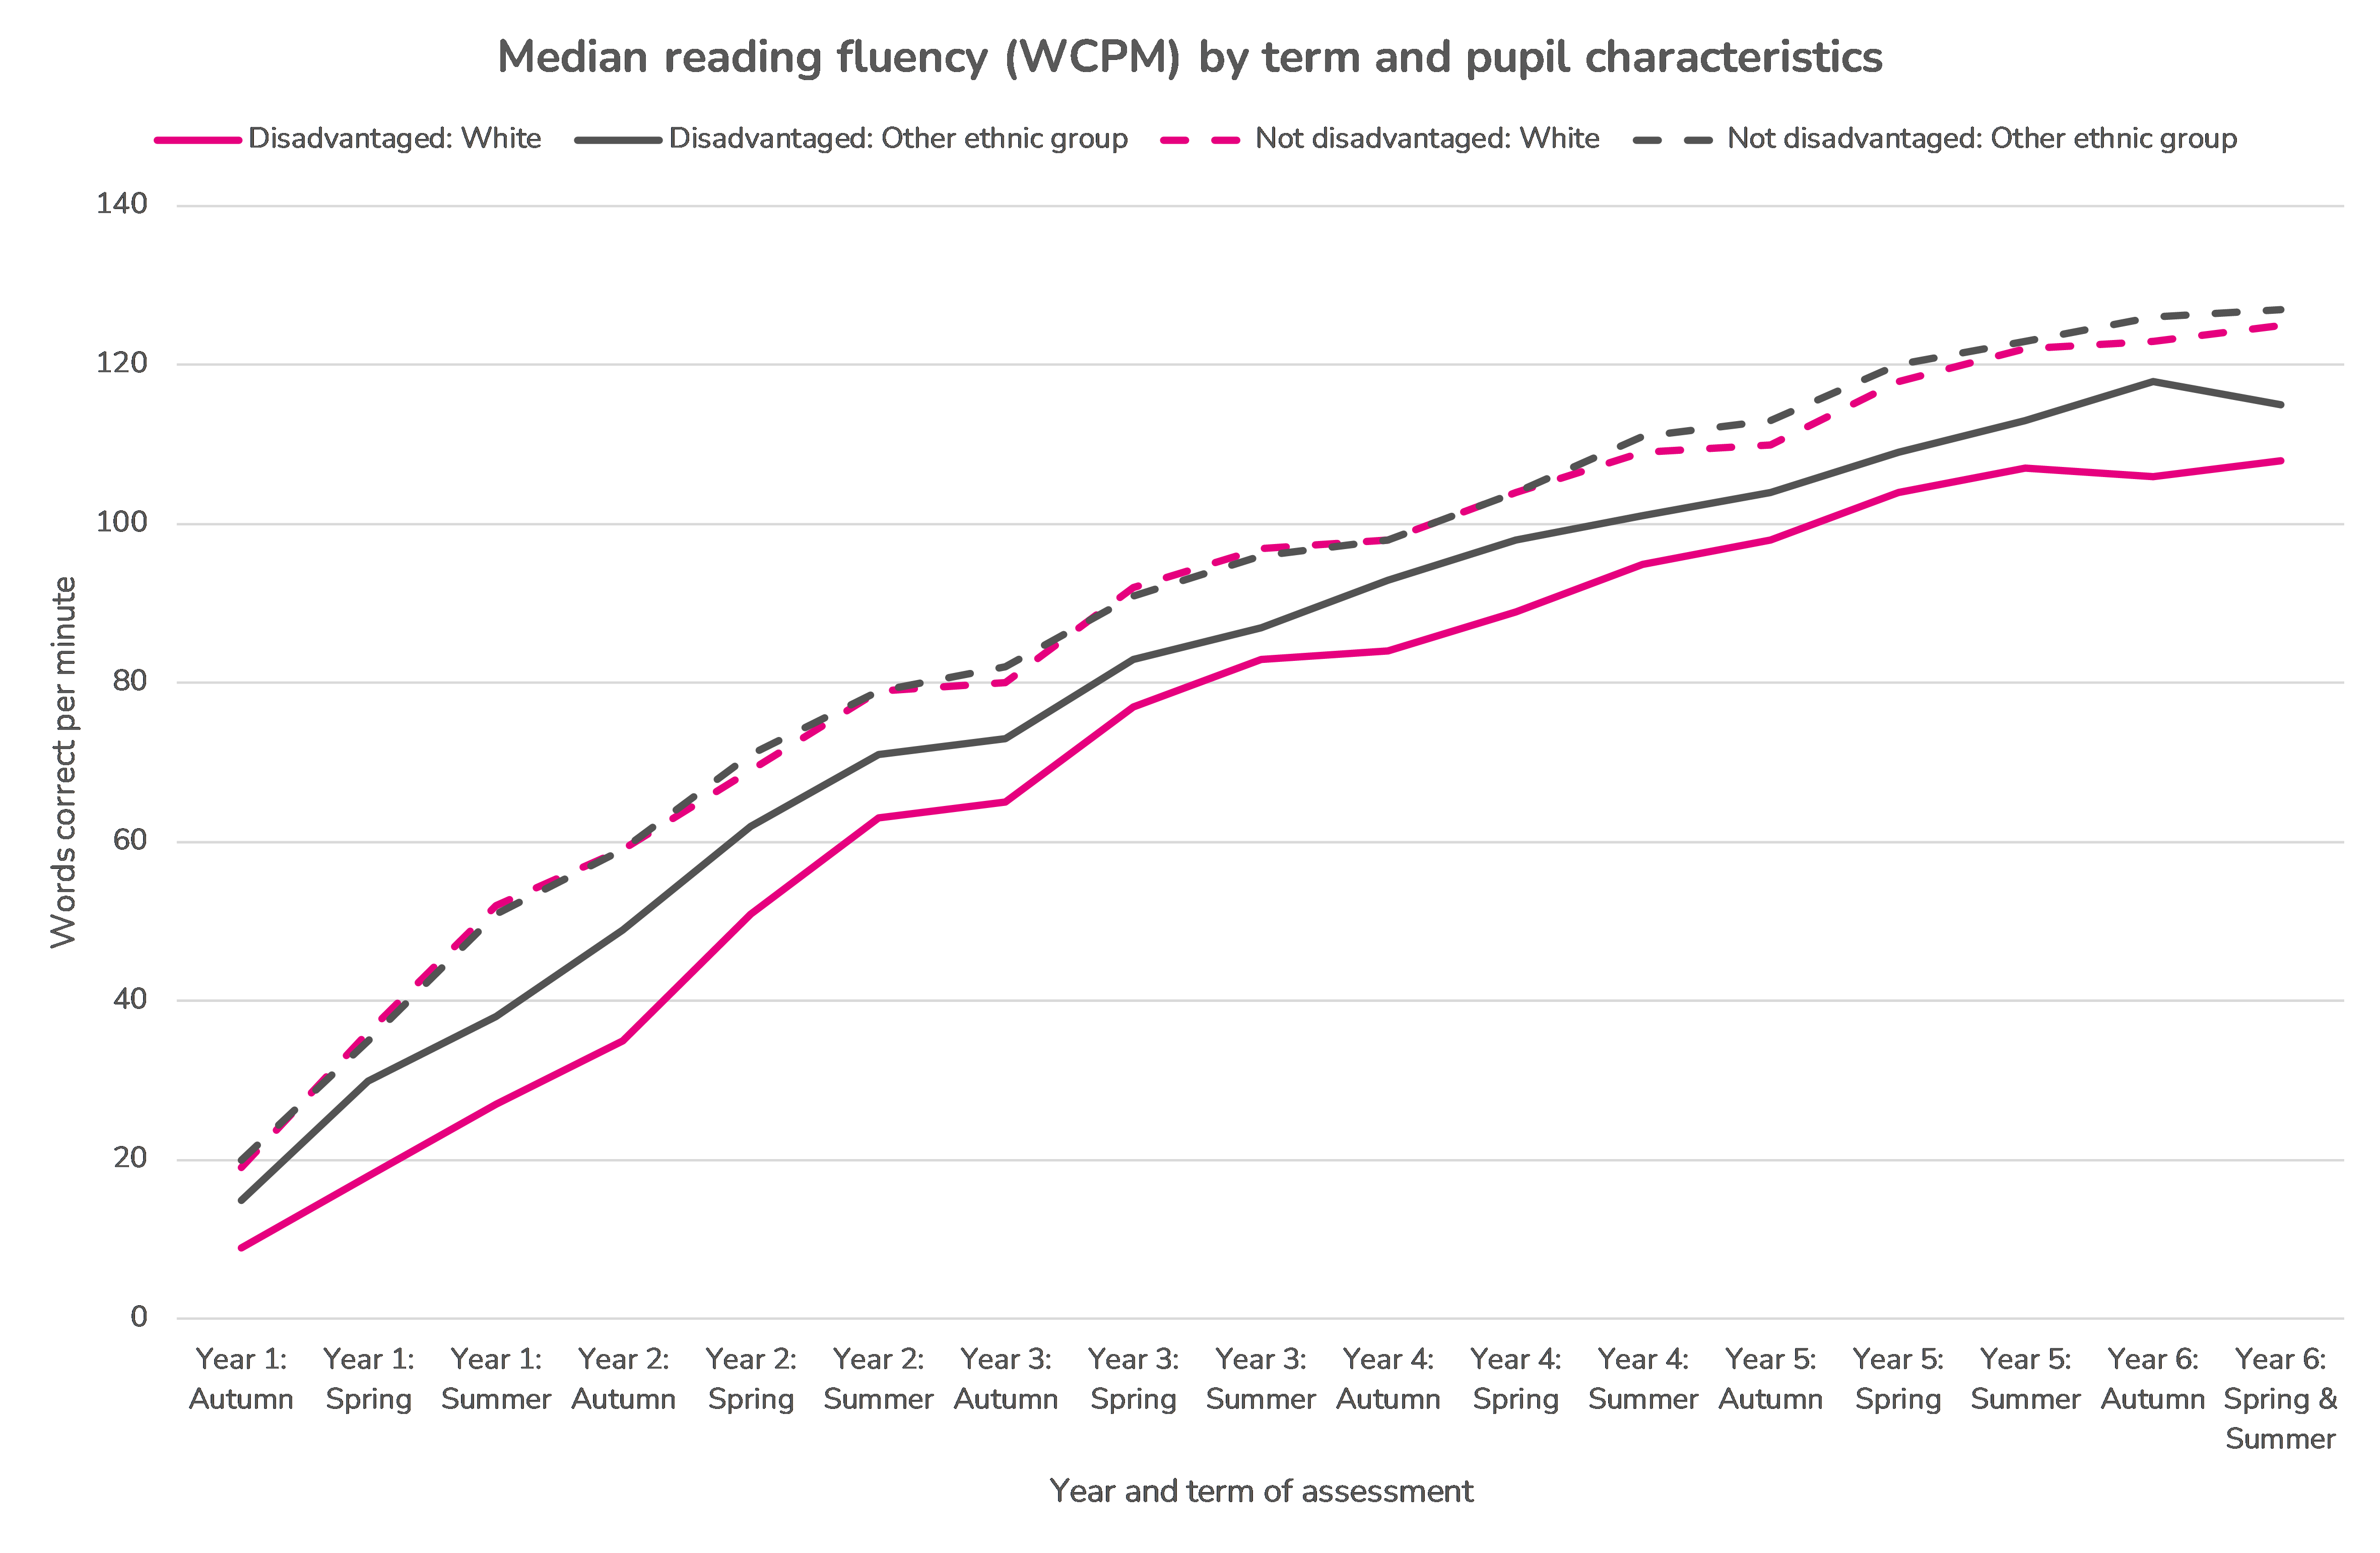
There is a large and consistent gap in reading fluency for White disadvantaged pupils compared to other disadvantaged pupils and non-disadvantaged pupils throughout primary school from Year 1 to Year 6.
By contrast to disadvantaged pupils, there is little difference in median reading fluency between the two broad ethnic groups among non-disadvantaged pupils. That said, a more granular analysis of ethnic groups would be instructive.
How many White working class pupils struggle with reading fluency?
Just like with the Key Stage 2 reading test, there is no simple cut-off we can use to separate those that can read fluently from those who can’t.
As a proxy, we define pupils who read at less than 90 WCPM by the end of Year 6 as having poor reading fluency. This is roughly the median level of fluency of pupils in Spring/ Summer of Year 3.
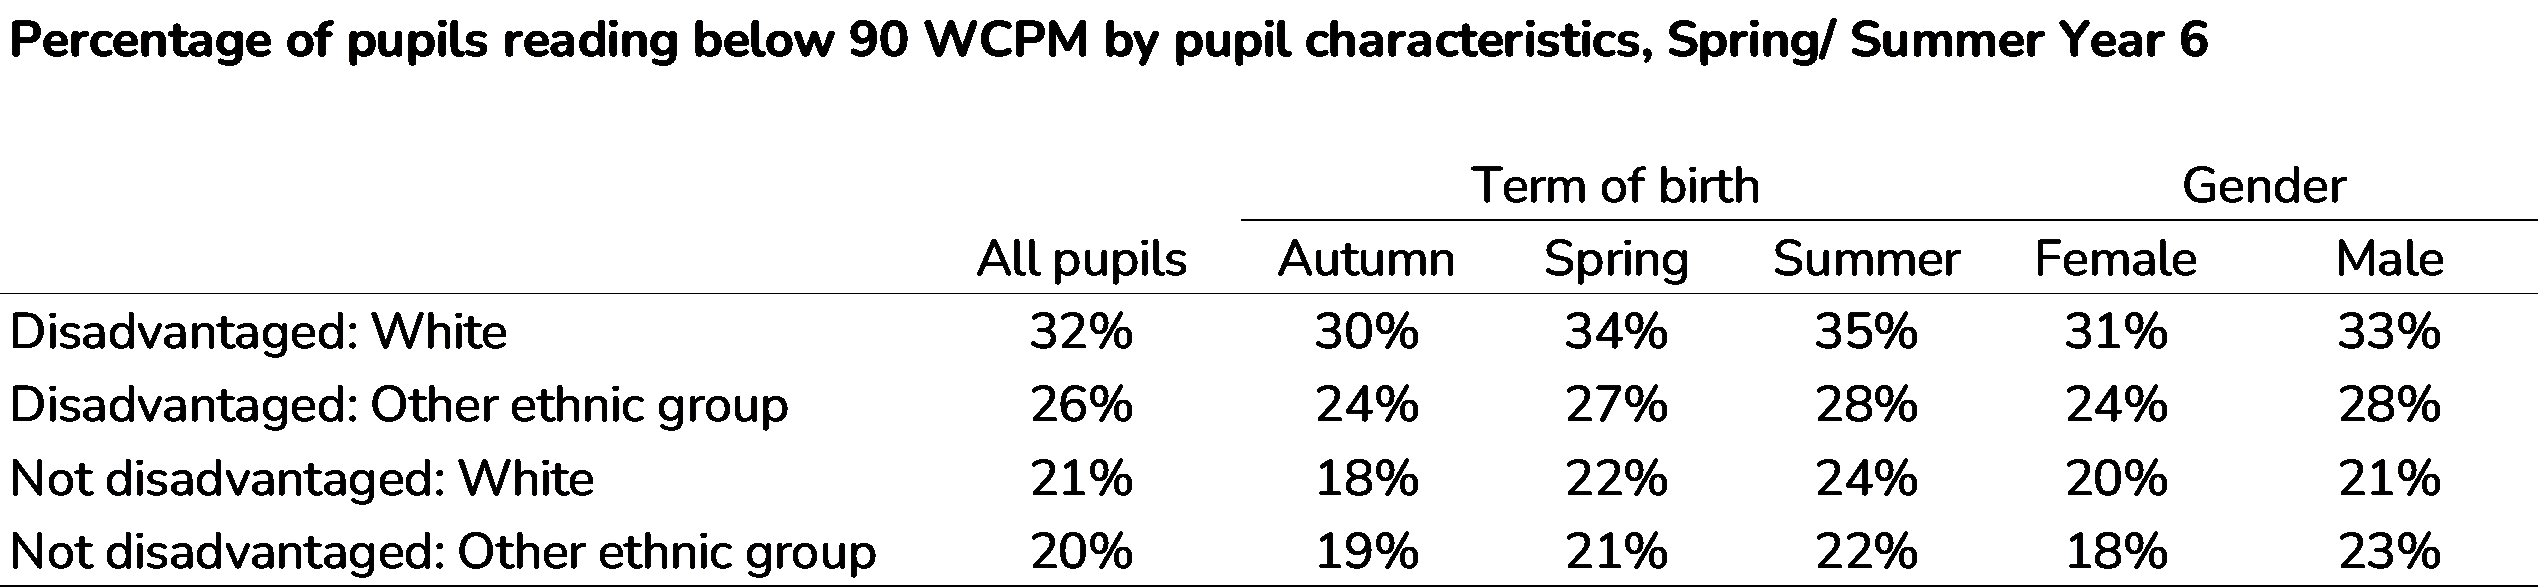
A third (33%) of White disadvantaged pupils have poor reading fluency (below 90 WCPM) in Year 6 compared to just a fifth (20%) for non-disadvantaged pupils.
Perhaps surprisingly, gender does not appear to make a difference. Boys and girls who are White/disadvantaged have broadly the same reading fluency. By the end of Year 6 a third of both boys and girls had poor reading fluency.
However, term of birth does make a bit of a difference. 35% of summer born White disadvantaged pupils have poor fluency compared to 30% for autumn born.
Summing up
Based on data from the FFT Reading Assessment Programme, the recommendation of the Inquiry into White working class educational outcomes to improve reading fluency has some merit.
By the end of Year 6, a third of White disadvantaged pupils read at the level of a median Year 3 pupil or below. This compares to 20% of non-disadvantaged pupils from other ethnic groups.
- Grapheme-Phoneme Correspondence
- Strictly speaking anyone ever eligible for free school meals since April 2018 is included due to transitional protections
Want to stay up-to-date with the latest research from FFT Education Datalab? Sign up to Datalab’s mailing list to get notifications about new blogposts, or to receive the team’s half-termly newsletter.


Leave A Comment