How does your school’s attendance and attainment compare?
This blog looks at national patterns. The FFT Primary Early Results Service lets primary schools see the same picture for their own 2026 pupils — KS2 scaled scores broken down by attendance band, alongside class, pupil group and individual pupil reports. Reports are available before the end of summer term. Free to all FFT Aspire schools.
Find out more: fft.org.uk/fft-aspire/primary-results
In this article we do three things:
- We examine the relationship between Key Stage 2 attainment and absence over (almost) the whole of primary school.
- We show the importance of considering context when interpreting absence data alongside attainment data.
- We identify some profiles of absence from Year 2 to Year 6 that are associated with low attainment, even when context is accounted for.
Data
We use Key Stage 2 data for 2025 from the National Pupil Database (NPD). We include all 653,000 pupils at state-funded mainstream and special schools.
We focus on scaled scores in reading and maths tests. For pupils who do not take the tests (due to working at a lower level), we use pseudo-scaled scores based on teacher assessment using the methodology used when calculating Key Stage 1 to Key Stage 2 value added.
In addition, we match pupils to their attendance (absence) history each year from Year 2 (2020/21) to Year 6 (2021/25), as well as absence for the whole period from Year 2 to Year 6. Data for Year 1 (2019/20) was not collected due to the Covid-19 pandemic, and data for the Reception year was not collected. Absence data for Reception aged pupils only began to be collected in NPD in 2023/24.
In addition to analysing scaled scores in reading and maths, we also calculate contextual value added (CVA) scores. These scores reflect how different pupils’ reading and maths scores are to those of similar pupils.
The factors we control for are:
- EYFSP total score
- Sex
- Month of birth
- Disadvantage (eligible for free school meals in the last 6 years)
- Ethnic background
- First language (English/ other)
- IDACI score of home postcode
- SEN status at the end of Reception
Attainment and lifetime absence
First of all, we create a number of absence bands based on lifetime (Y2 to Y6) absence and show the number of pupils in each band.
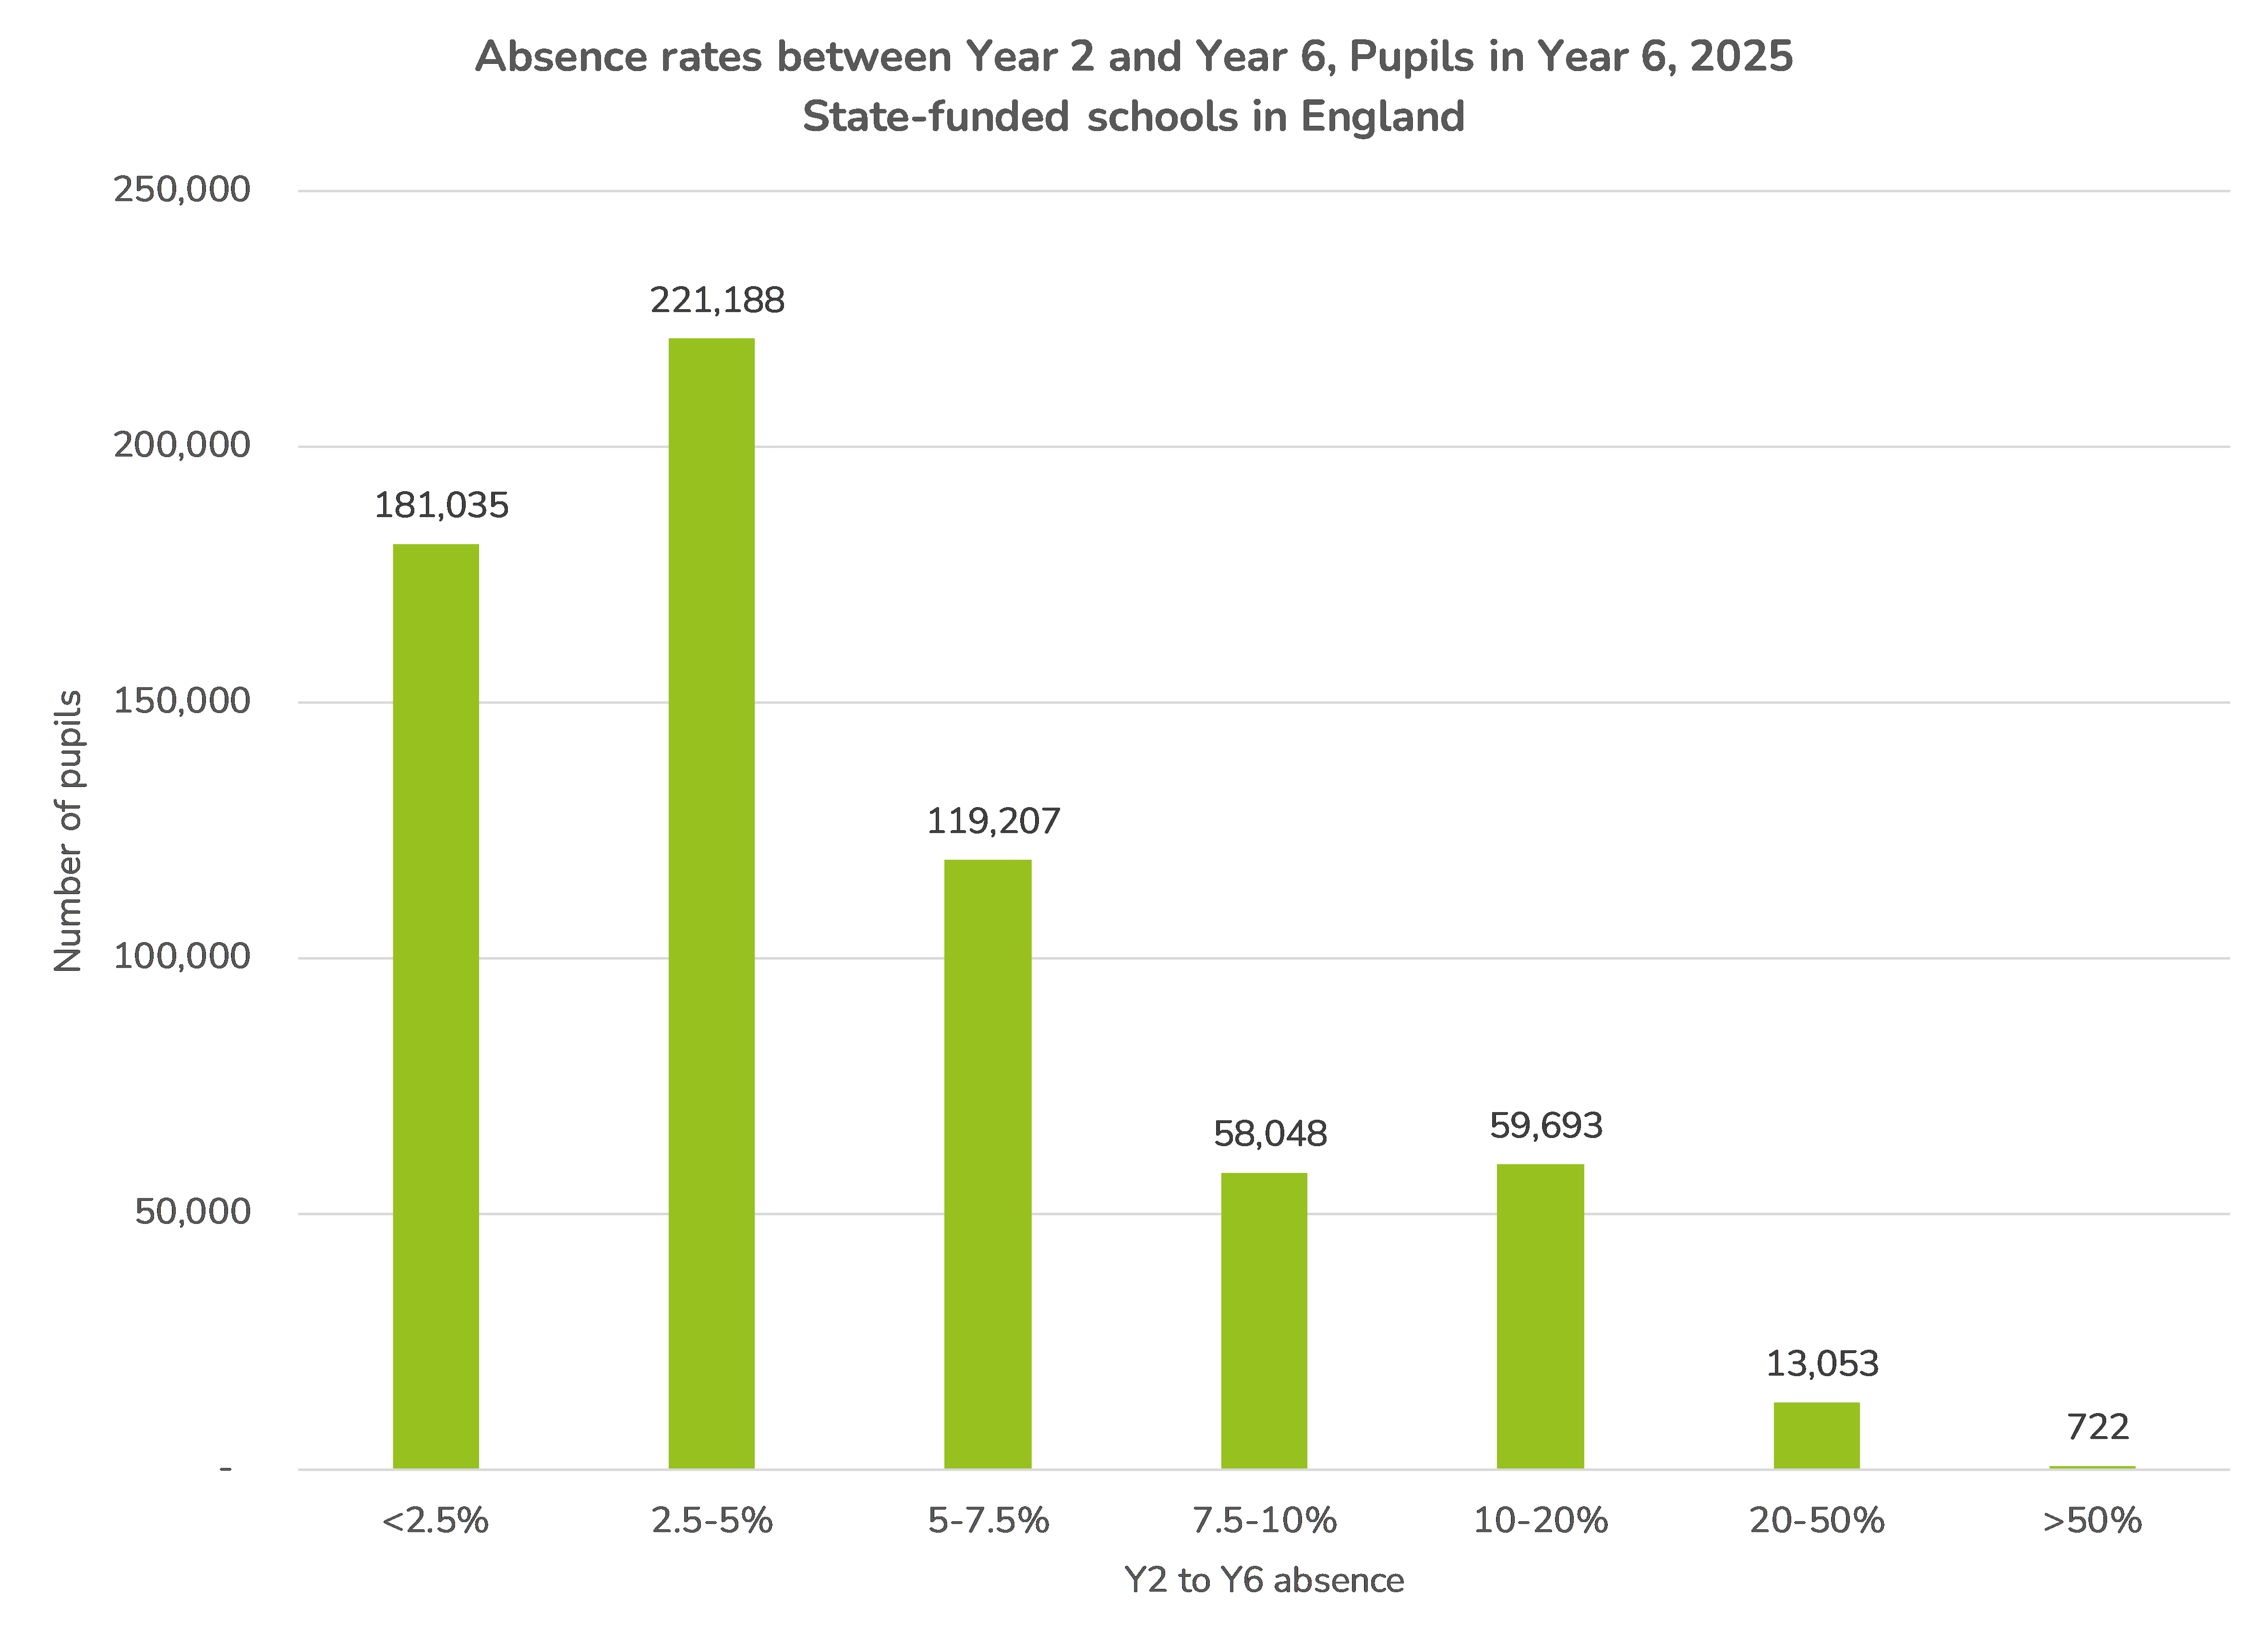
Overall, we see around 11% of pupils to be persistently absent (absent for 10% or more of sessions) over the entire Y2 to Y6 period. Over 60% missed fewer than 5% of sessions.
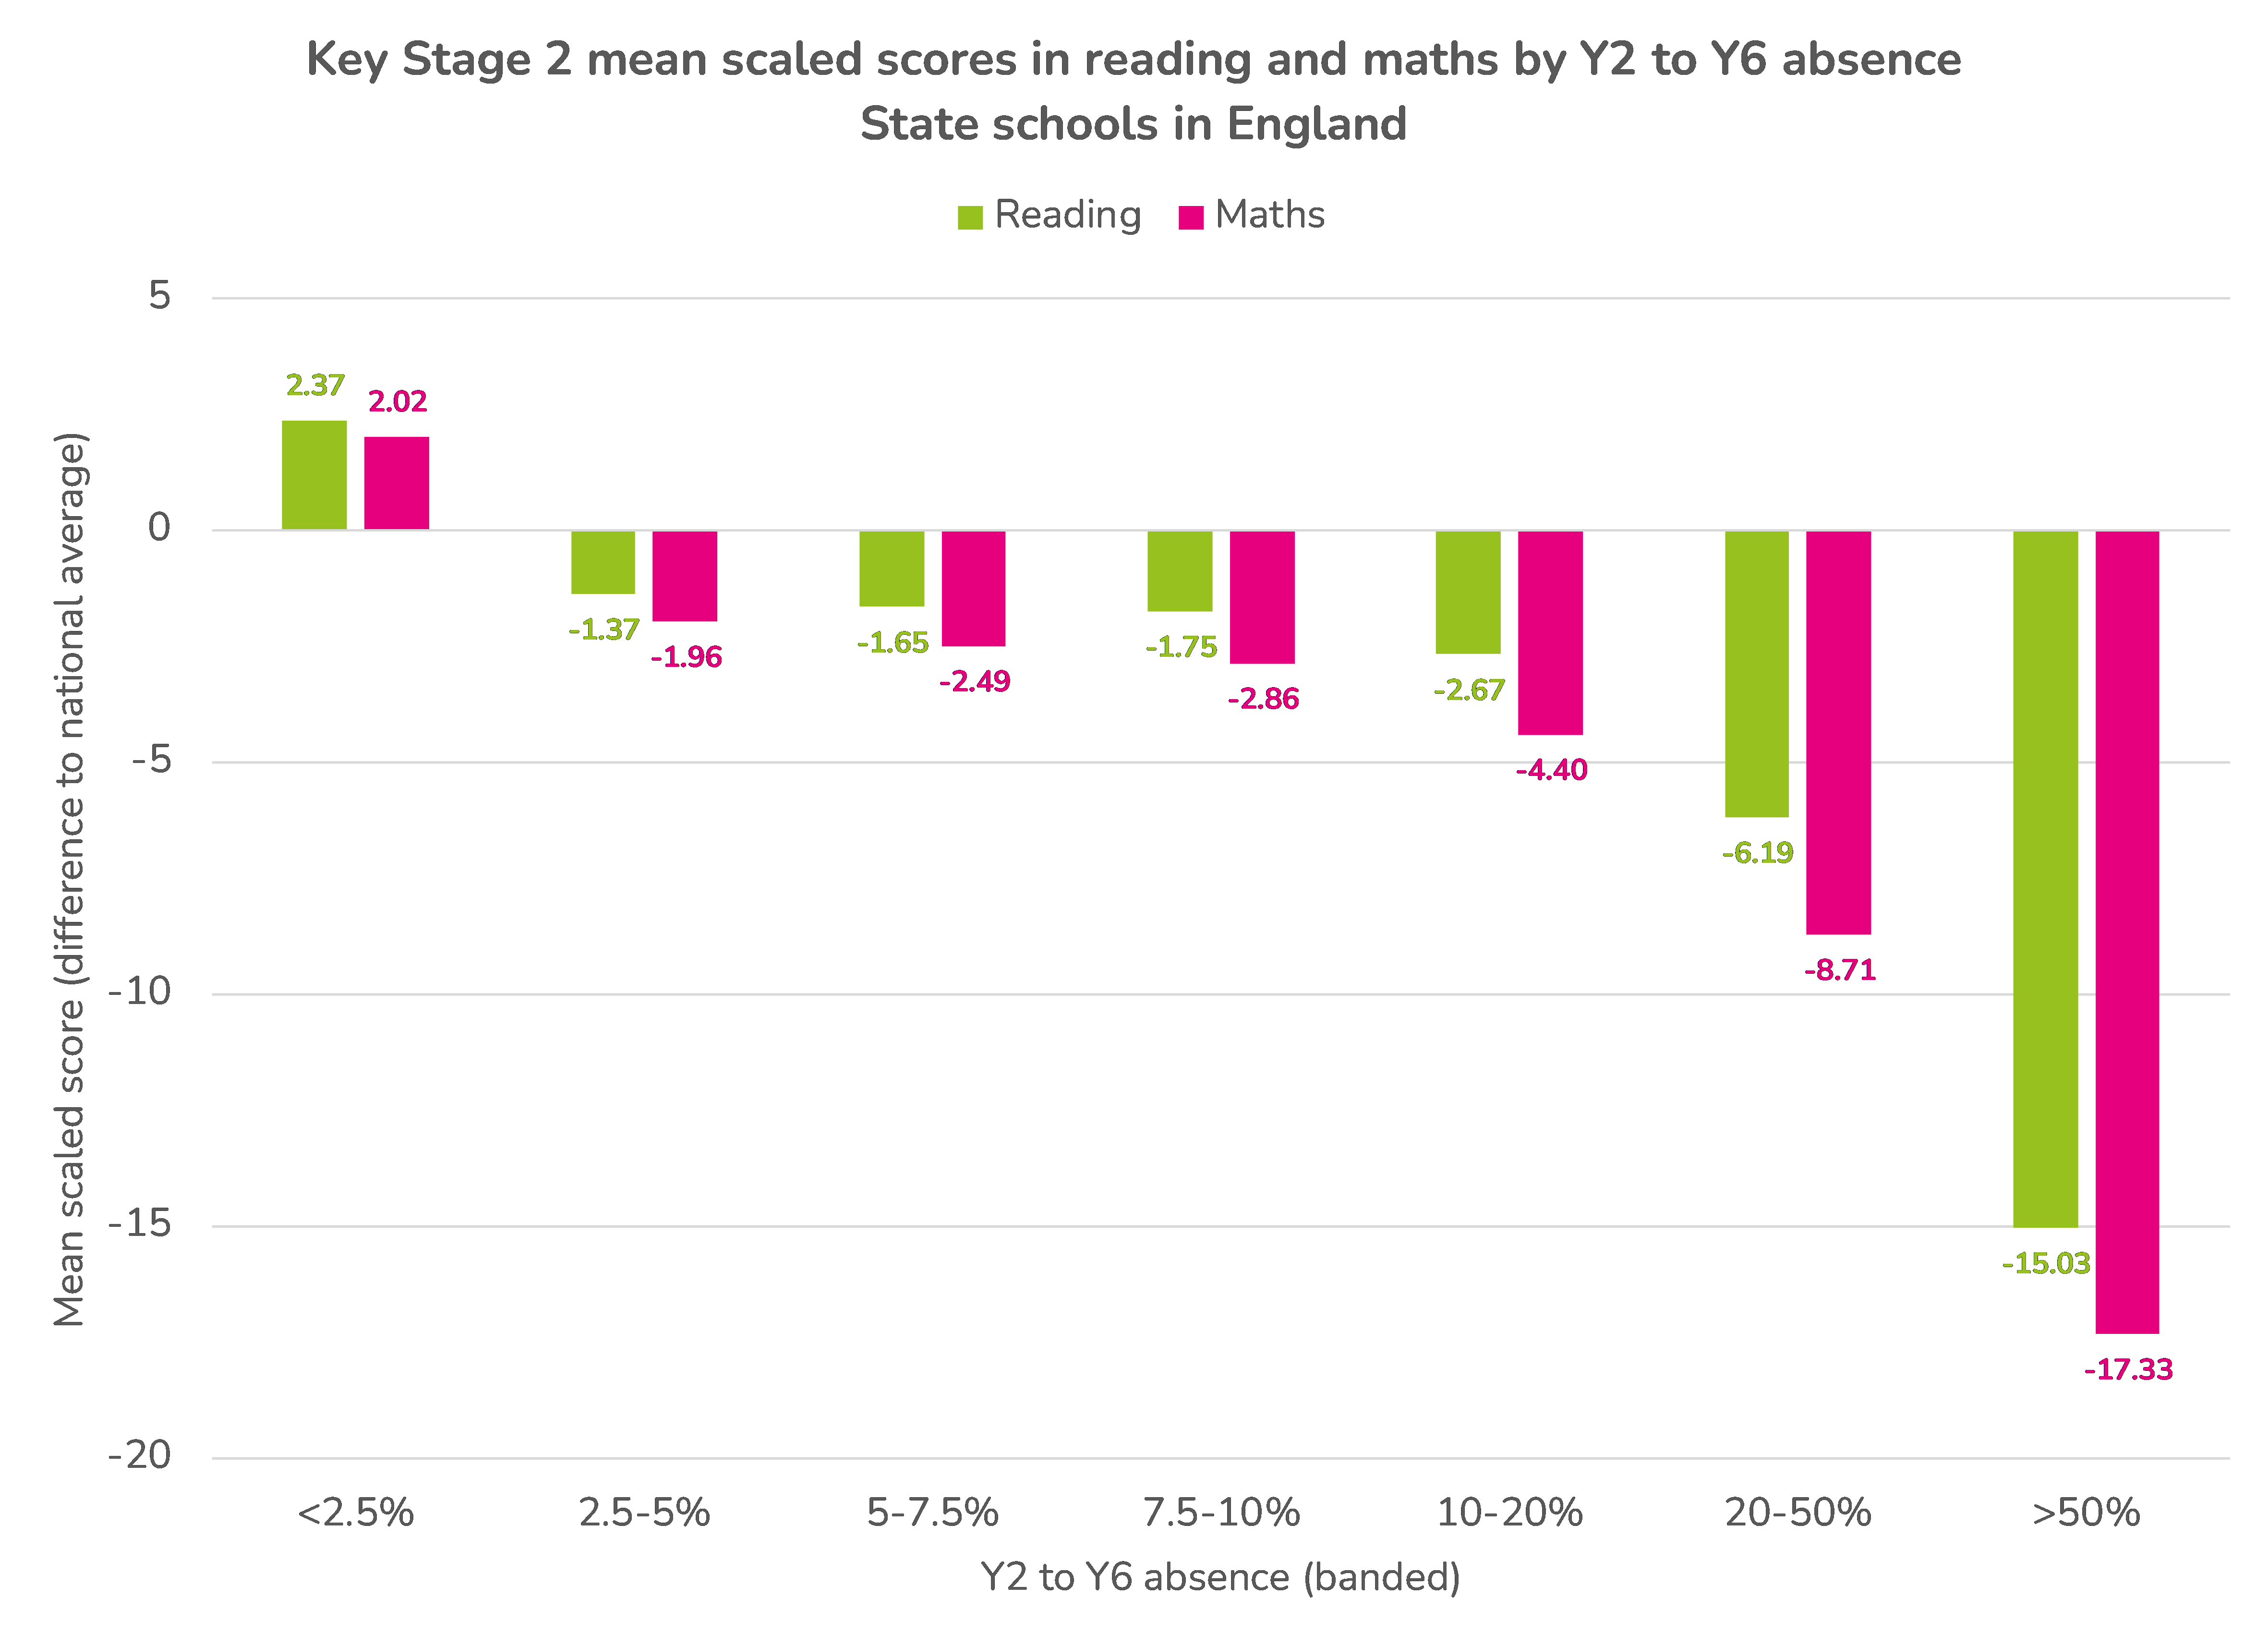
Next, we show attainment for each of the bands.
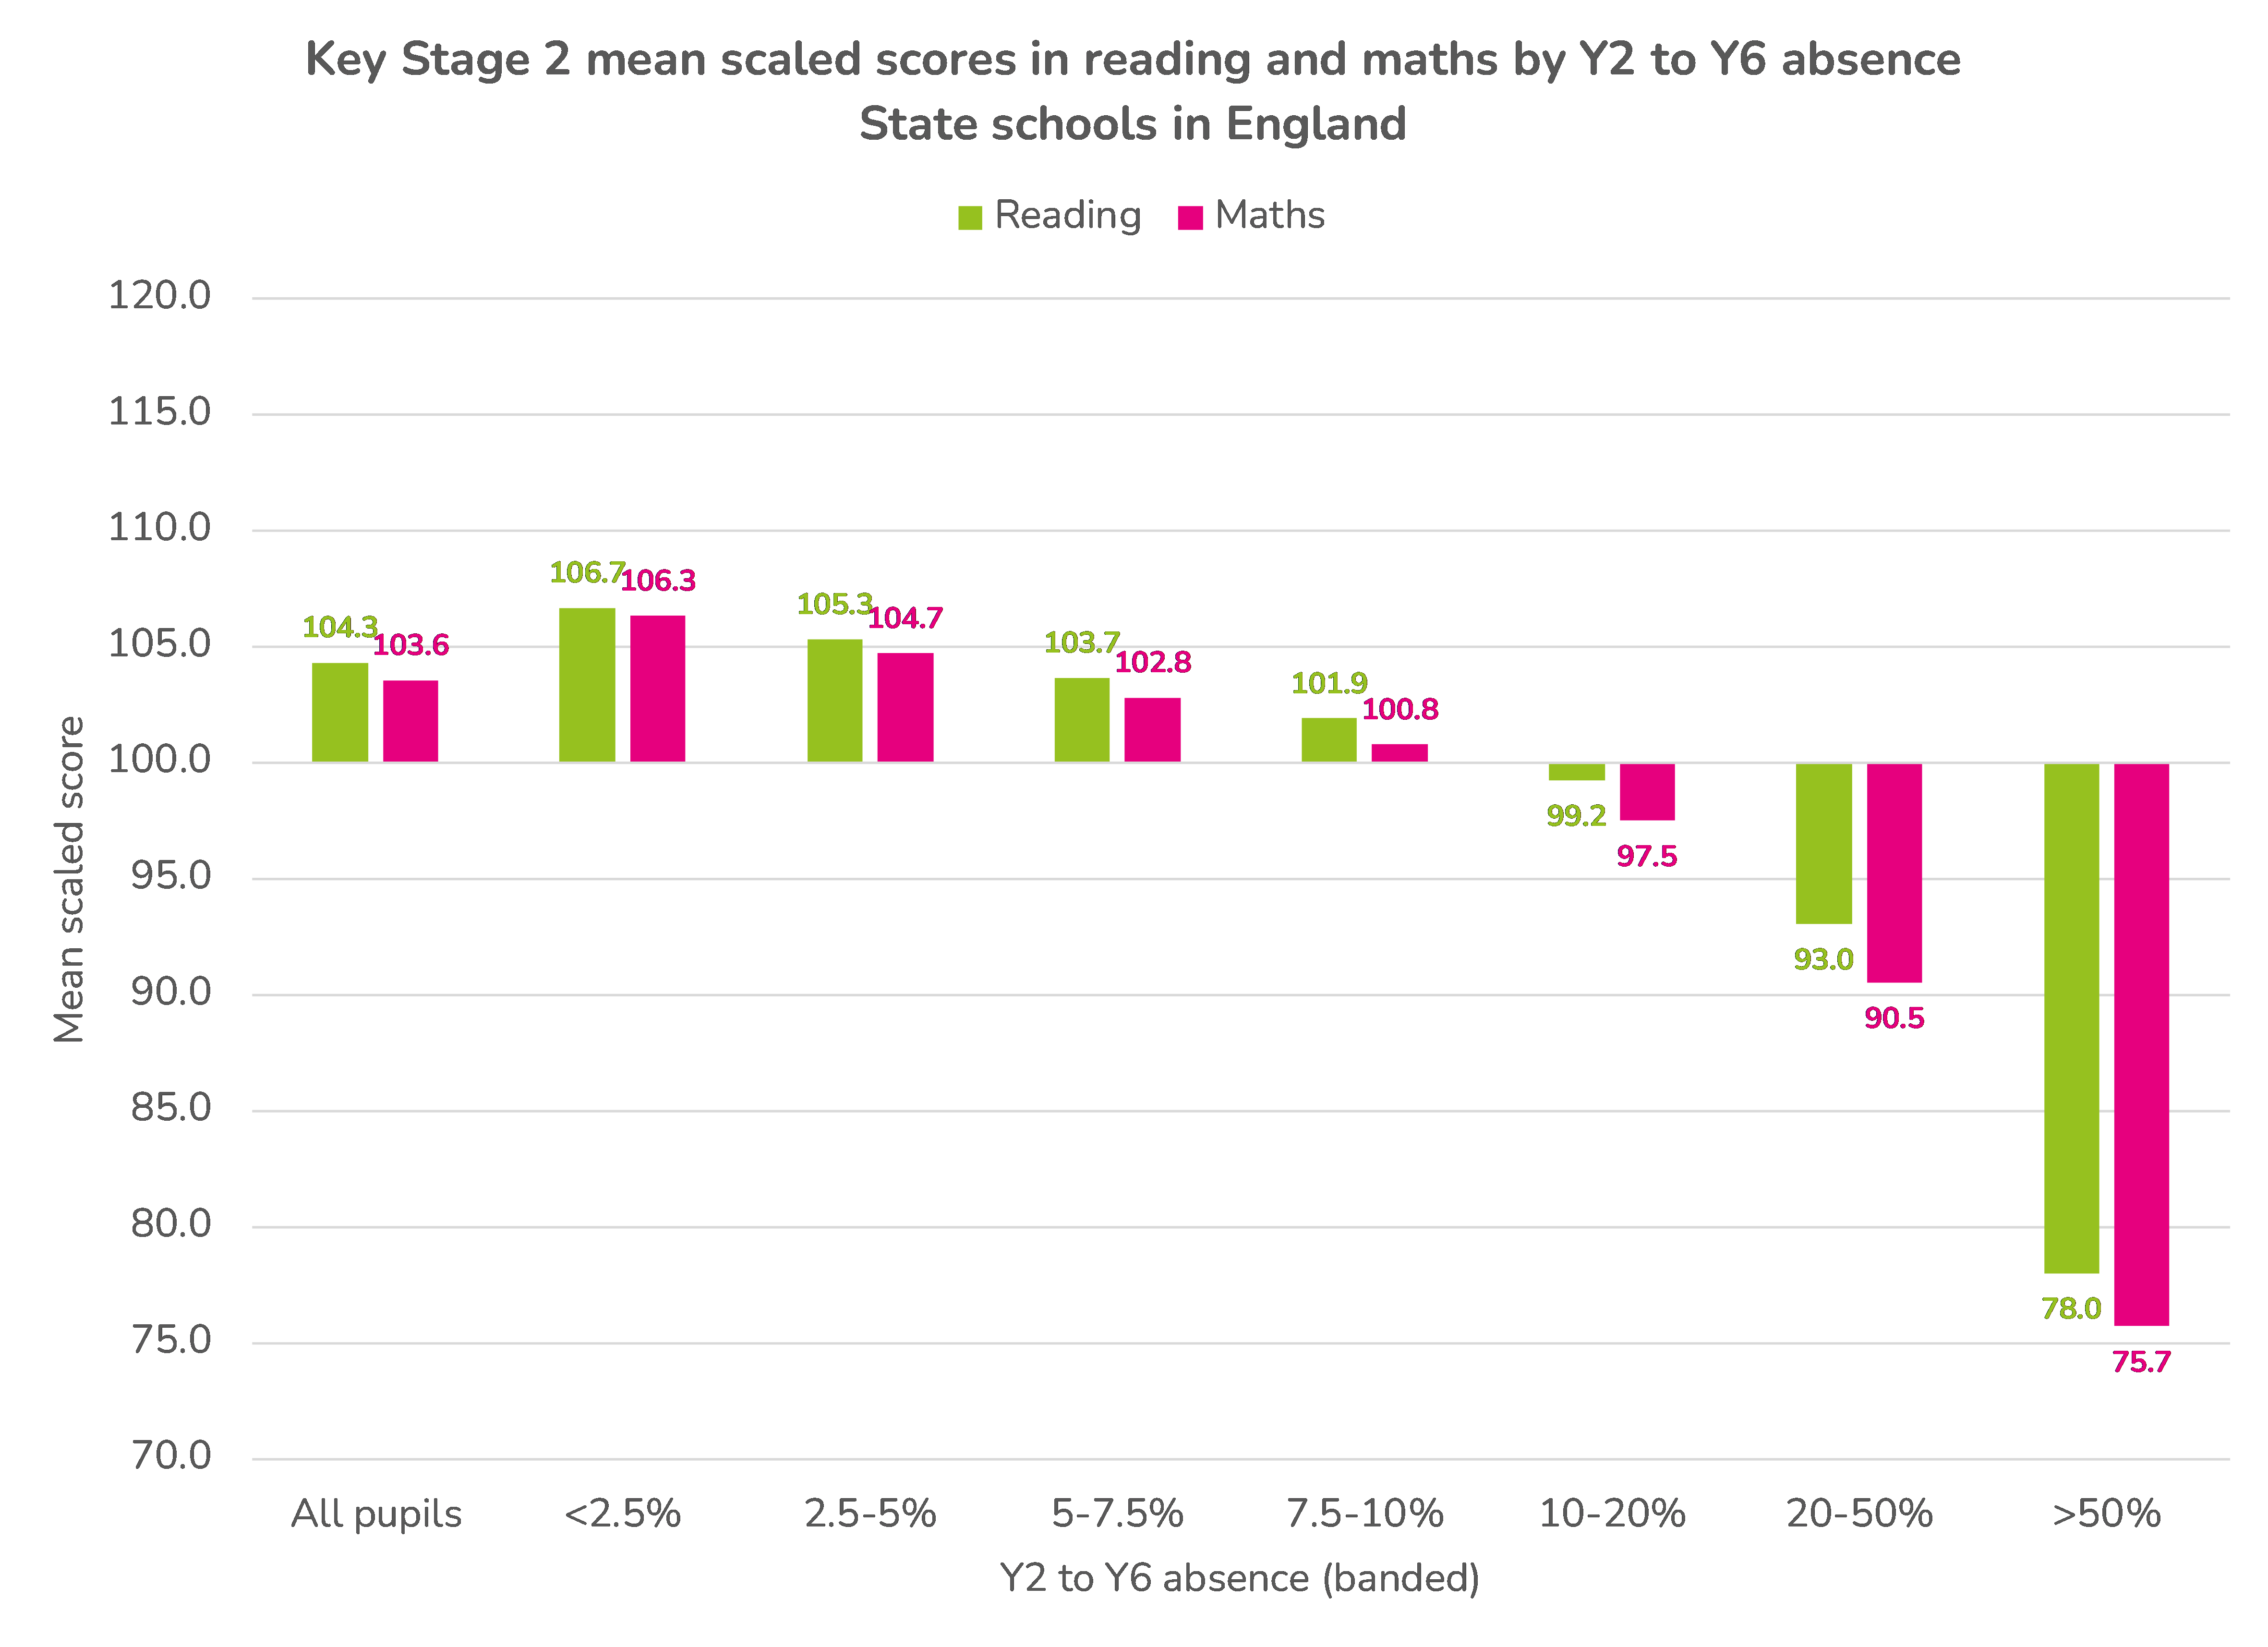
In short, and over-simplifying a complex picture, attainment falls as absence increases.
We can also see how attainment is linked with contemporary absence by showing the relationship between attainment and absence in both Year 5 and Year 6. Note we do not show severe absentees (absent for >50% of sessions) due to small numbers.
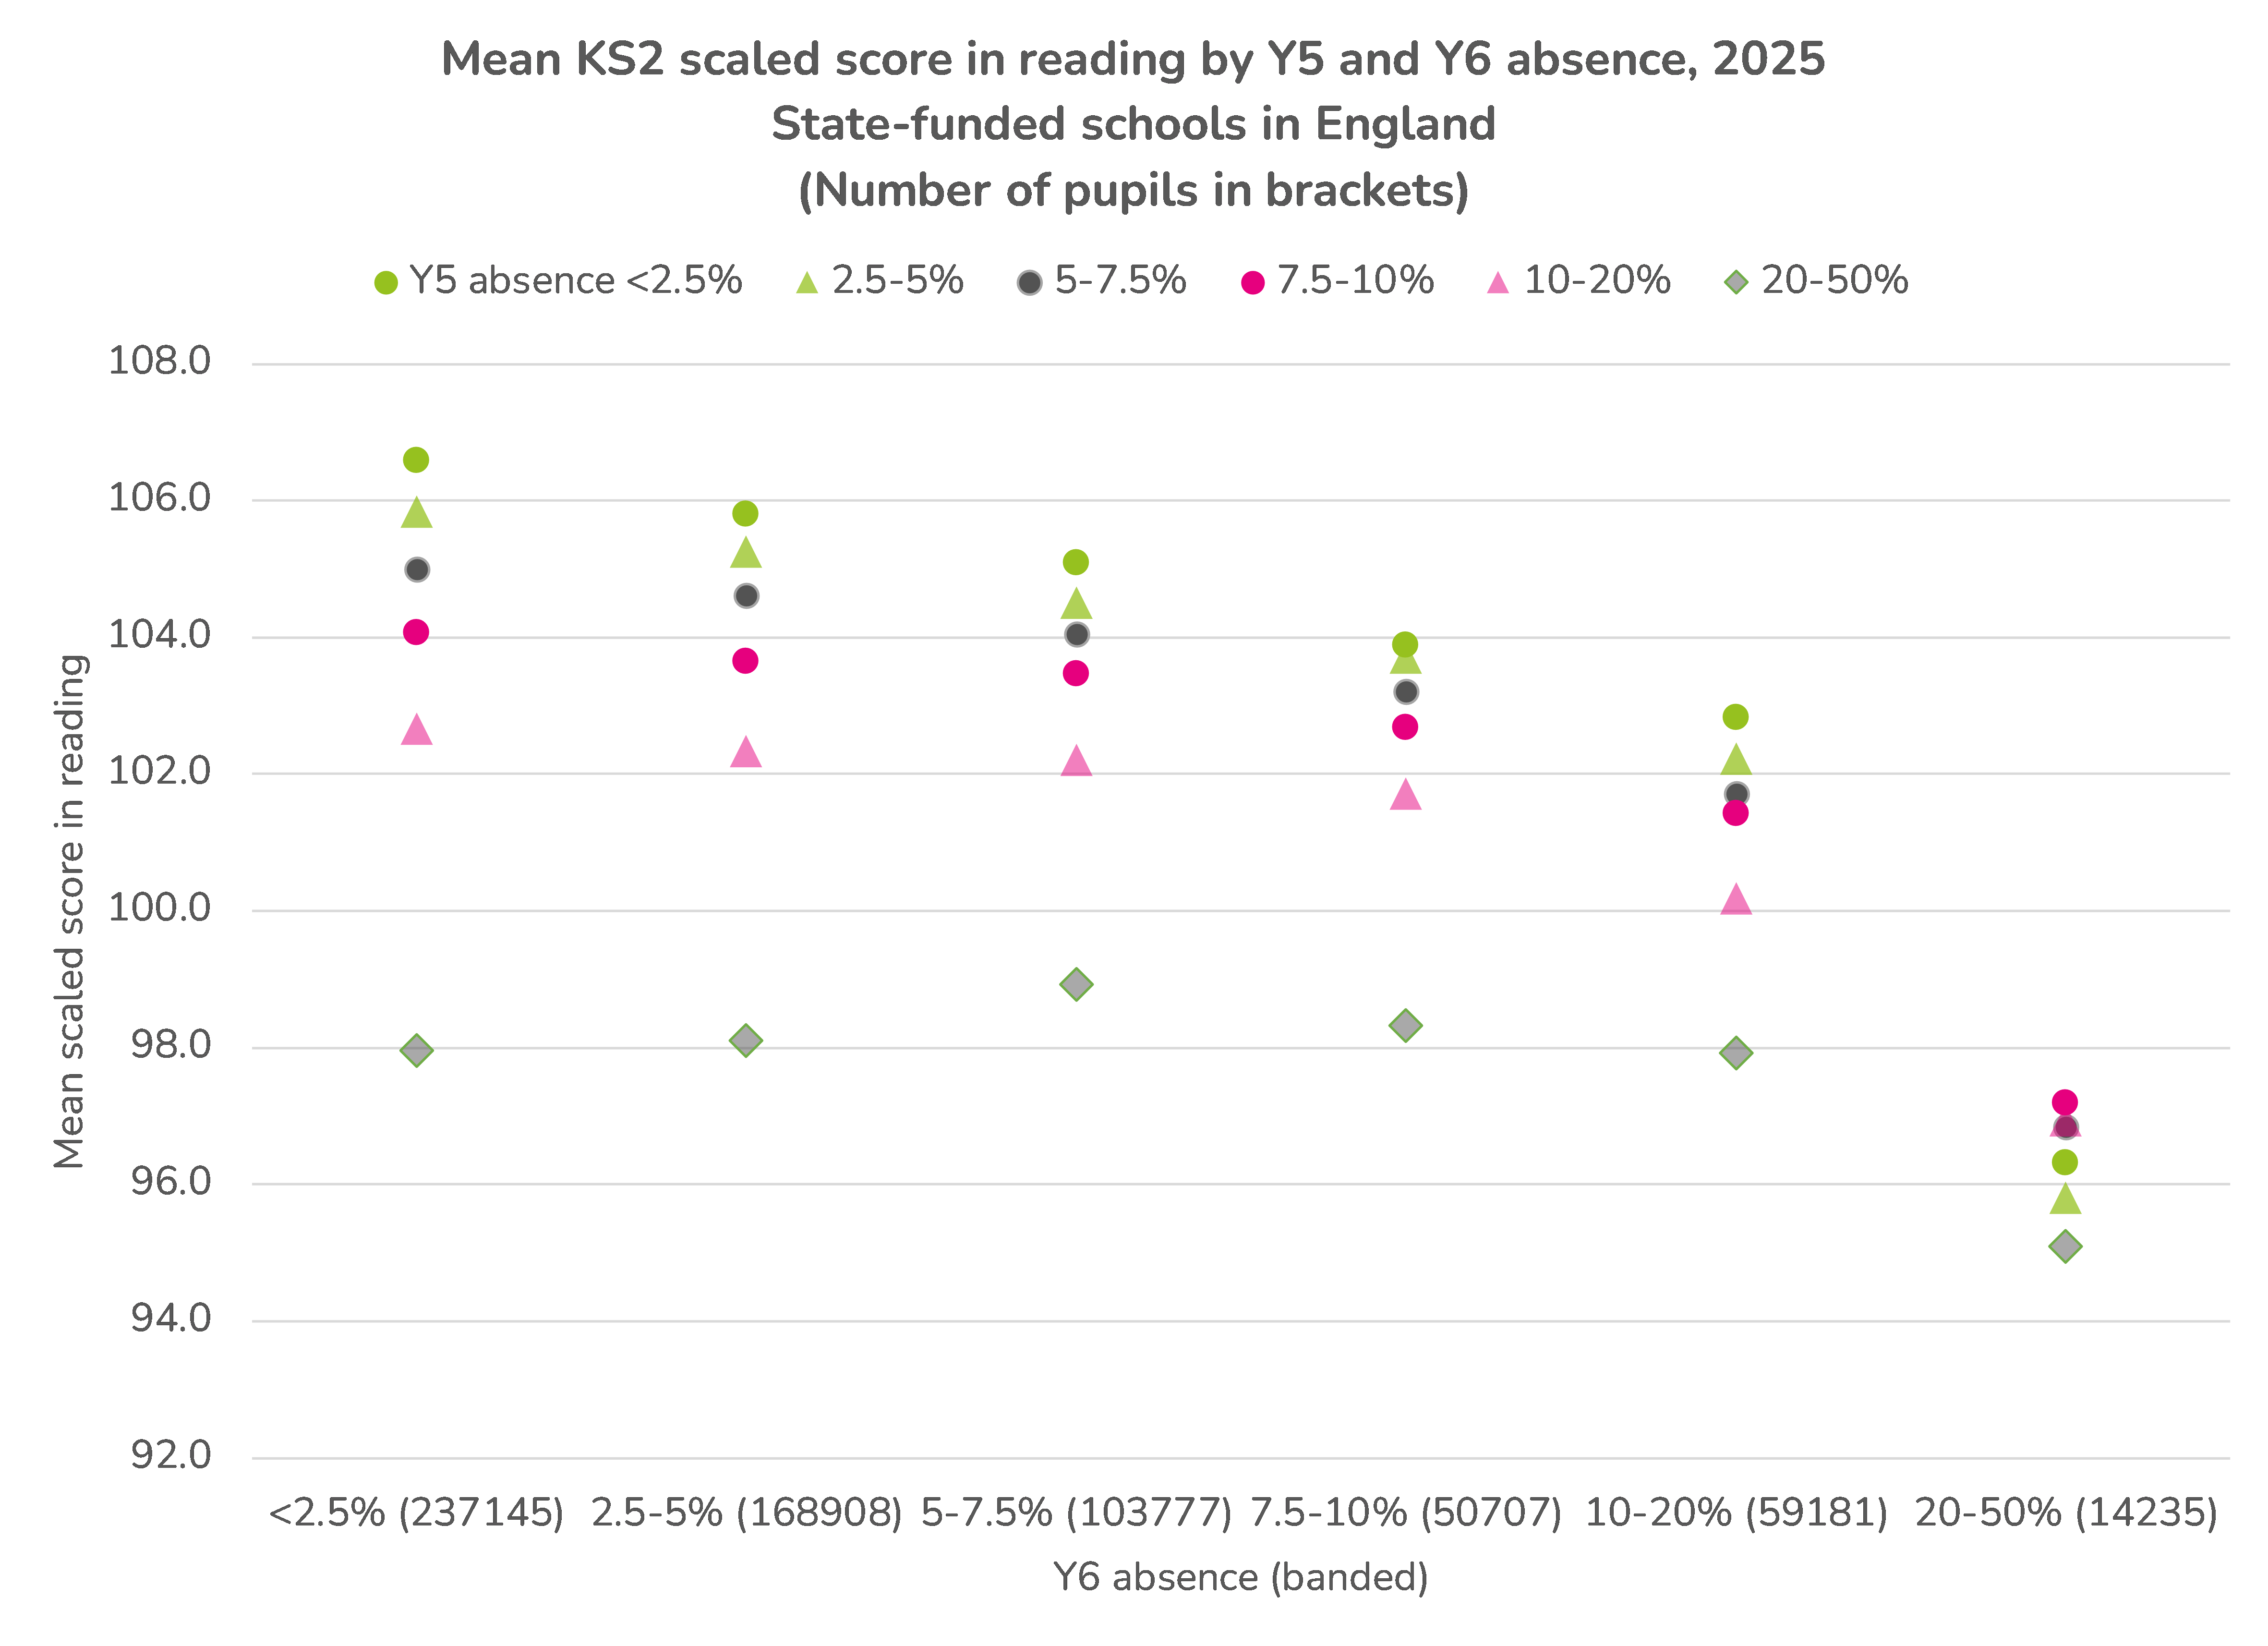
Attainment declines as Year 6 absence increases. But within each Y6 absence band there is a relationship with Year 5 absence. Attainment tends to be low among pupils with a Year 5 absence rate over 20% regardless of their attendance in Year 6. This is a relatively rare group consisting of around 15,000 pupils (2% of the cohort).
The importance of context
Now let’s look at the difference context makes.
Firstly, we look at three key characteristics for each absence band:
- The percentage of pupils who are disadvantaged (FSM6)
- The percentage of pupils with special educational needs in Year 6, met either by SEN Support or an EHC Plan (SEN)
- The percentage of pupils who reached a good level of development at the end of the Early Years Foundation Stage (GLD)
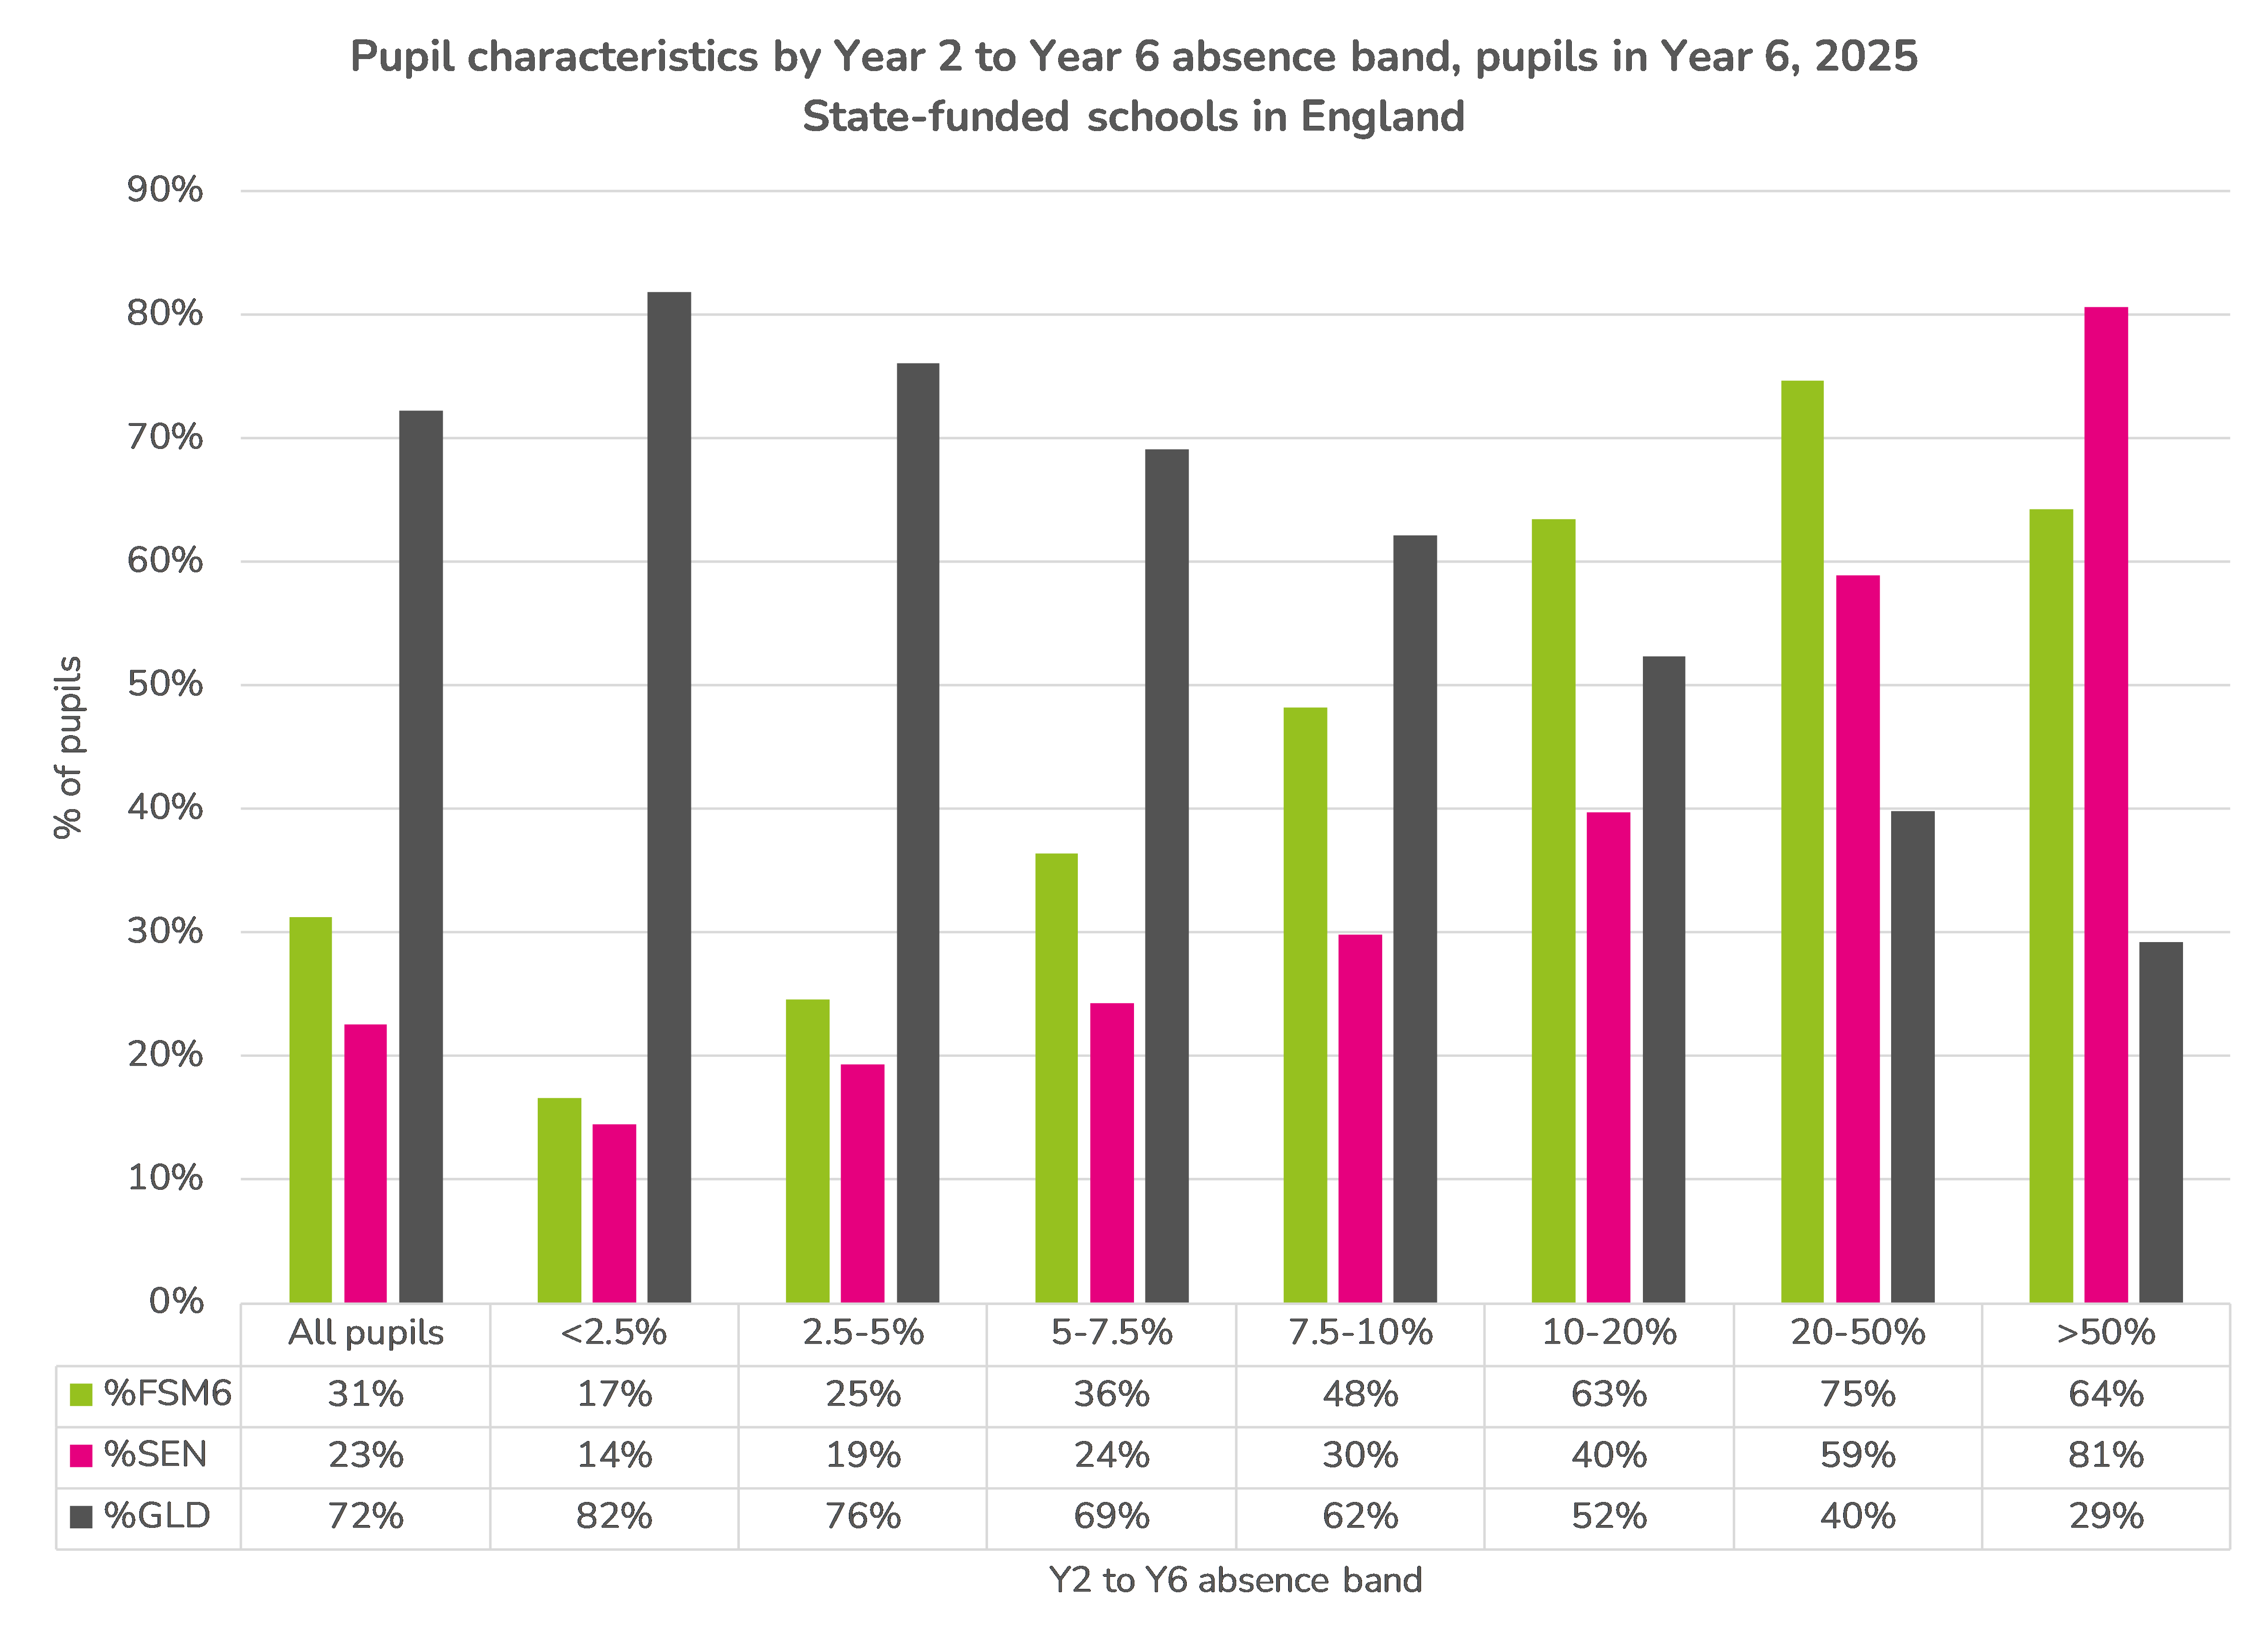
In general, prevalence of disadvantage and SEN increases in line with absence, and prevalence of GLD declines. Whereas over 80% of pupils with an absence rate below 2.5% between Year 2 and Year 6 had reached a good level of development by the end of the Foundation Stage, this figure was below 30% among those with an absence rate above 50%.
In other words, there is an increased level of need among pupils with higher rates of lifetime absence.
Next, we look at how context influences attainment within each band. To begin with, we repeat the chart above showing attainment by lifetime absence band but this time we centre the axis around the national averages for reading and maths, i.e. show the difference compared to the national average for each band.
We can then compare that chart with a similar chart for CVA scores. This cancels out differences in attainment that are associated with differences in pupil characteristics and prior (EYFSP) attainment.
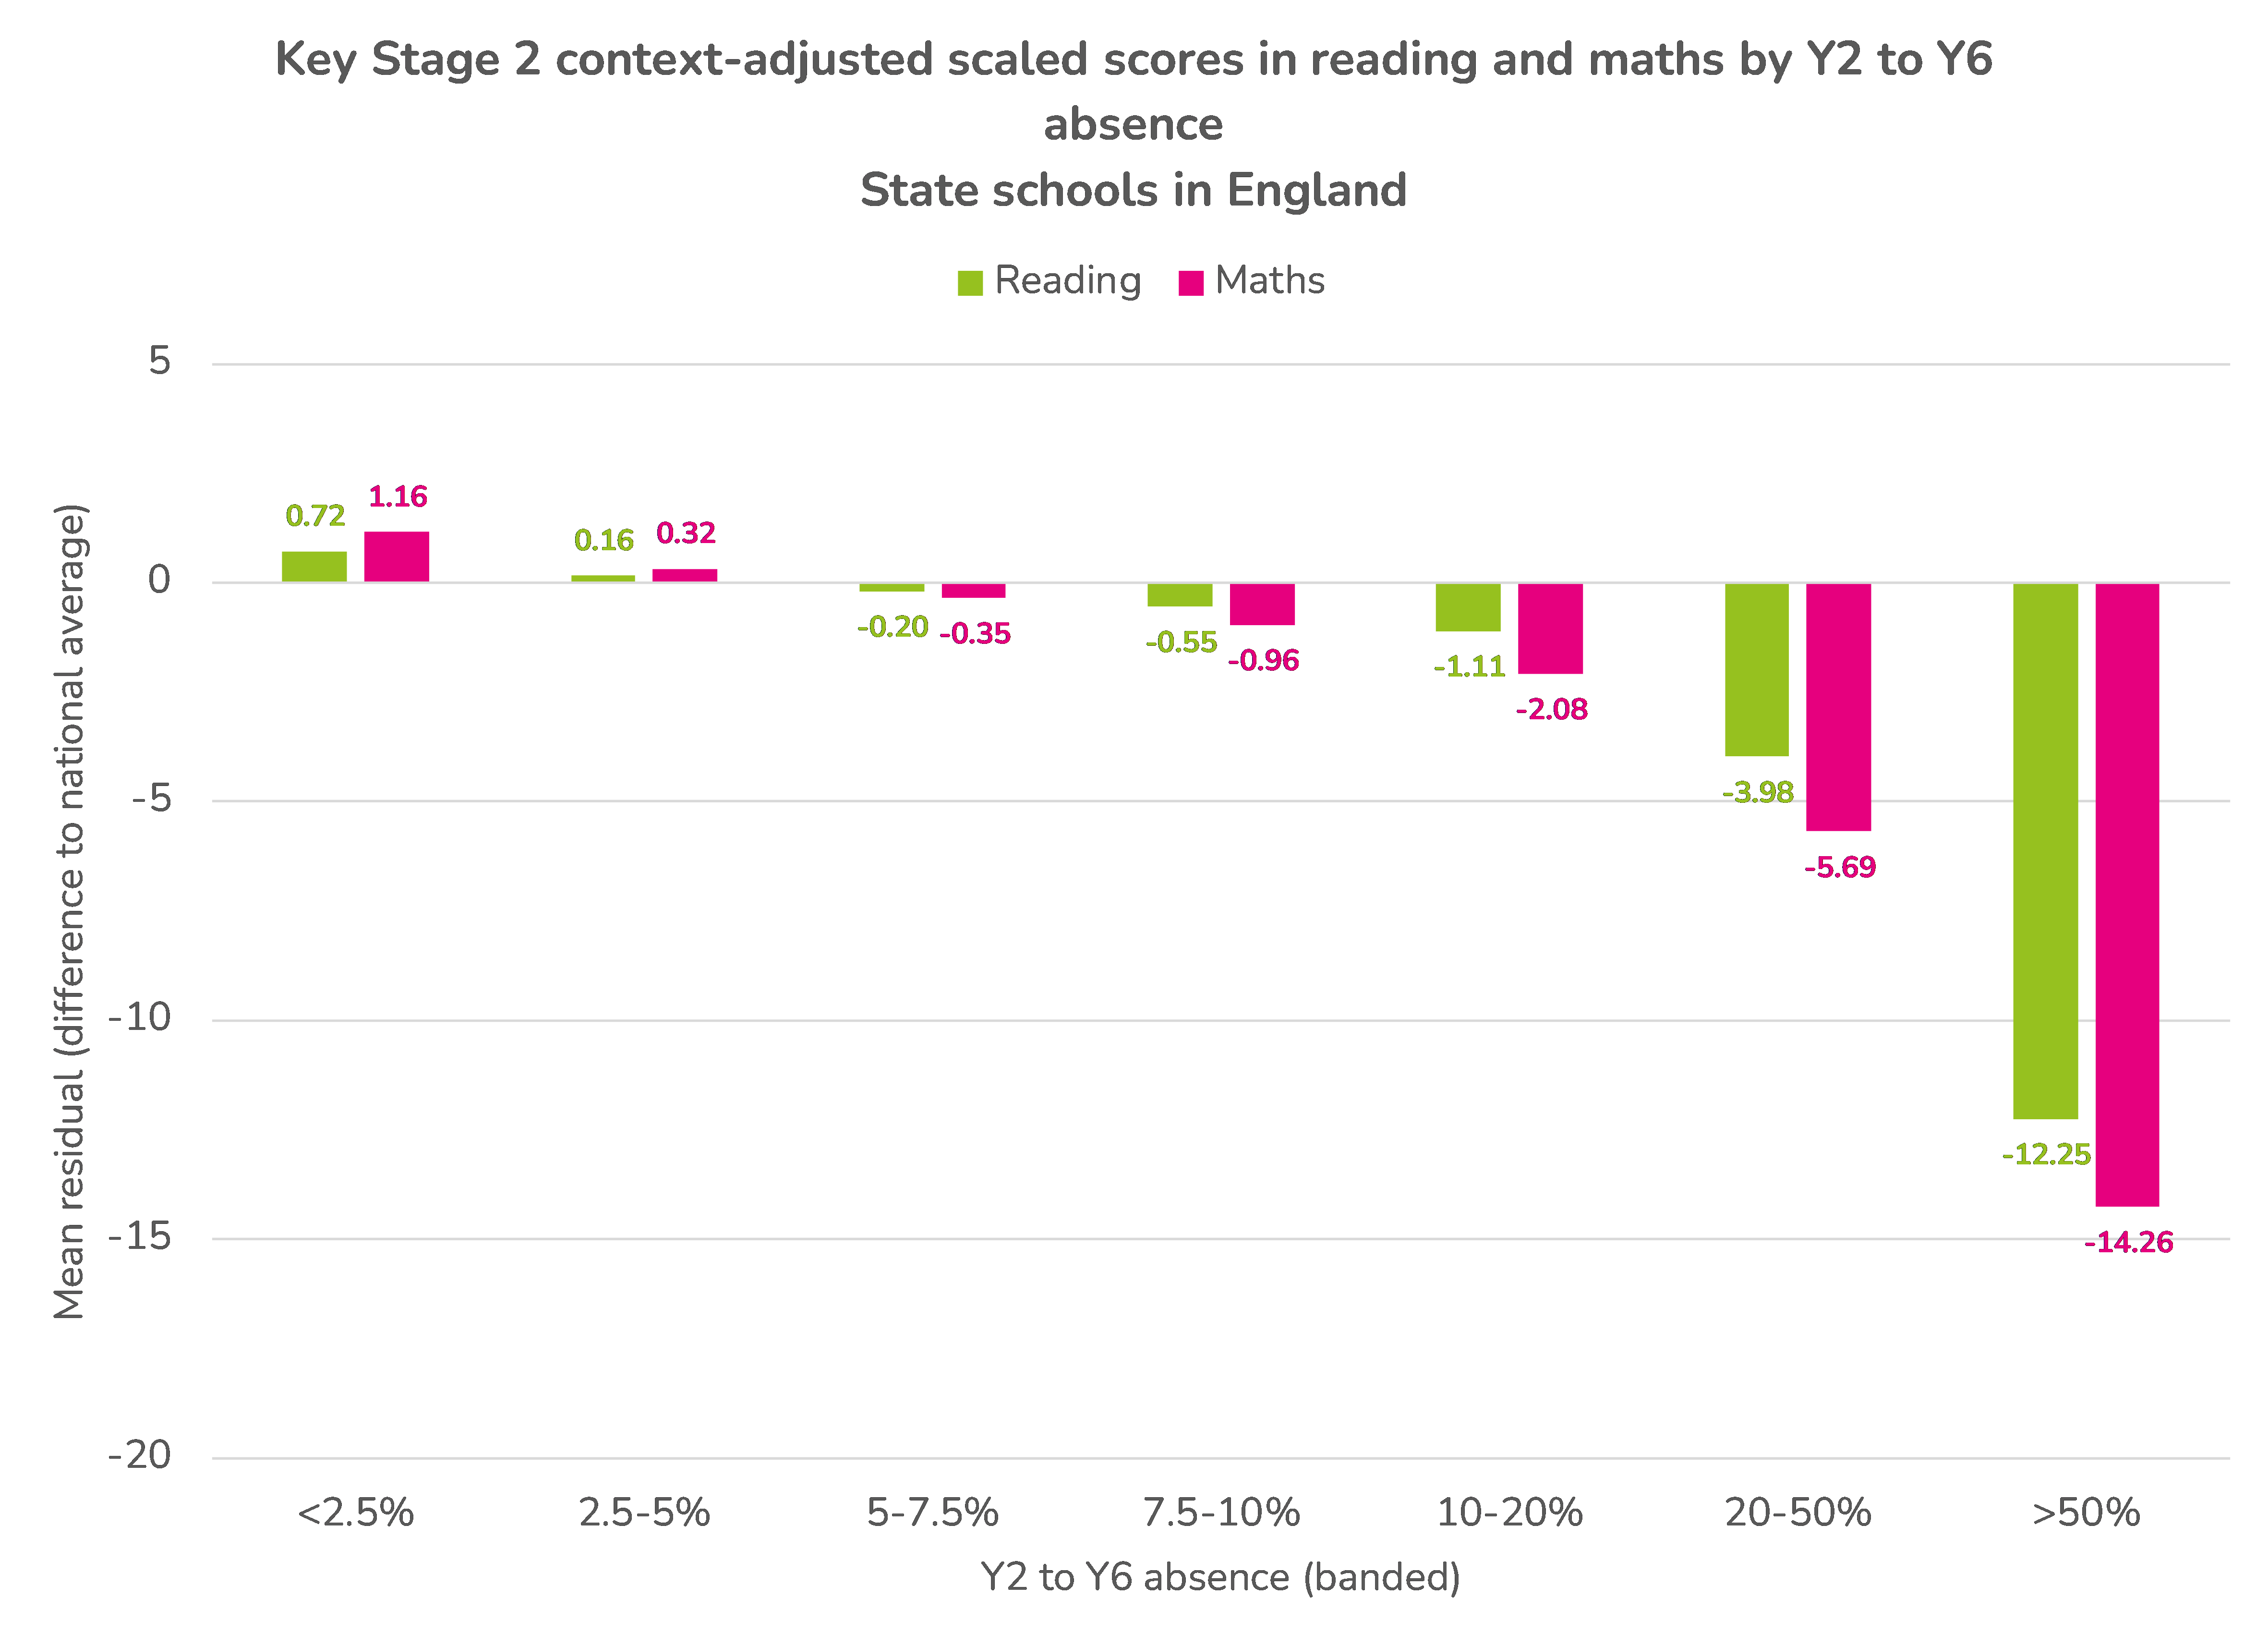
The differences in attainment we observe between pupils in the various absence bands, with the exception of those absent for more than 20% of sessions, are much reduced when we account for differences in pupil characteristics. For example, there was a gap of 6.42 points in maths between pupils in the <2.5% band and pupils in the 10-20% band. This falls to 3.24 when we take account of pupil characteristics and prior attainment.
Correlations
The table below shows the correlations between the various measures we use in this article.
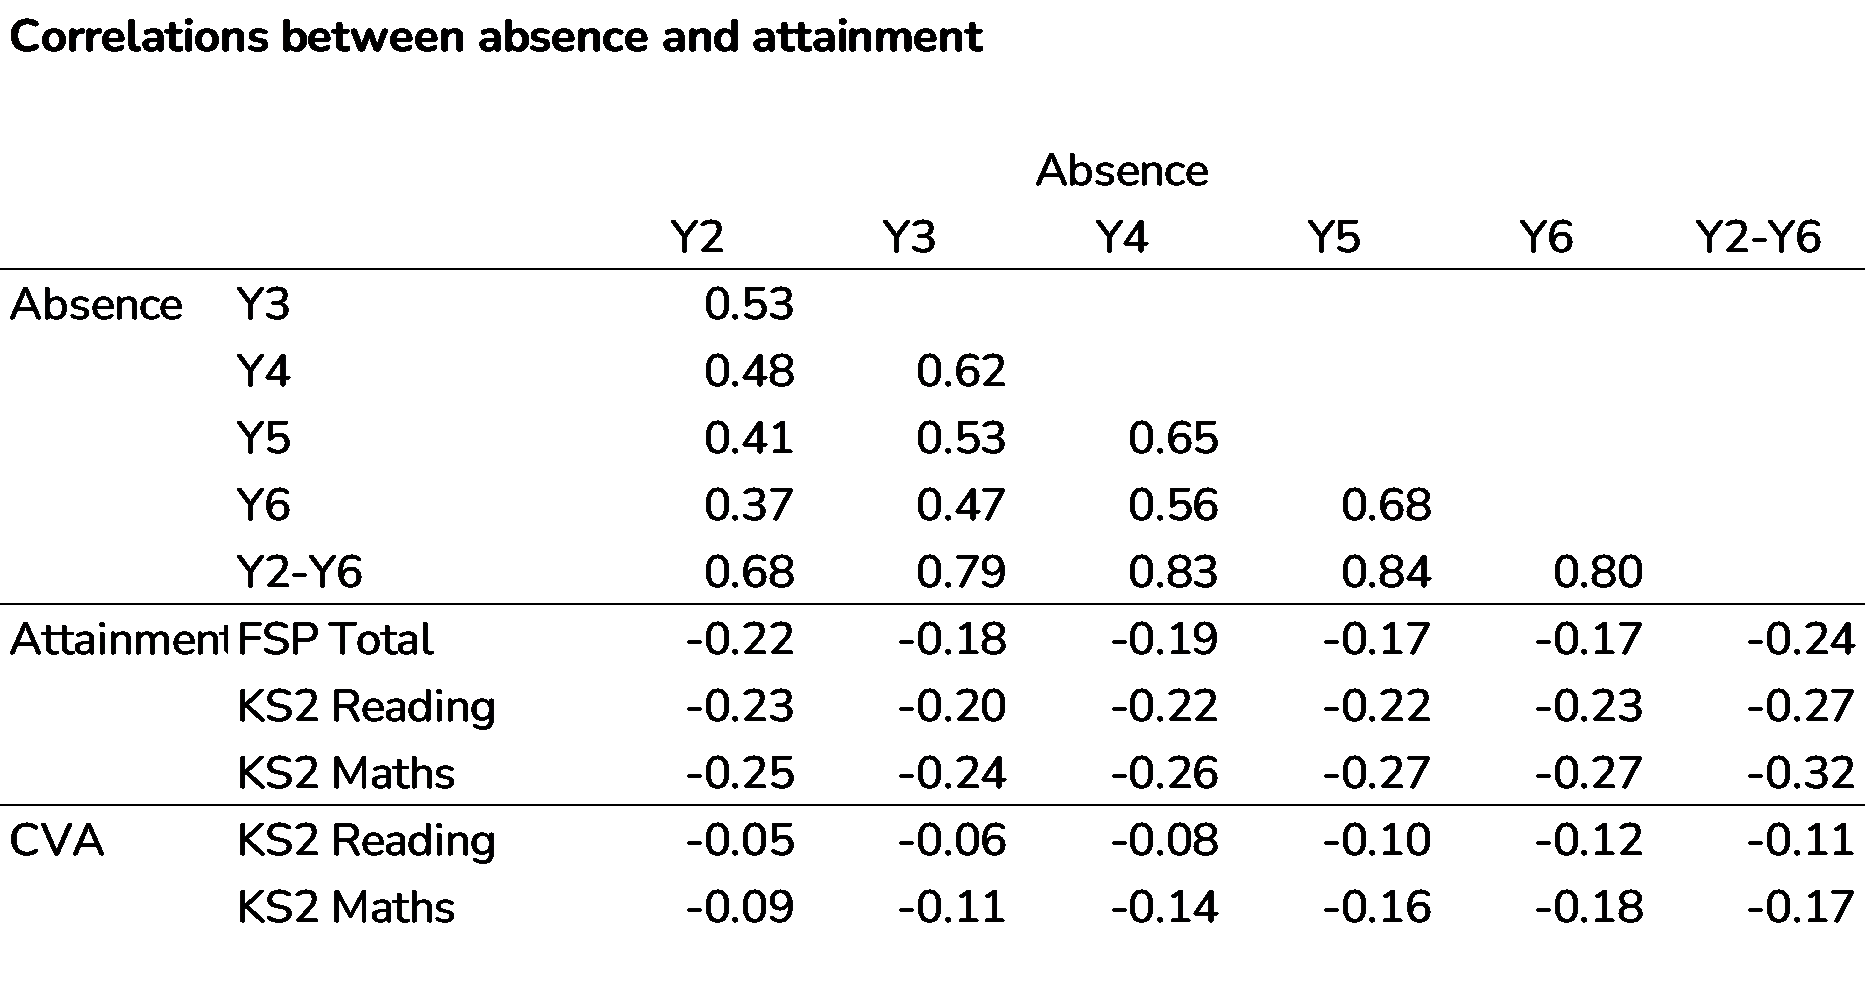
Key Stage 2 scaled scores in reading and maths are weakly correlated with yearly absence measures from Year 2 to Year 6, and slightly more strongly correlated with the lifetime (Year 2 to Year 6) average. These correlations reduce substantially when taking account of differences in pupil characteristics and prior attainment.
Absence profiles
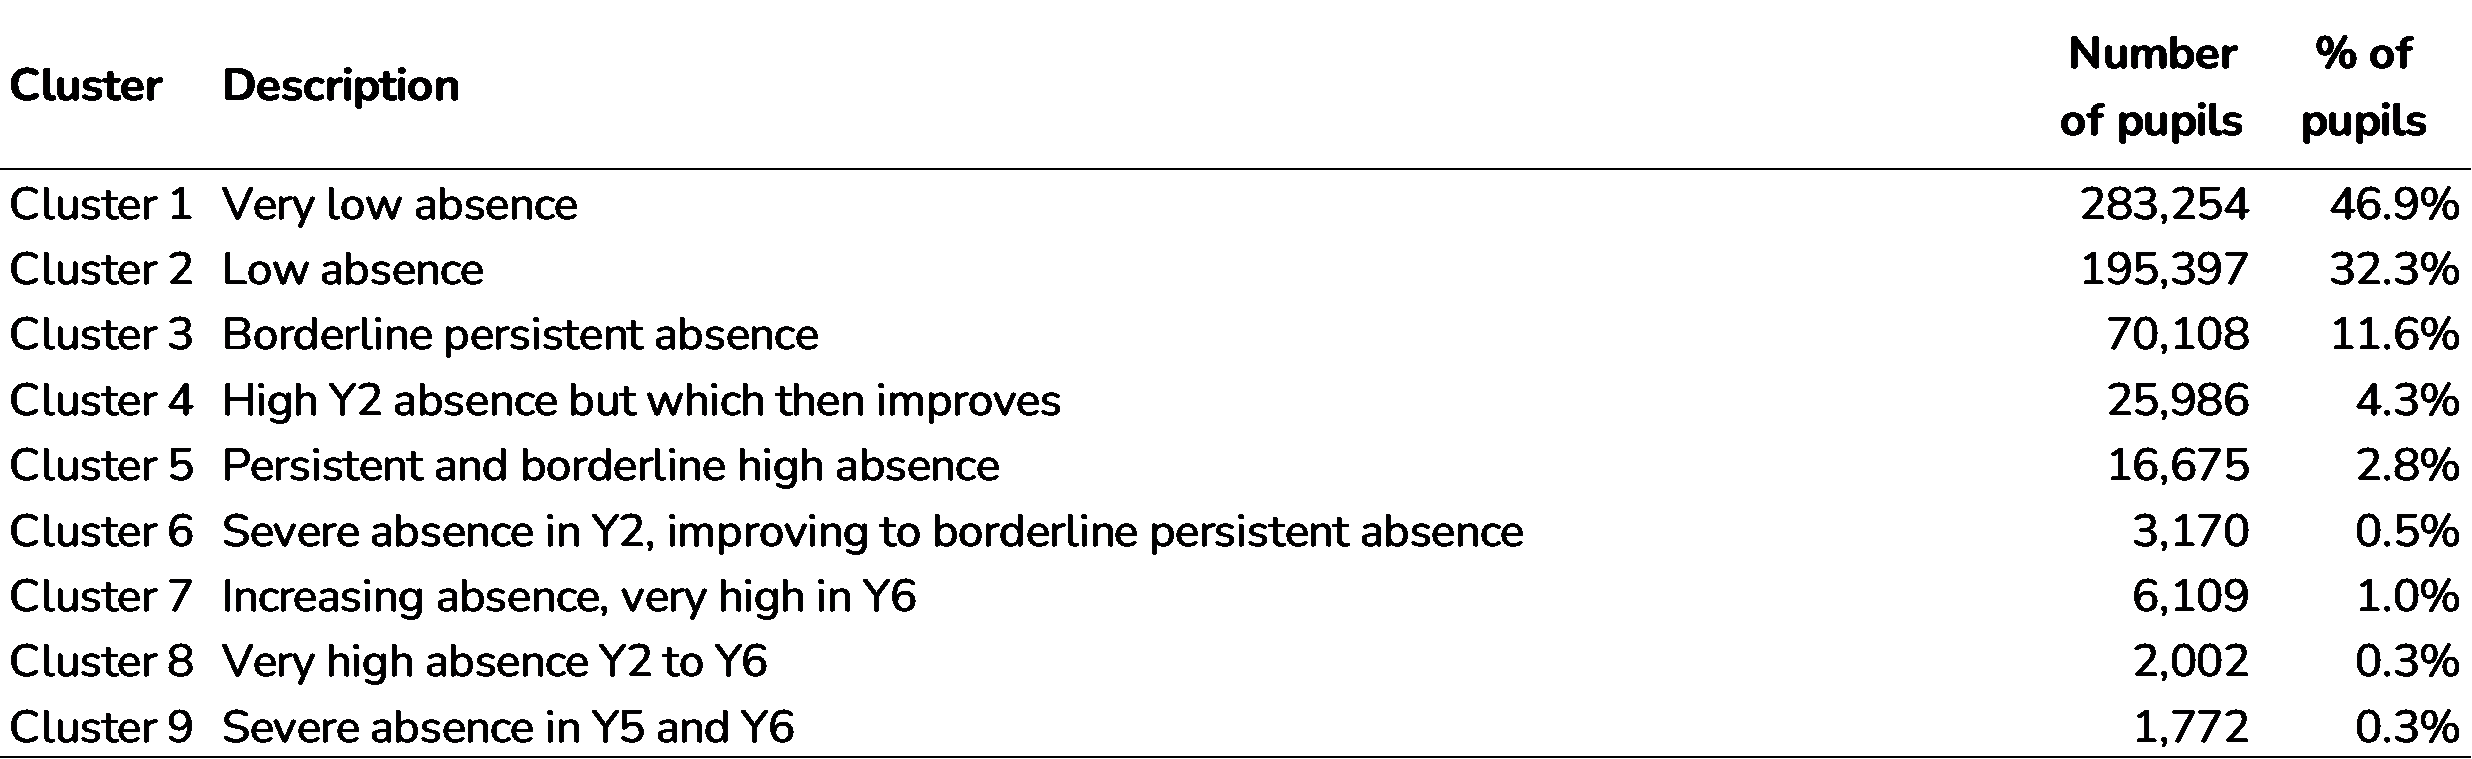
Finally, we use a cluster analysis procedure to identify 9 distinct absence patterns from Year 2 to Year 6. Each pupil is assigned to the profile (cluster) that most closely corresponds to their individual absence profile. This analysis only includes pupils for whom we have 5 years of data (604,000 pupils or 92% of the cohort).
The table below lists the clusters and provides a brief description. Some of the clusters are far more common than others.
We can see typical absence rates for each cluster from Year 2 to Year 6 in the chart below.
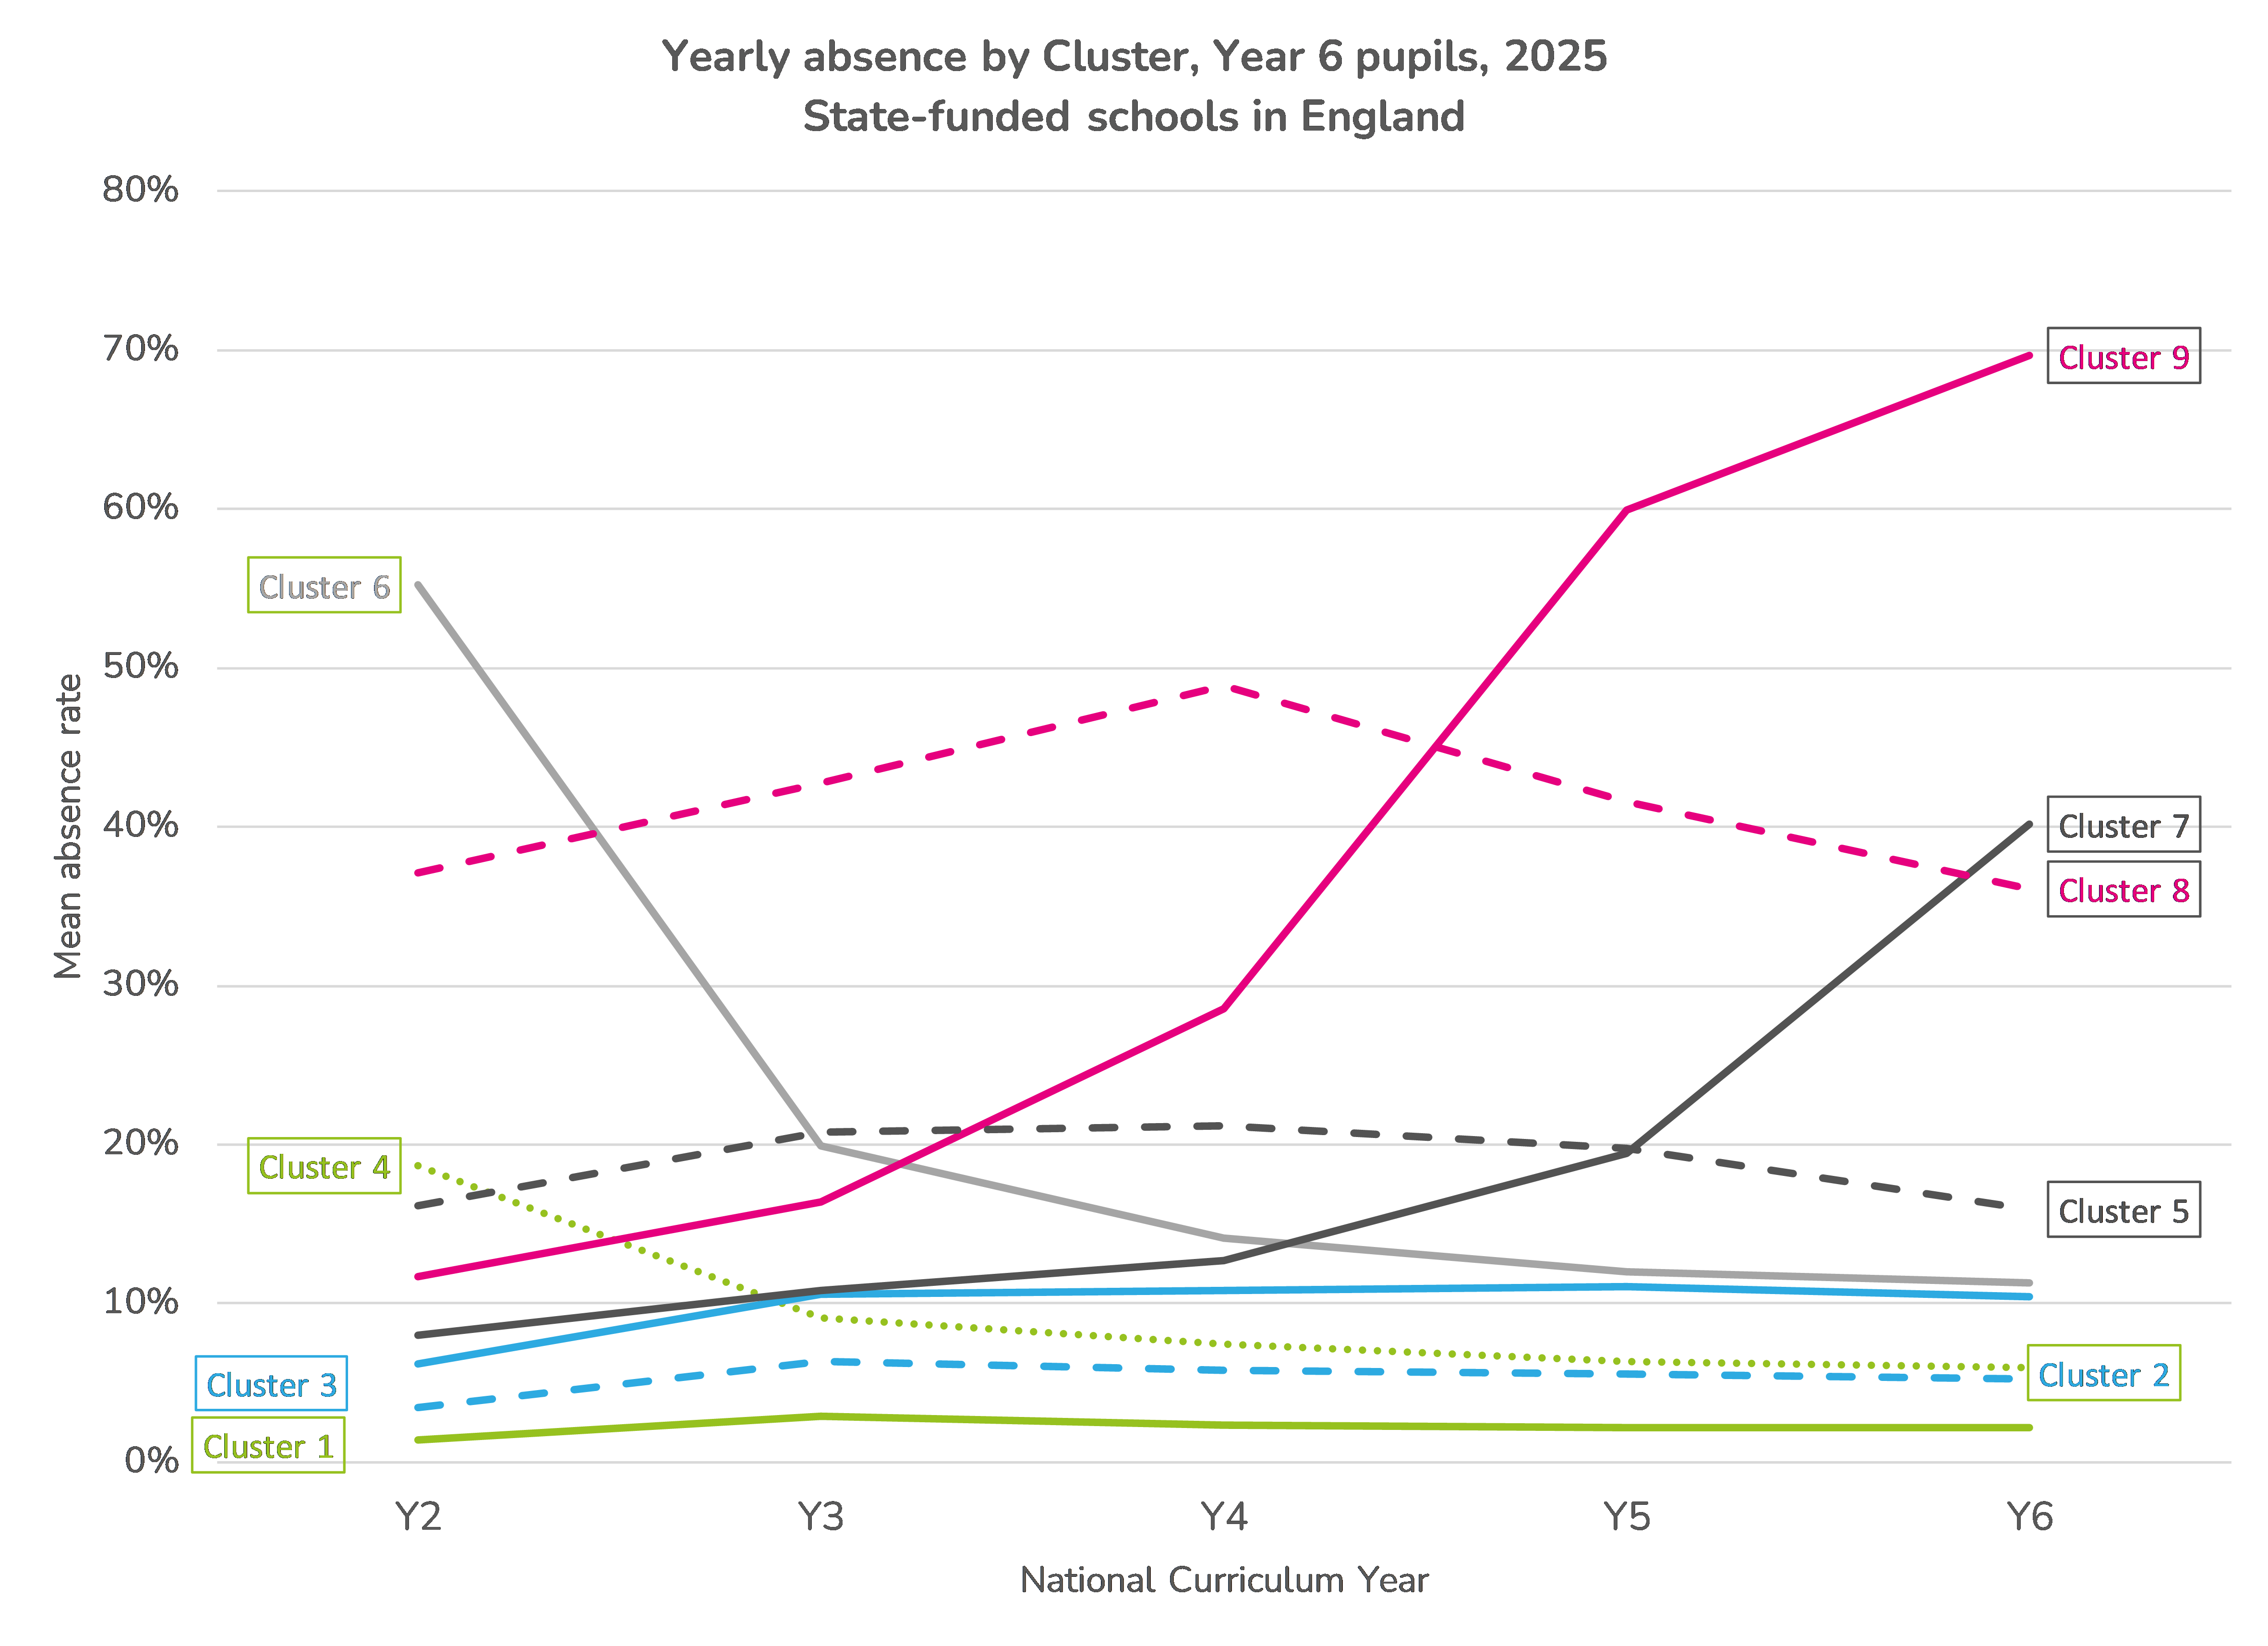
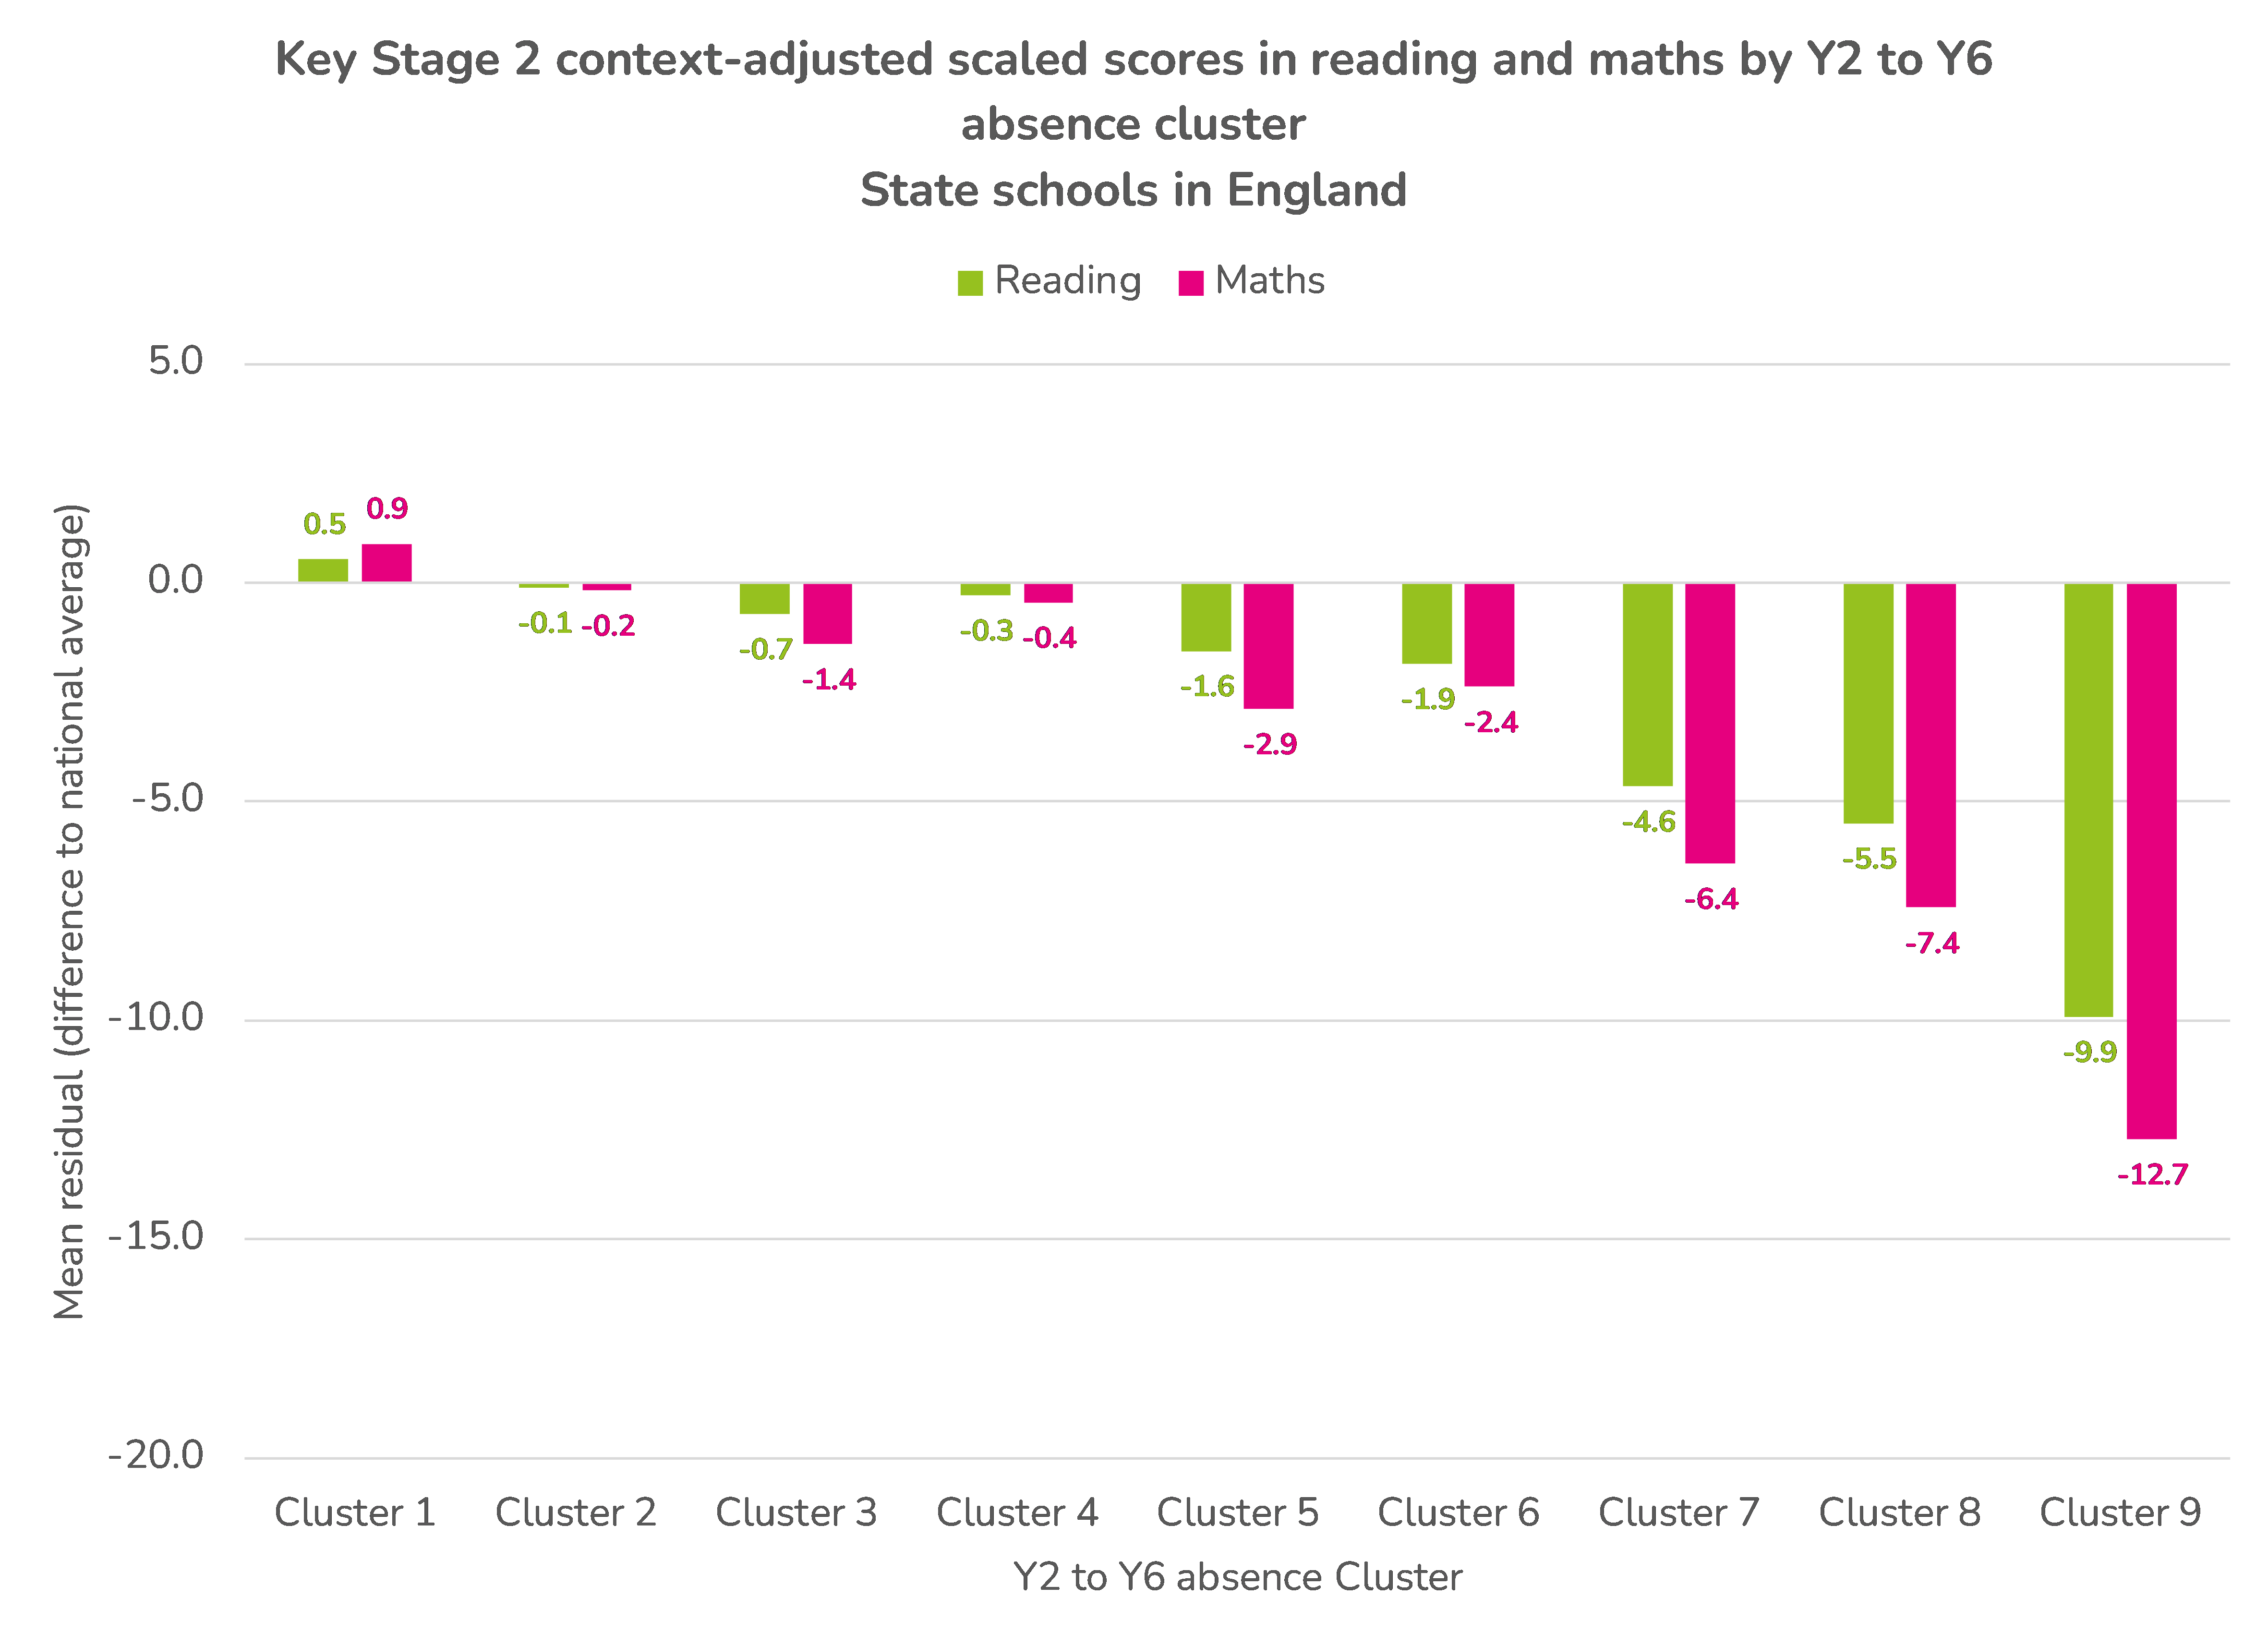
Attainment among pupils in Clusters 5 to 9 tends to be below average, even when accounting for differences in prior attainment and characteristics. However, these groups only account for around 5% of the whole cohort.
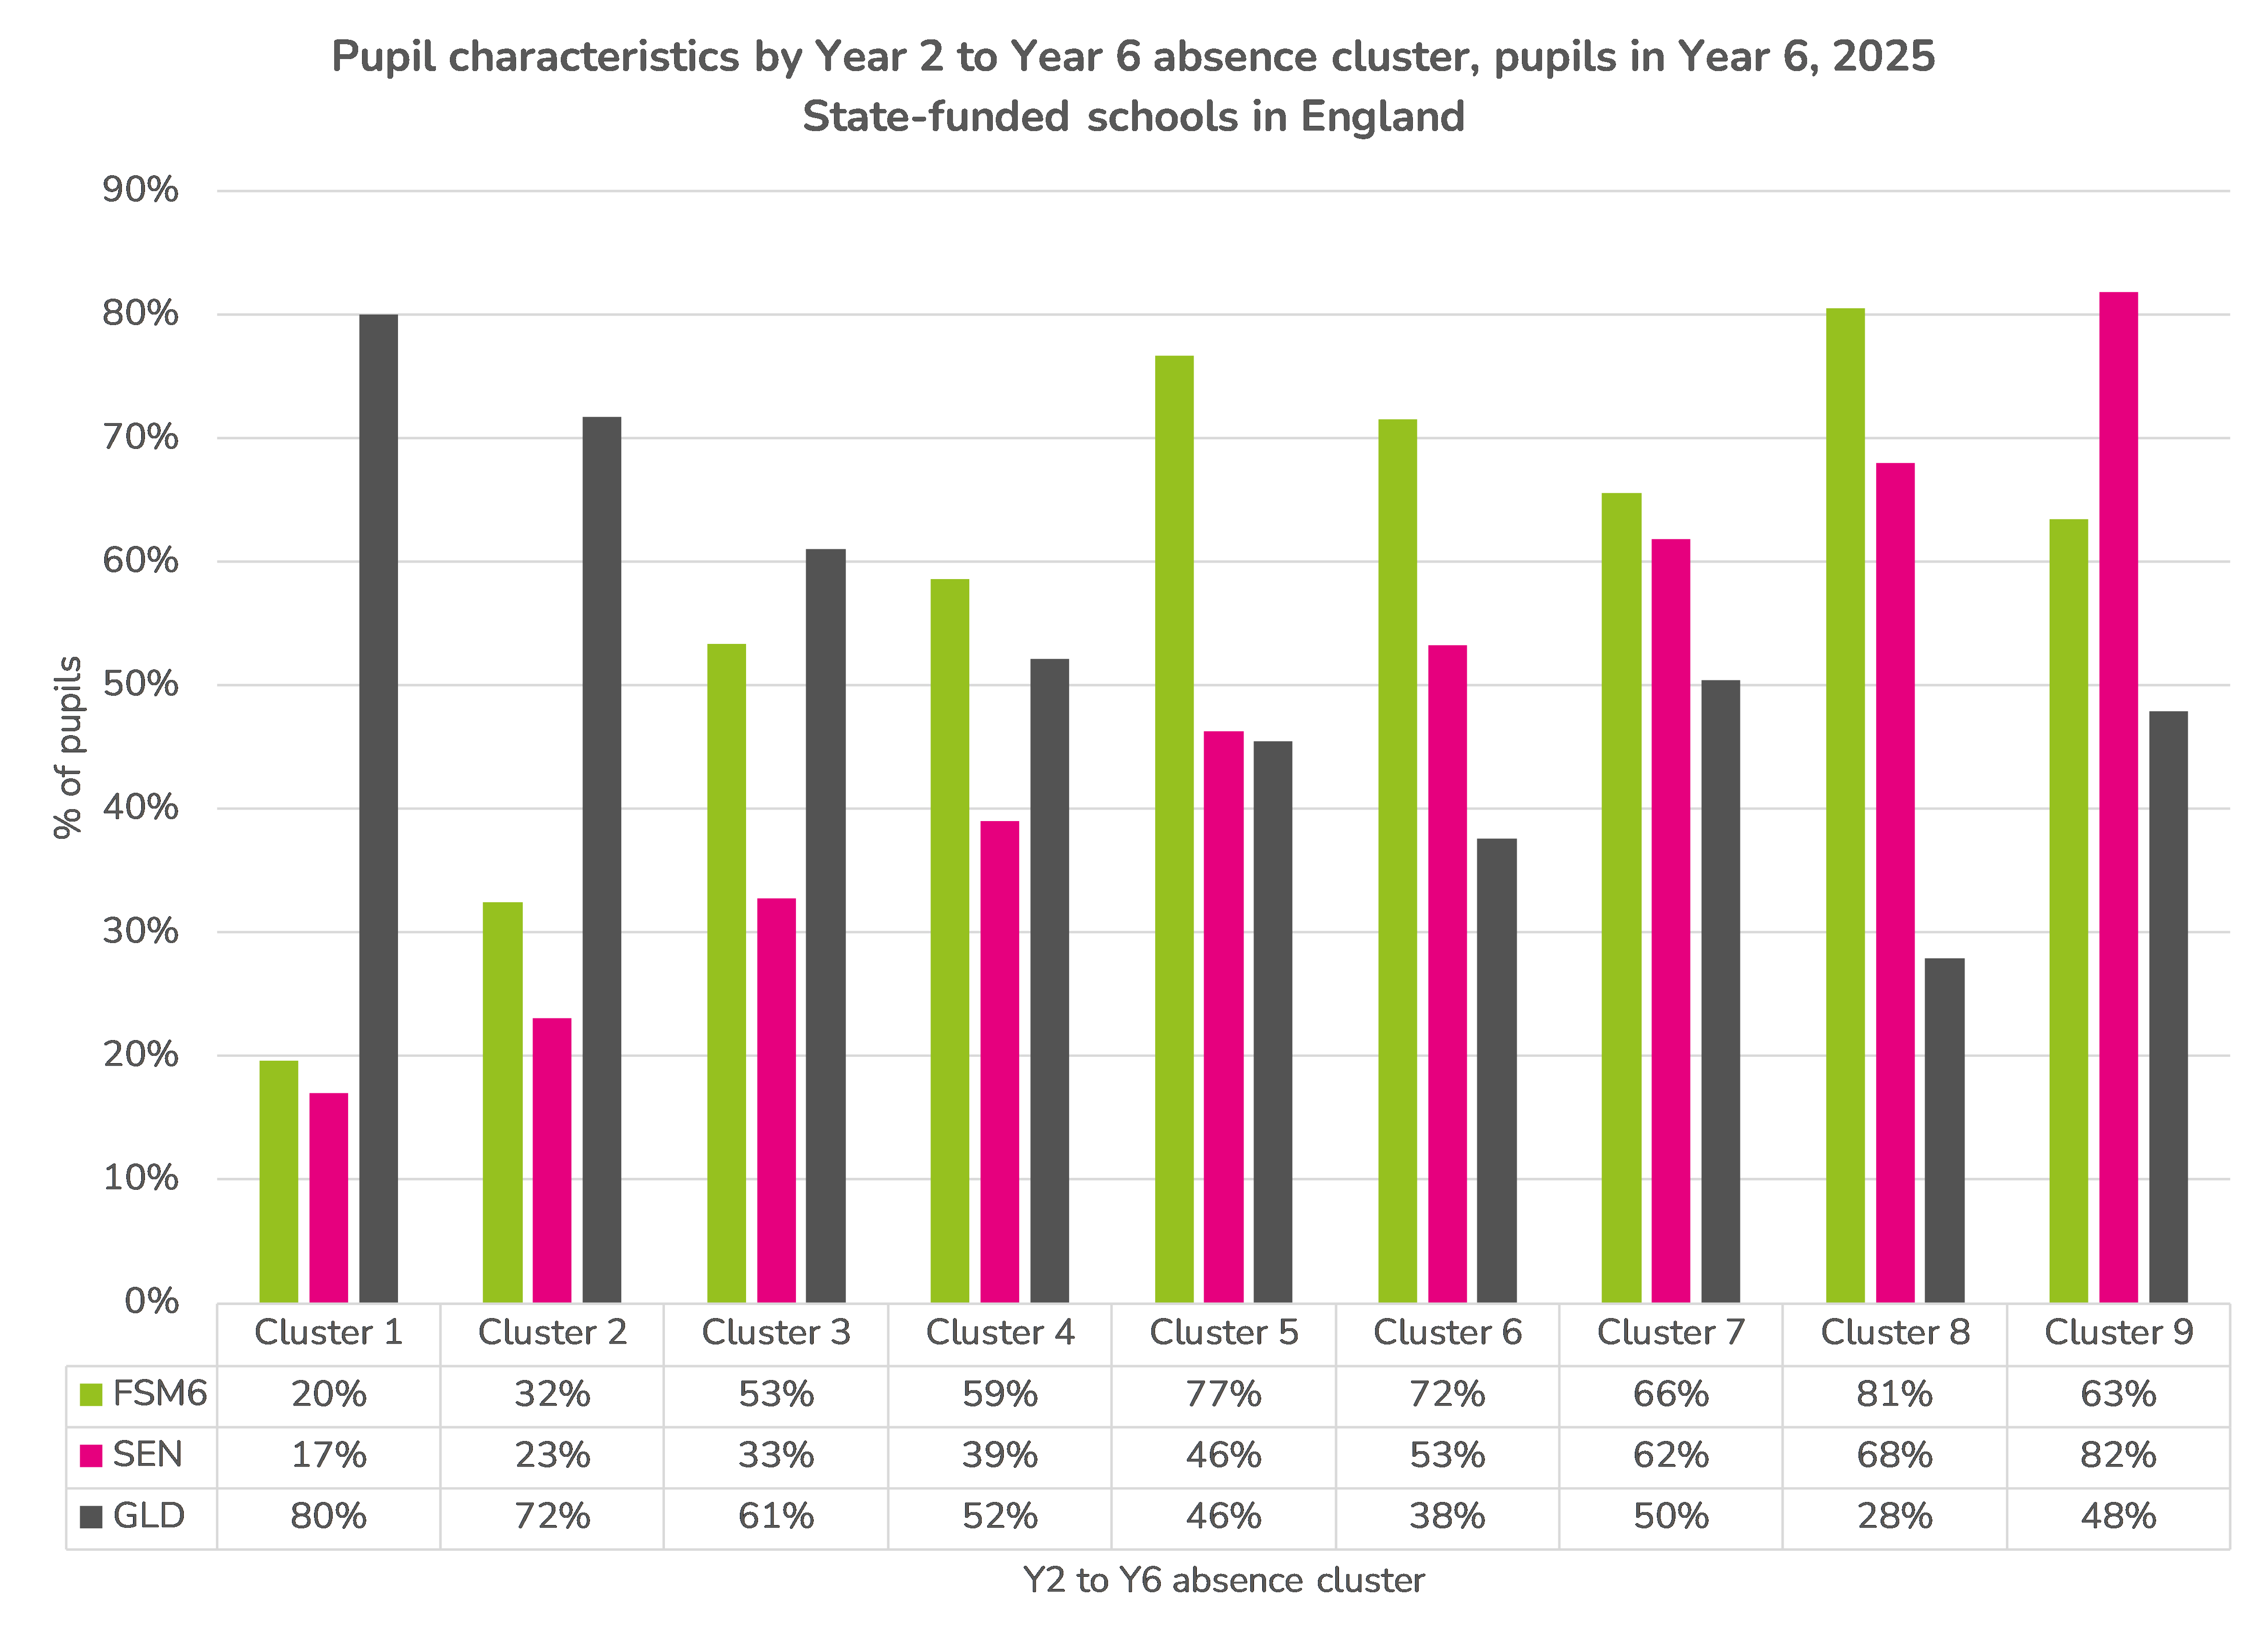
And as won’t come as any surprise, pupil characteristics vary substantially between the clusters. Most pupils in Clusters 5 to 9 were disadvantaged, were identified as having special educational needs and did not achieve a good level of development at the end of the Early Years Foundation Stage.
Summing up
Attainment, absence and context are all linked.
This is not to underplay the importance of attendance. However, it is clear that both absence and attainment are at least partially driven by differences in pupil prior attainment and needs.
Moreover, we have only examined factors for which we have data. Both absence and attainment are likely to be influenced by other factors for which we do not have data, e.g. physical and mental illness.
Want to stay up-to-date with the latest research from FFT Education Datalab? Sign up to Datalab’s mailing list to get notifications about new blogposts, or to receive the team’s half-termly newsletter.

Leave A Comment