
In this post we’re coming back to explore in a little more detail two points made in our previous post:
- firstly, the enormous variation in leaver rates seen between different secondary schools; and
- secondly, the wide variation in impact which our reweighting approach has.
It’s worth saying here that, while overall our research has led us to conclude that in a minority of cases pupil moves are being used to boost league table results, the fact that a school has a high leaver rate or a large reweighting impact does not in itself mean that it is intentionally trying to boost its apparent performance in this way.
There can be many factors that drive a high leaver rate. And in individual cases, the impact of reweighting could also be explained by a large number of pupils leaving the country, for example – more detail on these points below.
Leaver rates
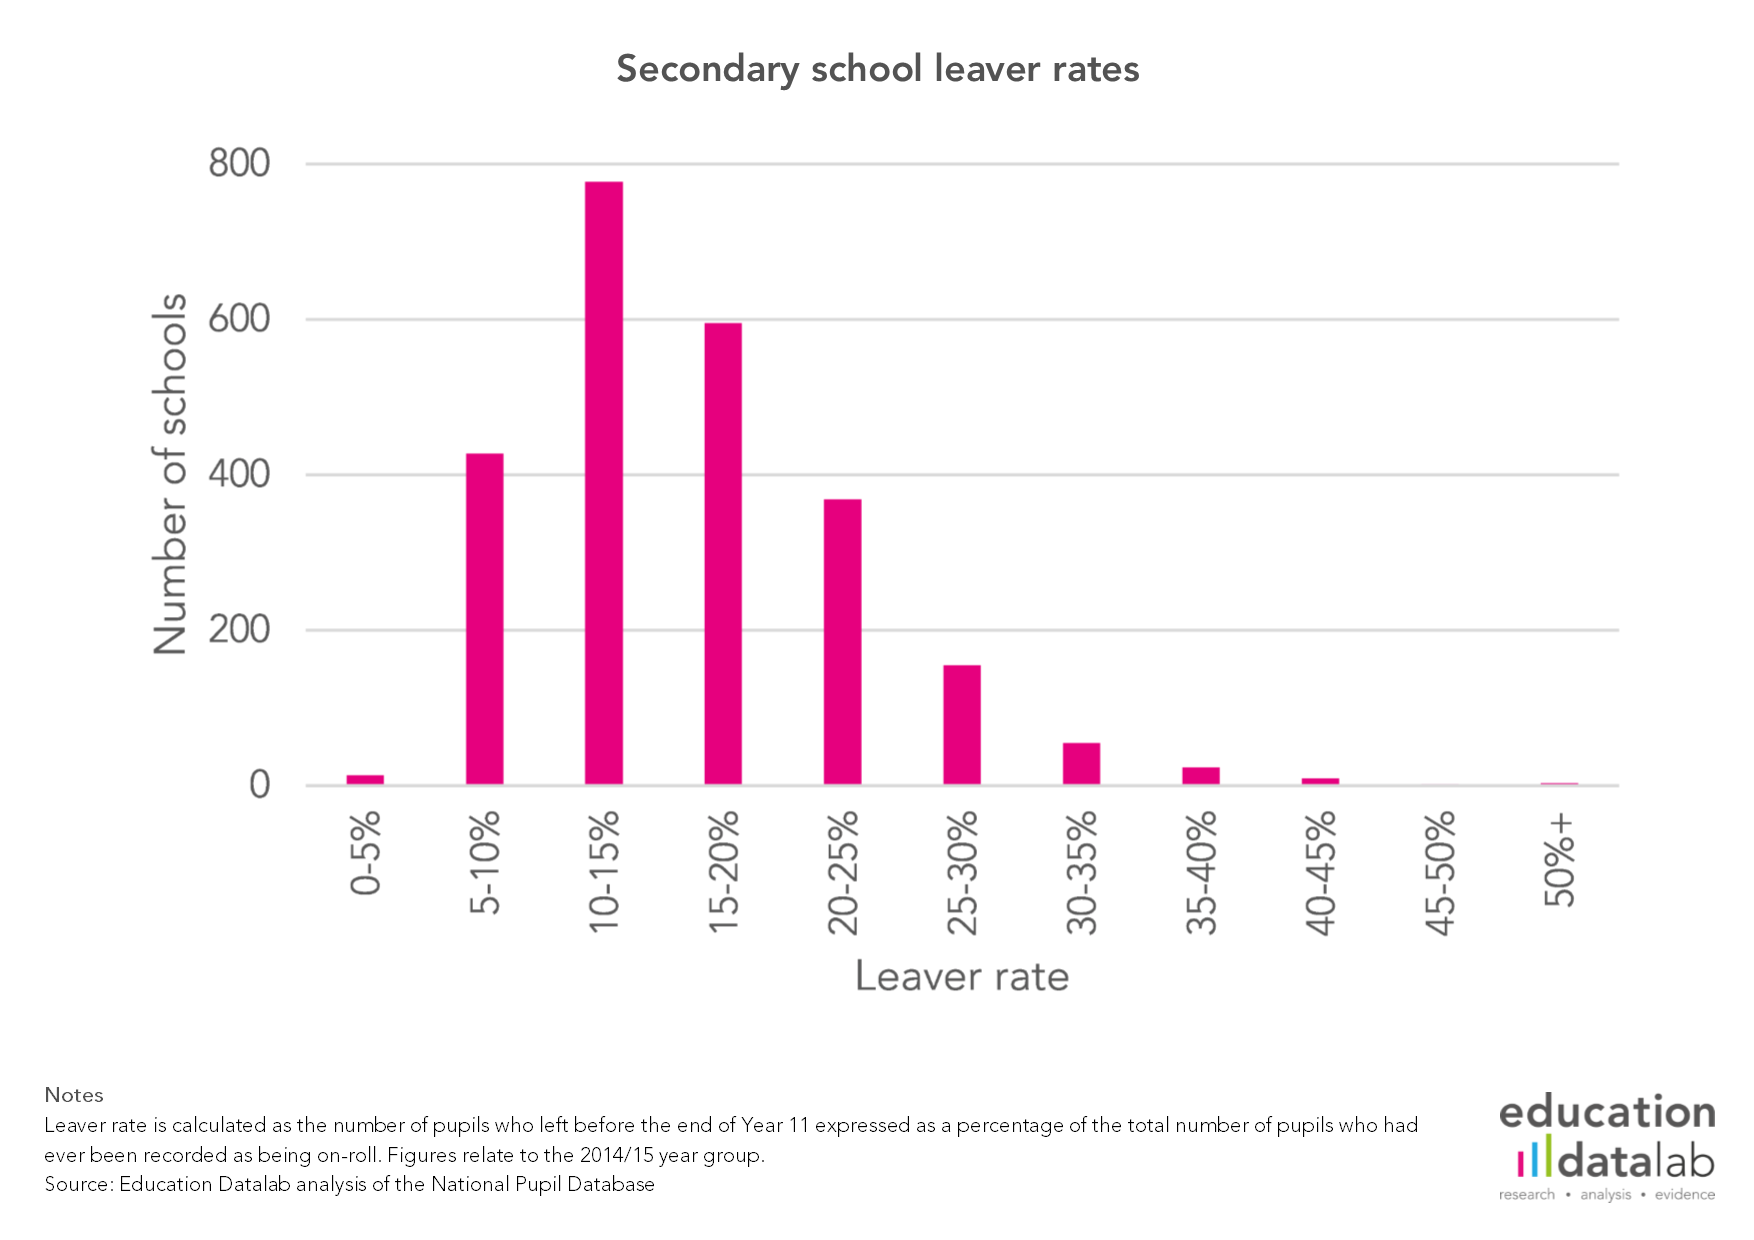
One of the findings of our work was that leaver rates – calculated as the number of pupils who left before the end of Year 11 expressed as a percentage of the total number of pupils who had ever been recorded as being on-roll – were as high as 50% in some cases. That is, half of those who had ever been on-roll weren’t there at the end of Year 11.
While this is one extreme – with only three schools having leaver rates above 50%, when we consider the 2014/15 year group – there is considerable variation in leaver rates between schools. The median is around 13.5%, but the chart below shows the full spread of school leaver rates for the 2014/15 year group.
While these numbers relate specifically to leavers, in some cases large numbers of pupils replace those who leave. Perhaps the main point to take away from this then is that there are some schools dealing with huge turnover in pupil population – with all the additional work associated with that.
This perhaps also gives some support for the inclusion of a mobility factor in the National Funding Formula – something that has been reinstated in the second stage of the consultation on the formula [PDF], after having been dropped in the first iteration.
Impact of reweighting
The second point worth exploring in more detail is the impact which our reweighting of schools’ results had on their headline GCSE pass rates. (For a full explanation of our reweighting methodology see this post.)
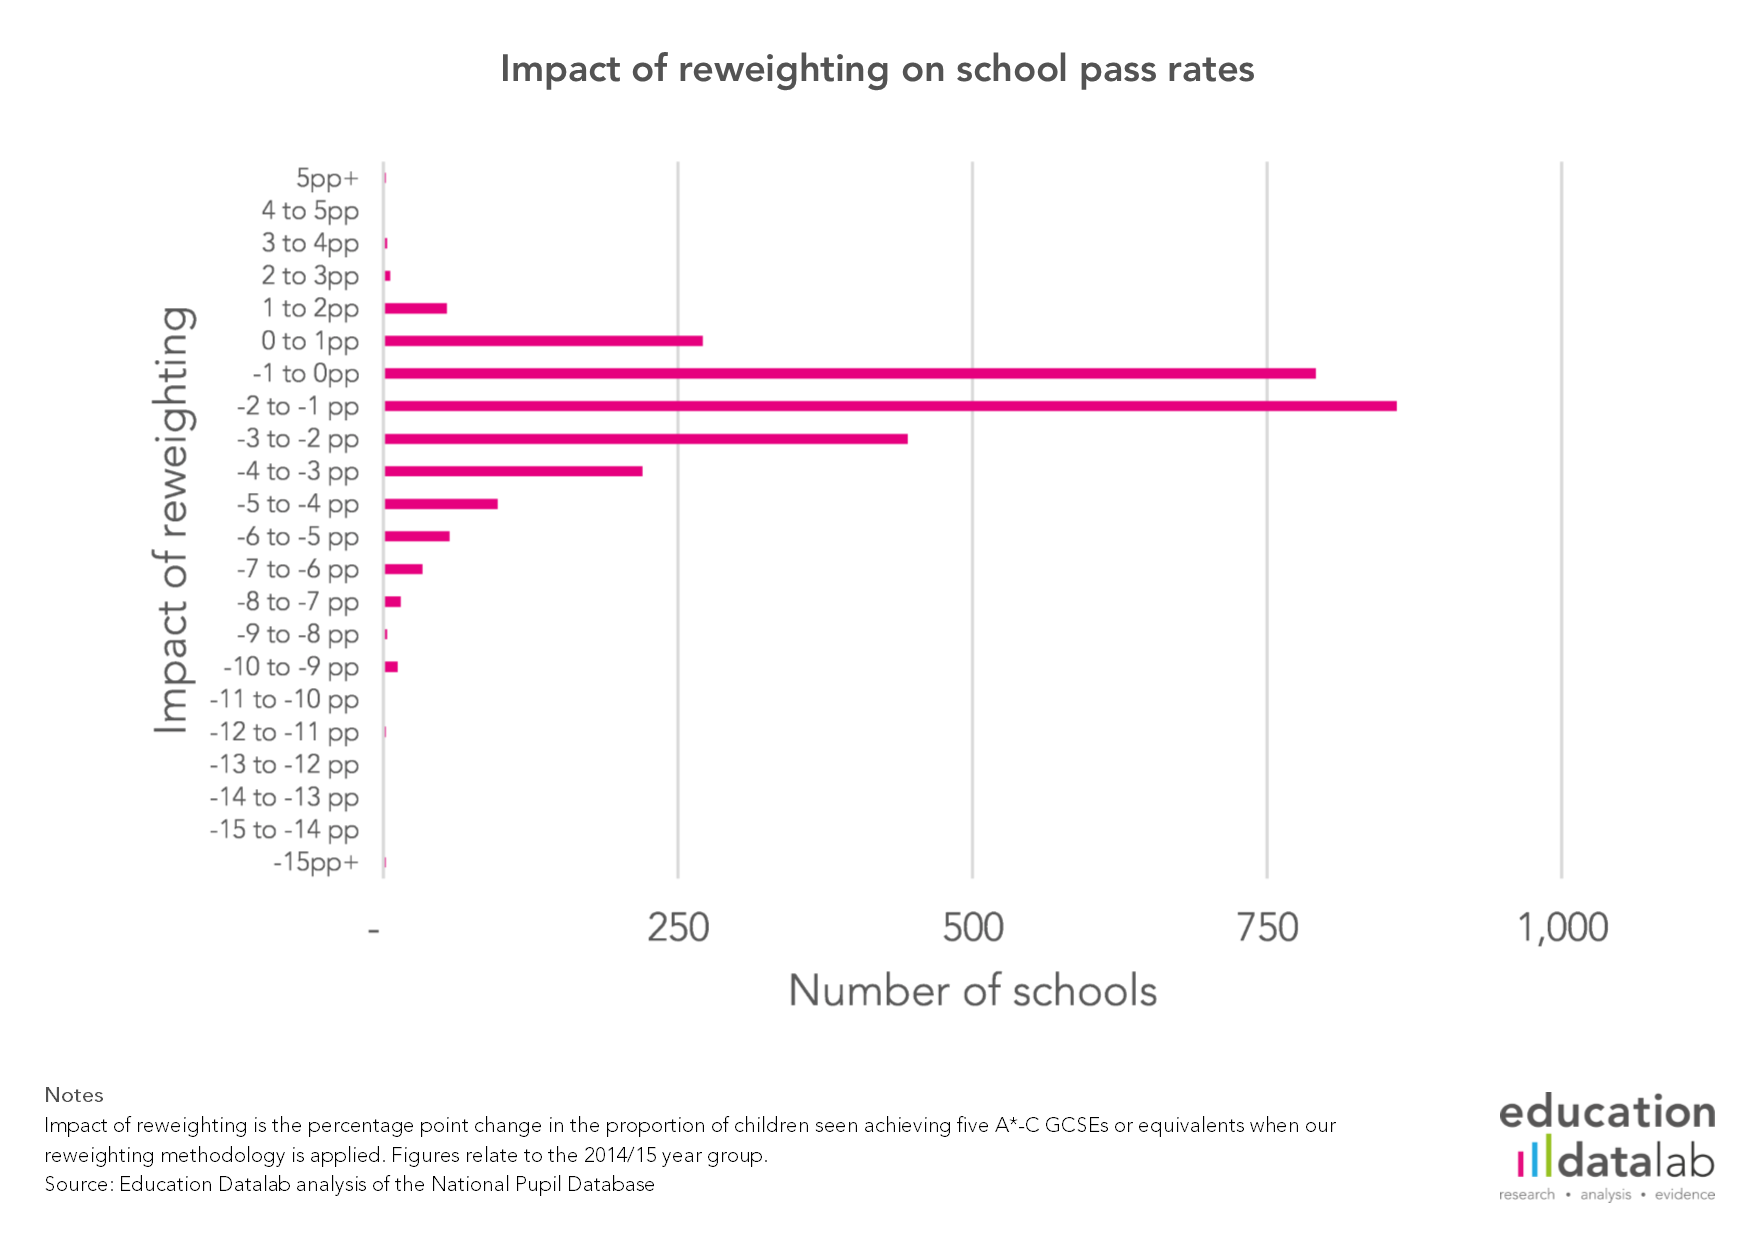
We noted previously that, at a school-level, the impact of reweighting on the proportion of pupils considered to have achieved five A*-C GCSEs, including English and maths, could be as great as -17 percentage points. (Results were calculated for four year groups, up to 2014/15 – before Progress 8 came into force for most schools.)
But for the majority of schools the impact of reweighting is in the range of -2.5 to +2.5 percentage points. In fact, more than 75% of secondaries fall in this range.
Very few see a positive impact of more than 2.5 percentage points, but 125 seeing an impact of more than -2.5 percentage points. The chart below shows the full spread of results under our reweighting.
 It’s worth repeating that a large impact under our reweighting approach does not in itself mean a school is using pupil moves to boost their league table results.
There can be a number of reasons that give rise to a big impact.
But it is cases where there is a large impact that we would ask the Department for Education to think about when considering whether they are satisfied that pupil moves are not being used to game league tables.
A high level of pupil mobility in and of itself doesn’t mean that a school would see a big impact under our reweighting approach. Large numbers of leavers would only translate into a large reweighting impact if those who left had poor outcomes. An exception to this is if there were large numbers of pupils who left England – this type of mobility would have an impact, irrespective of outcomes for pupils once they were out the country, and this may be true in some cases for schools which saw reweighting have a big impact.
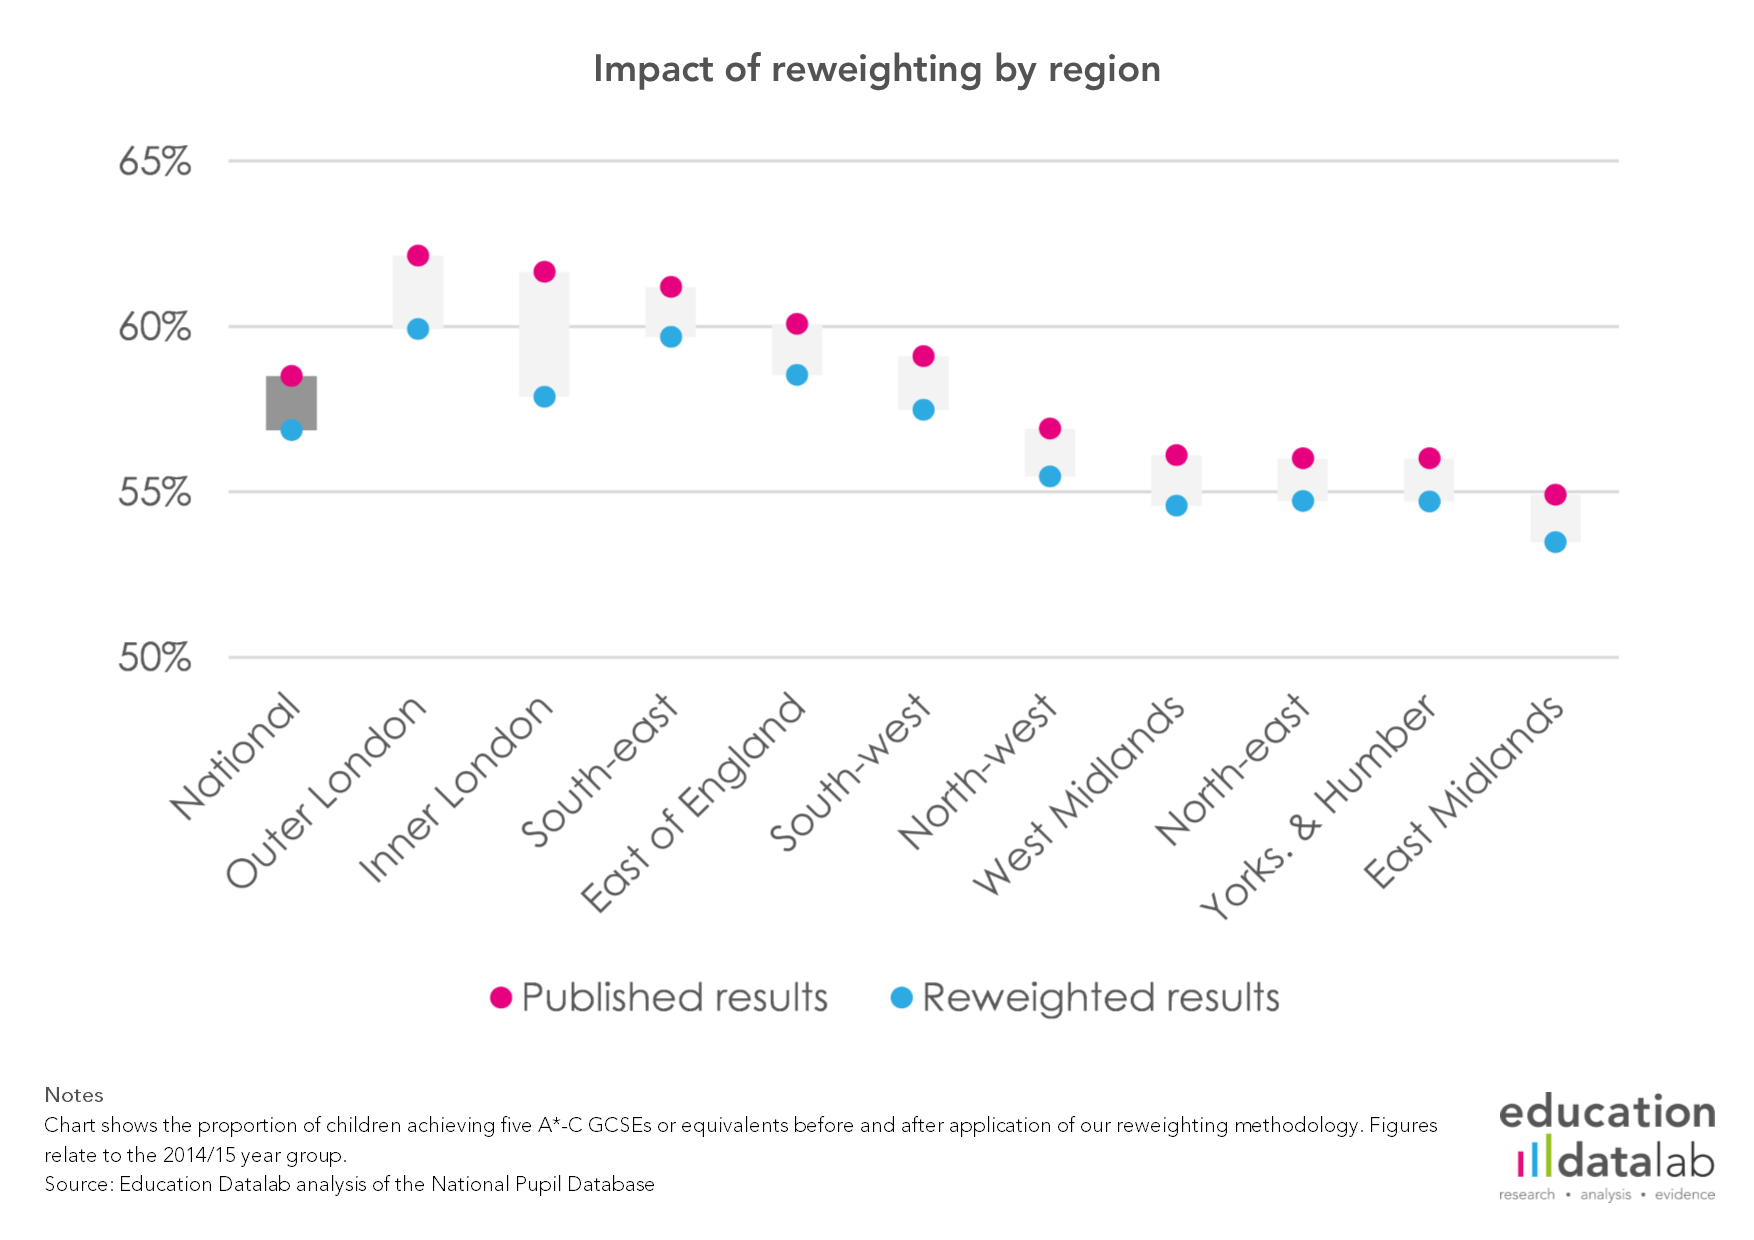
Overall, London is the region most affected by reweighting, with inner and outer London’s results reducing by 3.8 and 2.2 percentage points respectively. (The overall national impact of reweighting was -1.6 percentage points, as we’re effectively adding back in the results of pupils who left mainstream education – in proportion to the amount of time they spent in a mainstream school.)
Some of this is likely to be explained by higher levels of emigration from the capital than some other regions.
London also has more sponsored academies than some other parts of the country, which as we have seen, are affected more by reweighting than other school types.
It might also reflect a greater availability of alternatives to mainstream education in London, and urban areas in general – or greater willingness to use those alternatives.
To that extent, reweighting league tables so that they take account of all pupils, in proportion to the amount of time they spent on-roll, could be considered a way of equalising the differences in the availability and use of alternatives to mainstream education that exist around the country.
Now read the rest of Datalab’s ‘Who’s left’ series of posts.


Leave A Comment