Last week the TES ran a story based on some research by Tom Richmond [PDF] comparing the A-Level value added scores of independent schools and state schools.
In the story, the average value added score for the 10 highest attaining independent schools was given as 0.19, and for the 10 highest attaining non-selective state schools 0.26[1]. Hence the headline that ‘top comps beat independents’.
The report went further and compared the top 20 and top 50 schools of each type with similar results.
It also showed that there are some state schools where students achieve results on a par with (or even better than) their peers in independent schools despite starting from a lower base of prior attainment at Key Stage 4.
But can other comparisons between independent schools and state schools be drawn and what do they show?
The top 10 schools
Tom’s analysis was based on published Department for Education performance indicators, which can be downloaded from this link.
For the purpose of his comparisons, highest attaining means achieving the highest average point score (APS) per A-Level entry, not the highest A-Level value added score.
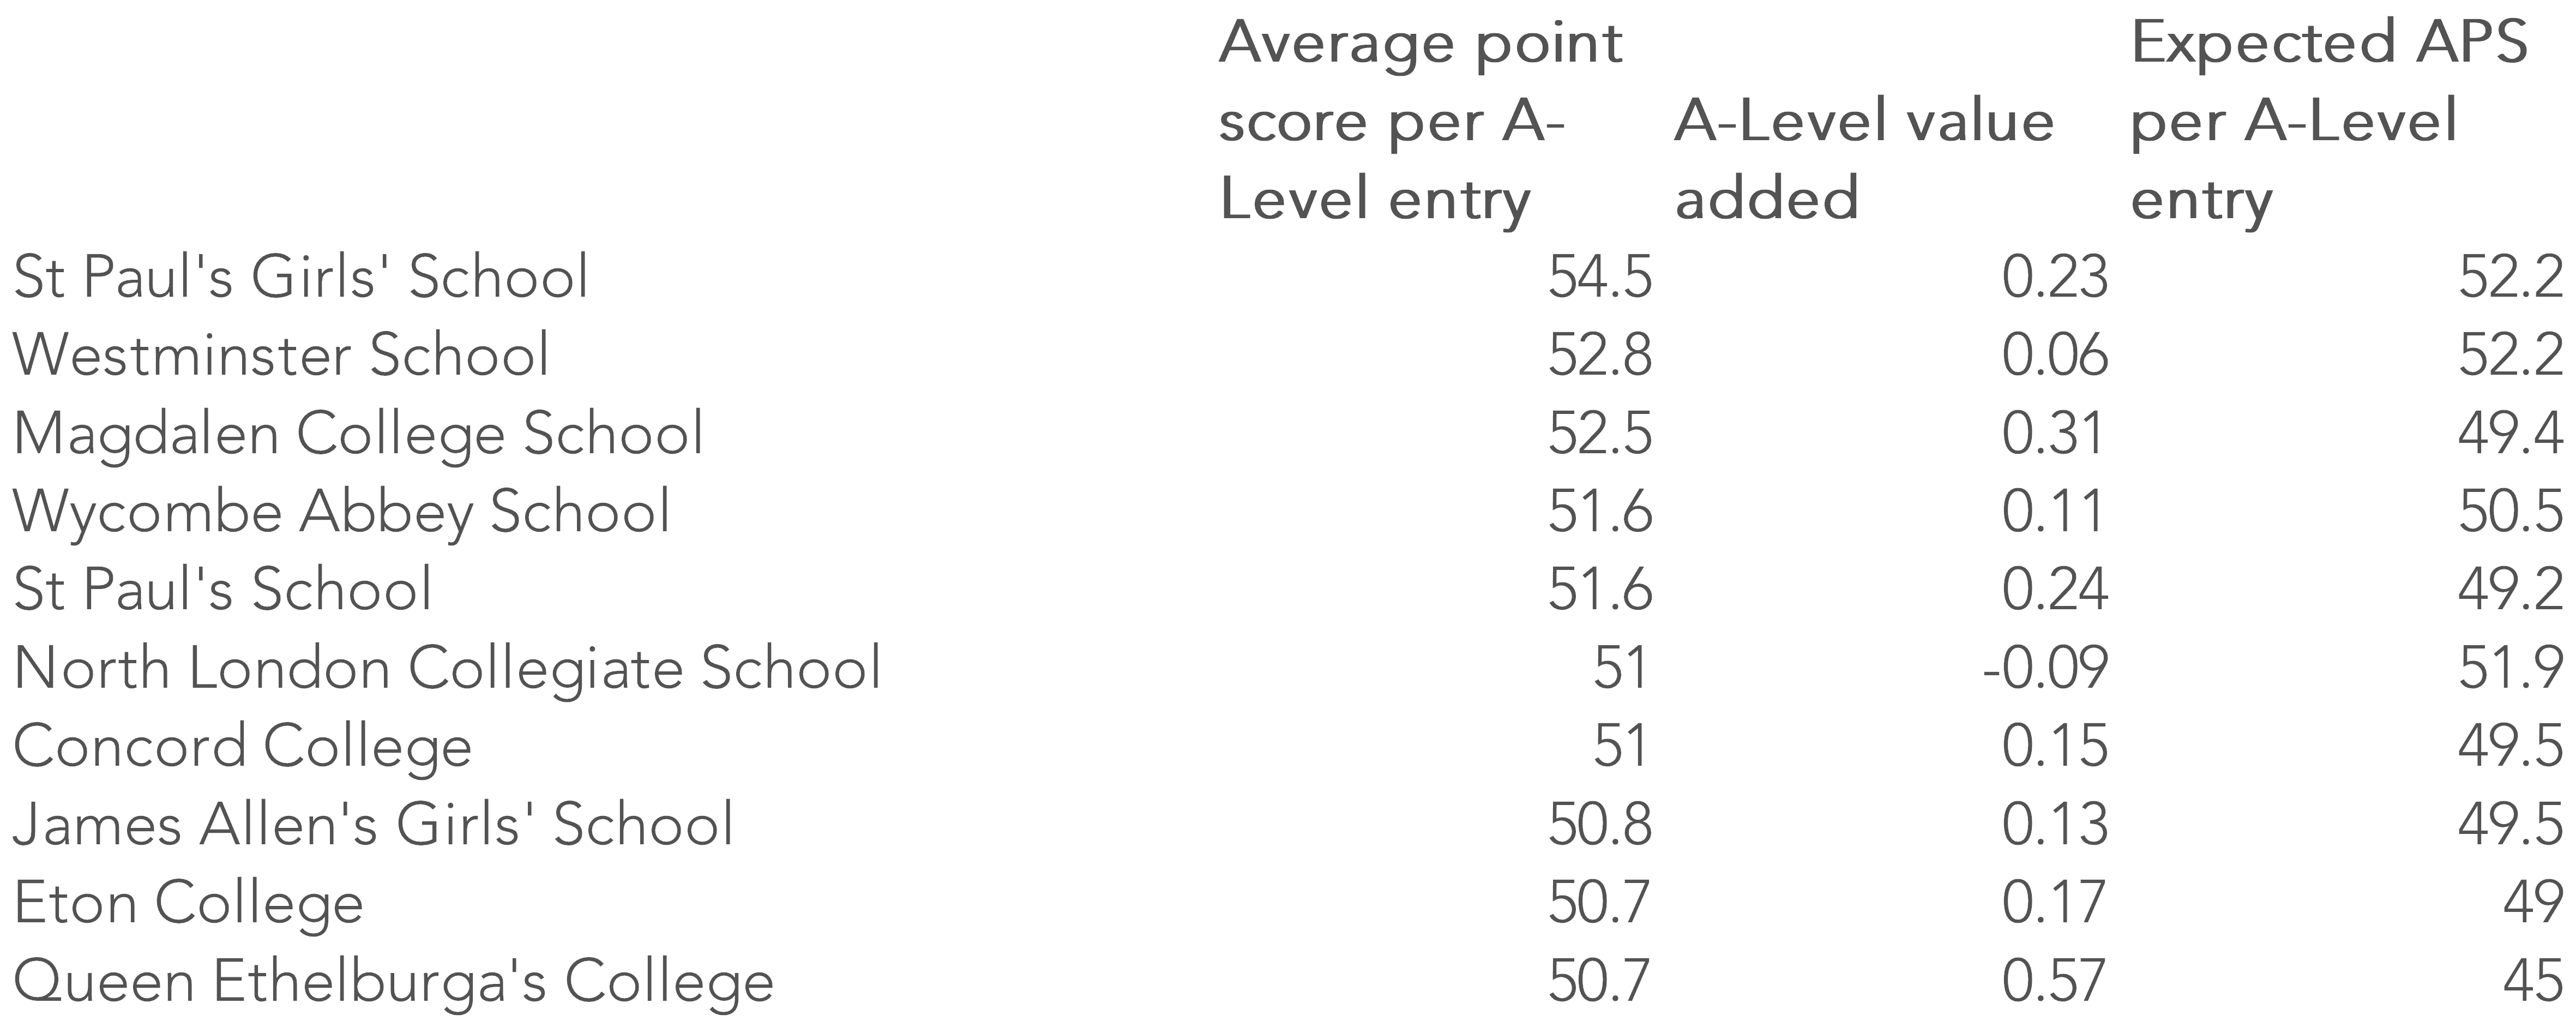
First of all, the 10 highest attaining independent schools:
And now the top 10 highest attaining non-selective state schools (although arguably all sixth forms are selective to some extent):
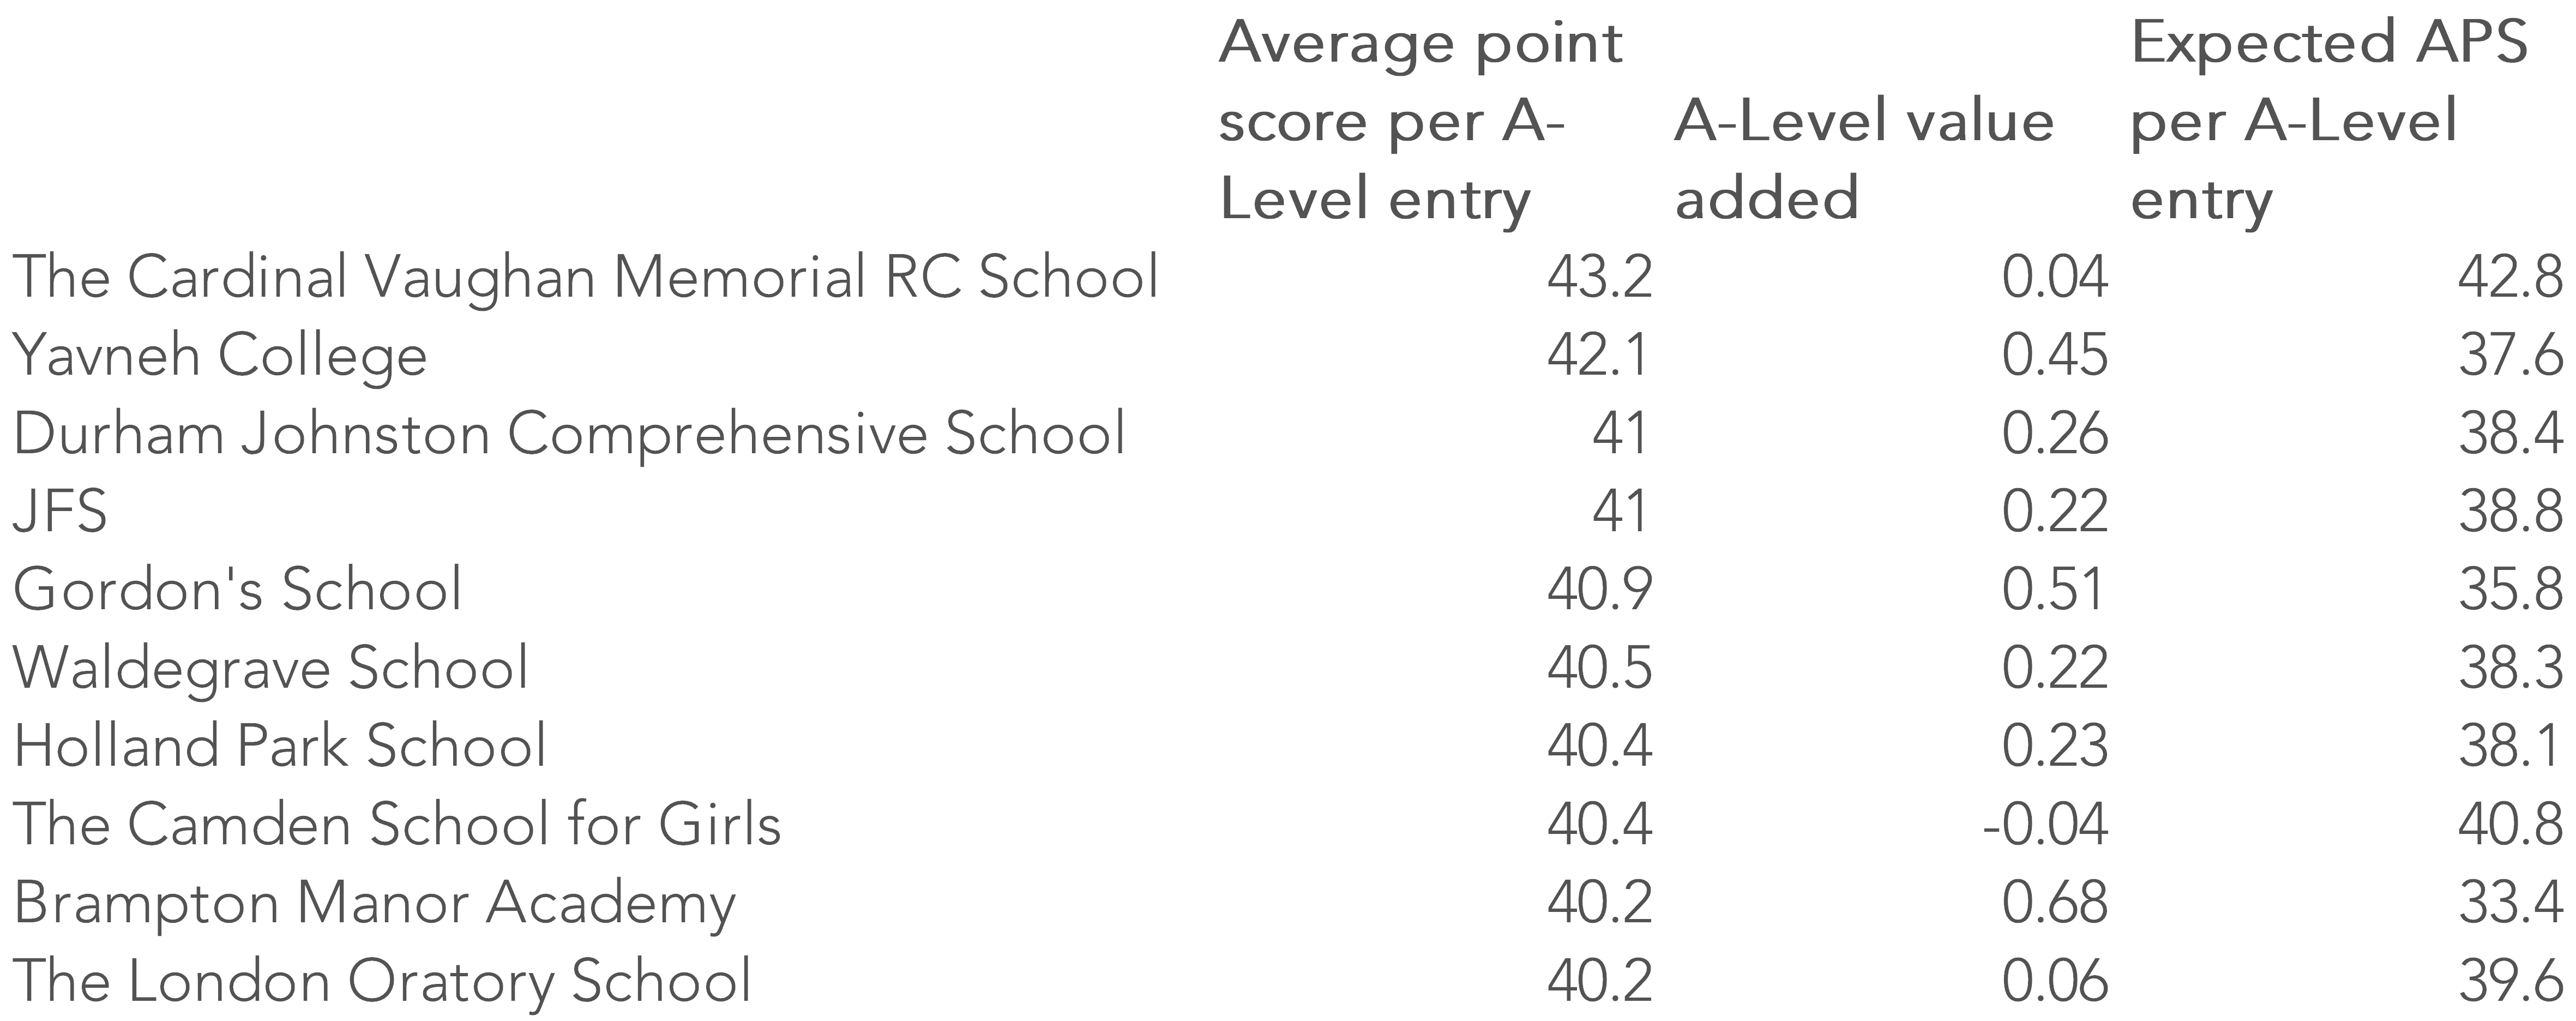
In the final columns of the tables above, I have included the expected APS per A-Level entry implied by the school’s actual APS and value added score. In other words, the APS that corresponds with a value added score of 0[2].
These range from 45 points (half-way between grade B and grade A) to 52 points (just above grade A) among the independent schools, whereas they range from 33 points (above grade C) to 43 points (above grade B) among the state schools.
The expected scores take account of student prior attainment (at Key Stage 4) and the A-Level subjects they studied (as some subjects are graded more severely than others).
So by comparing the 10 highest-attaining state schools and 10 highest-attaining independent schools we are not comparing like-with-like.
We just do not know how a state school would perform with an intake with such high prior attainment as one of the 10 independent schools listed.
A school’s value added score tells you how it performed with the intake it had, not how it would perform with any other intake.
Comparing schools with similar expected results
So, what if we do a different comparison?
What if we compare schools with expected scores between 33.4 and 42.8 (the lowest and highest values among the state schools listed above)? That is, schools expected to achieve broadly similar results, taking into account the prior attainment of their students and the A-Level subjects those students study.
Well, this shows that the independent schools achieve slightly higher value-added scores.
2016 A-Level value added scores, schools with an expected APS per entry between 33.4 and 42.8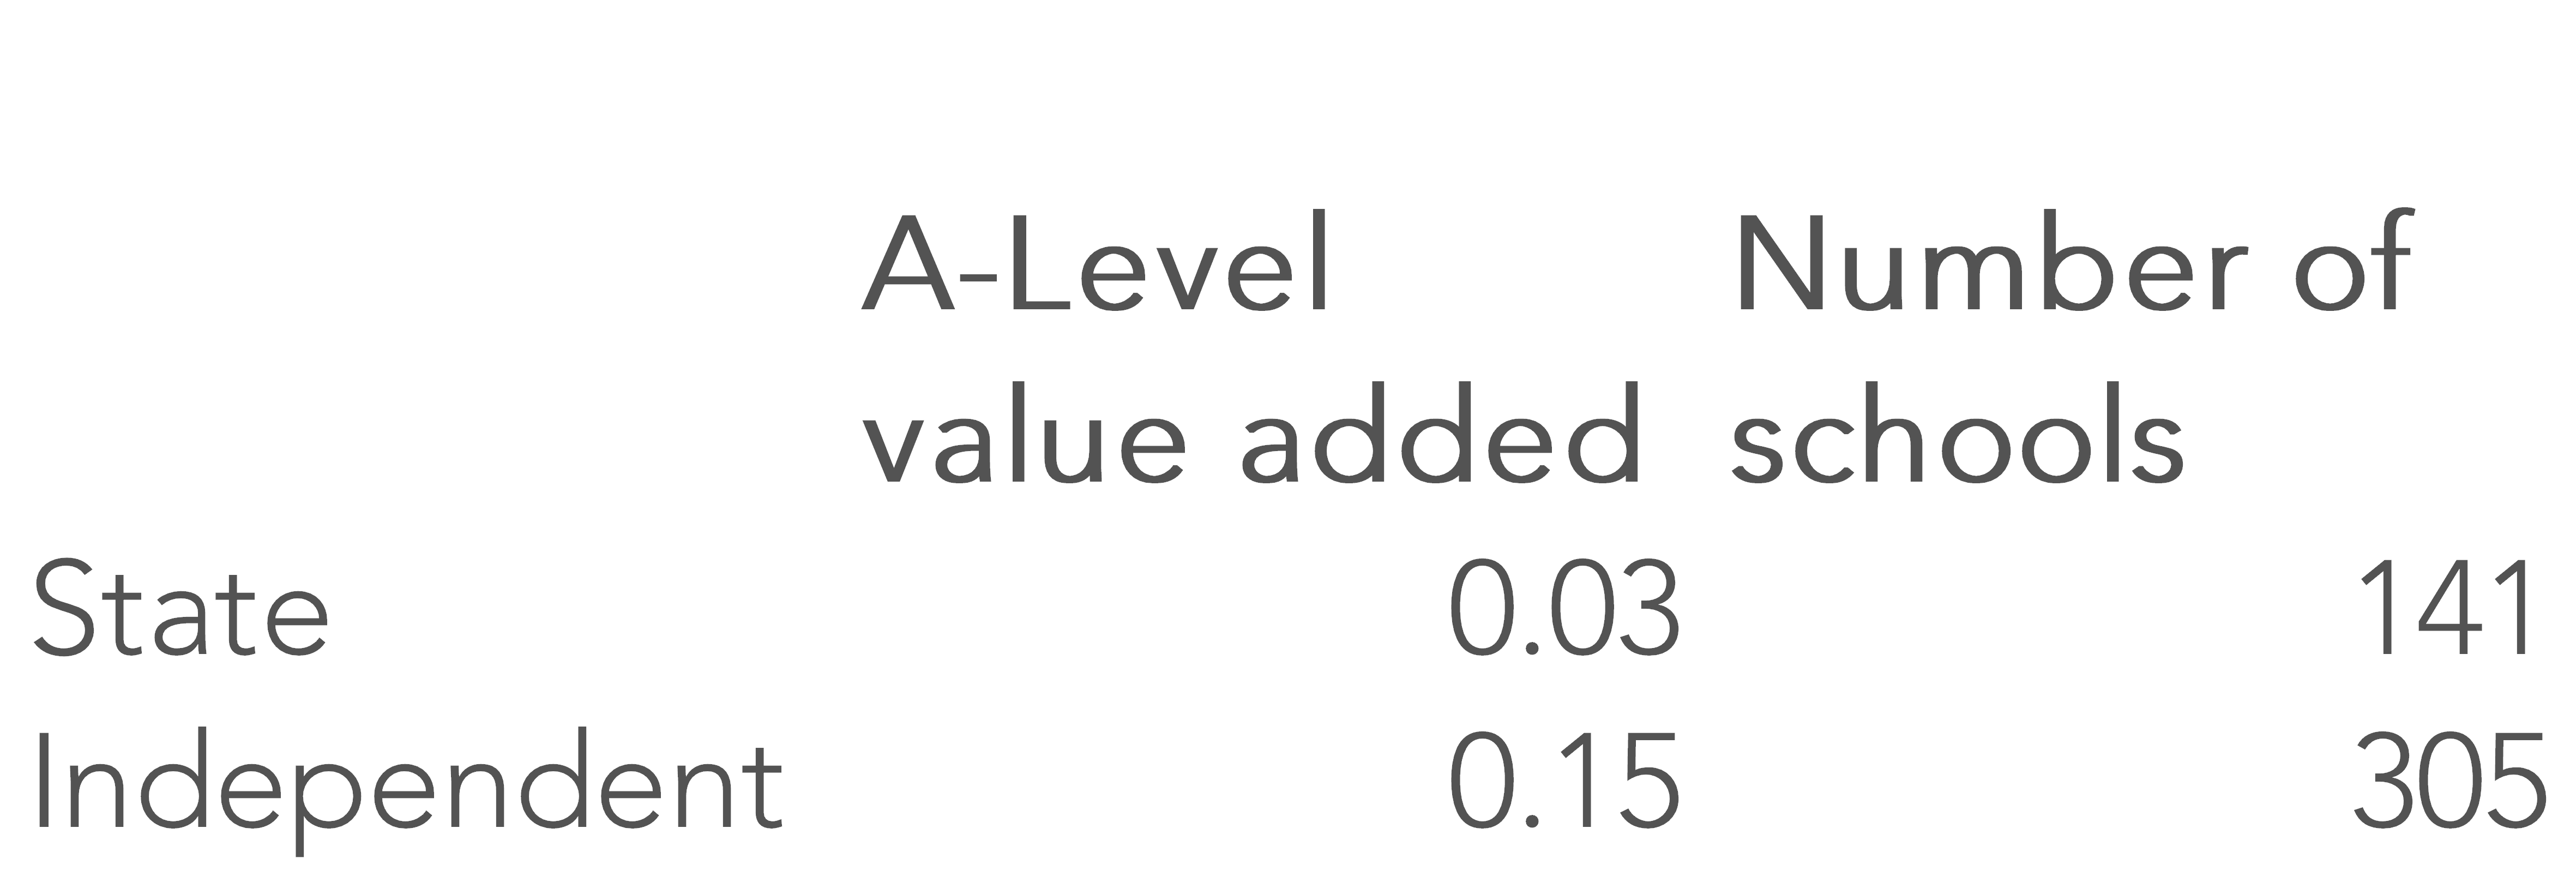
In fact, very similar results are produced when the state schools are matched to independent schools on the basis of expected A-Level results, number of students, mean number of A-Levels per student and whether or not the school is in London.
At the risk of being a killjoy, it seems that independent schools do tend to achieve slightly higher value added scores than state schools where expected results are similar.
It is undeniably the case that there are some comprehensives achieving results on a par with (or even better than) some independents despite students starting from a lower base of KS4 attainment (as some of the later analysis in Tom’s report shows).
For example, students at all 11 state schools in the table below achieved at least a quarter of a grade above expectation in 2016.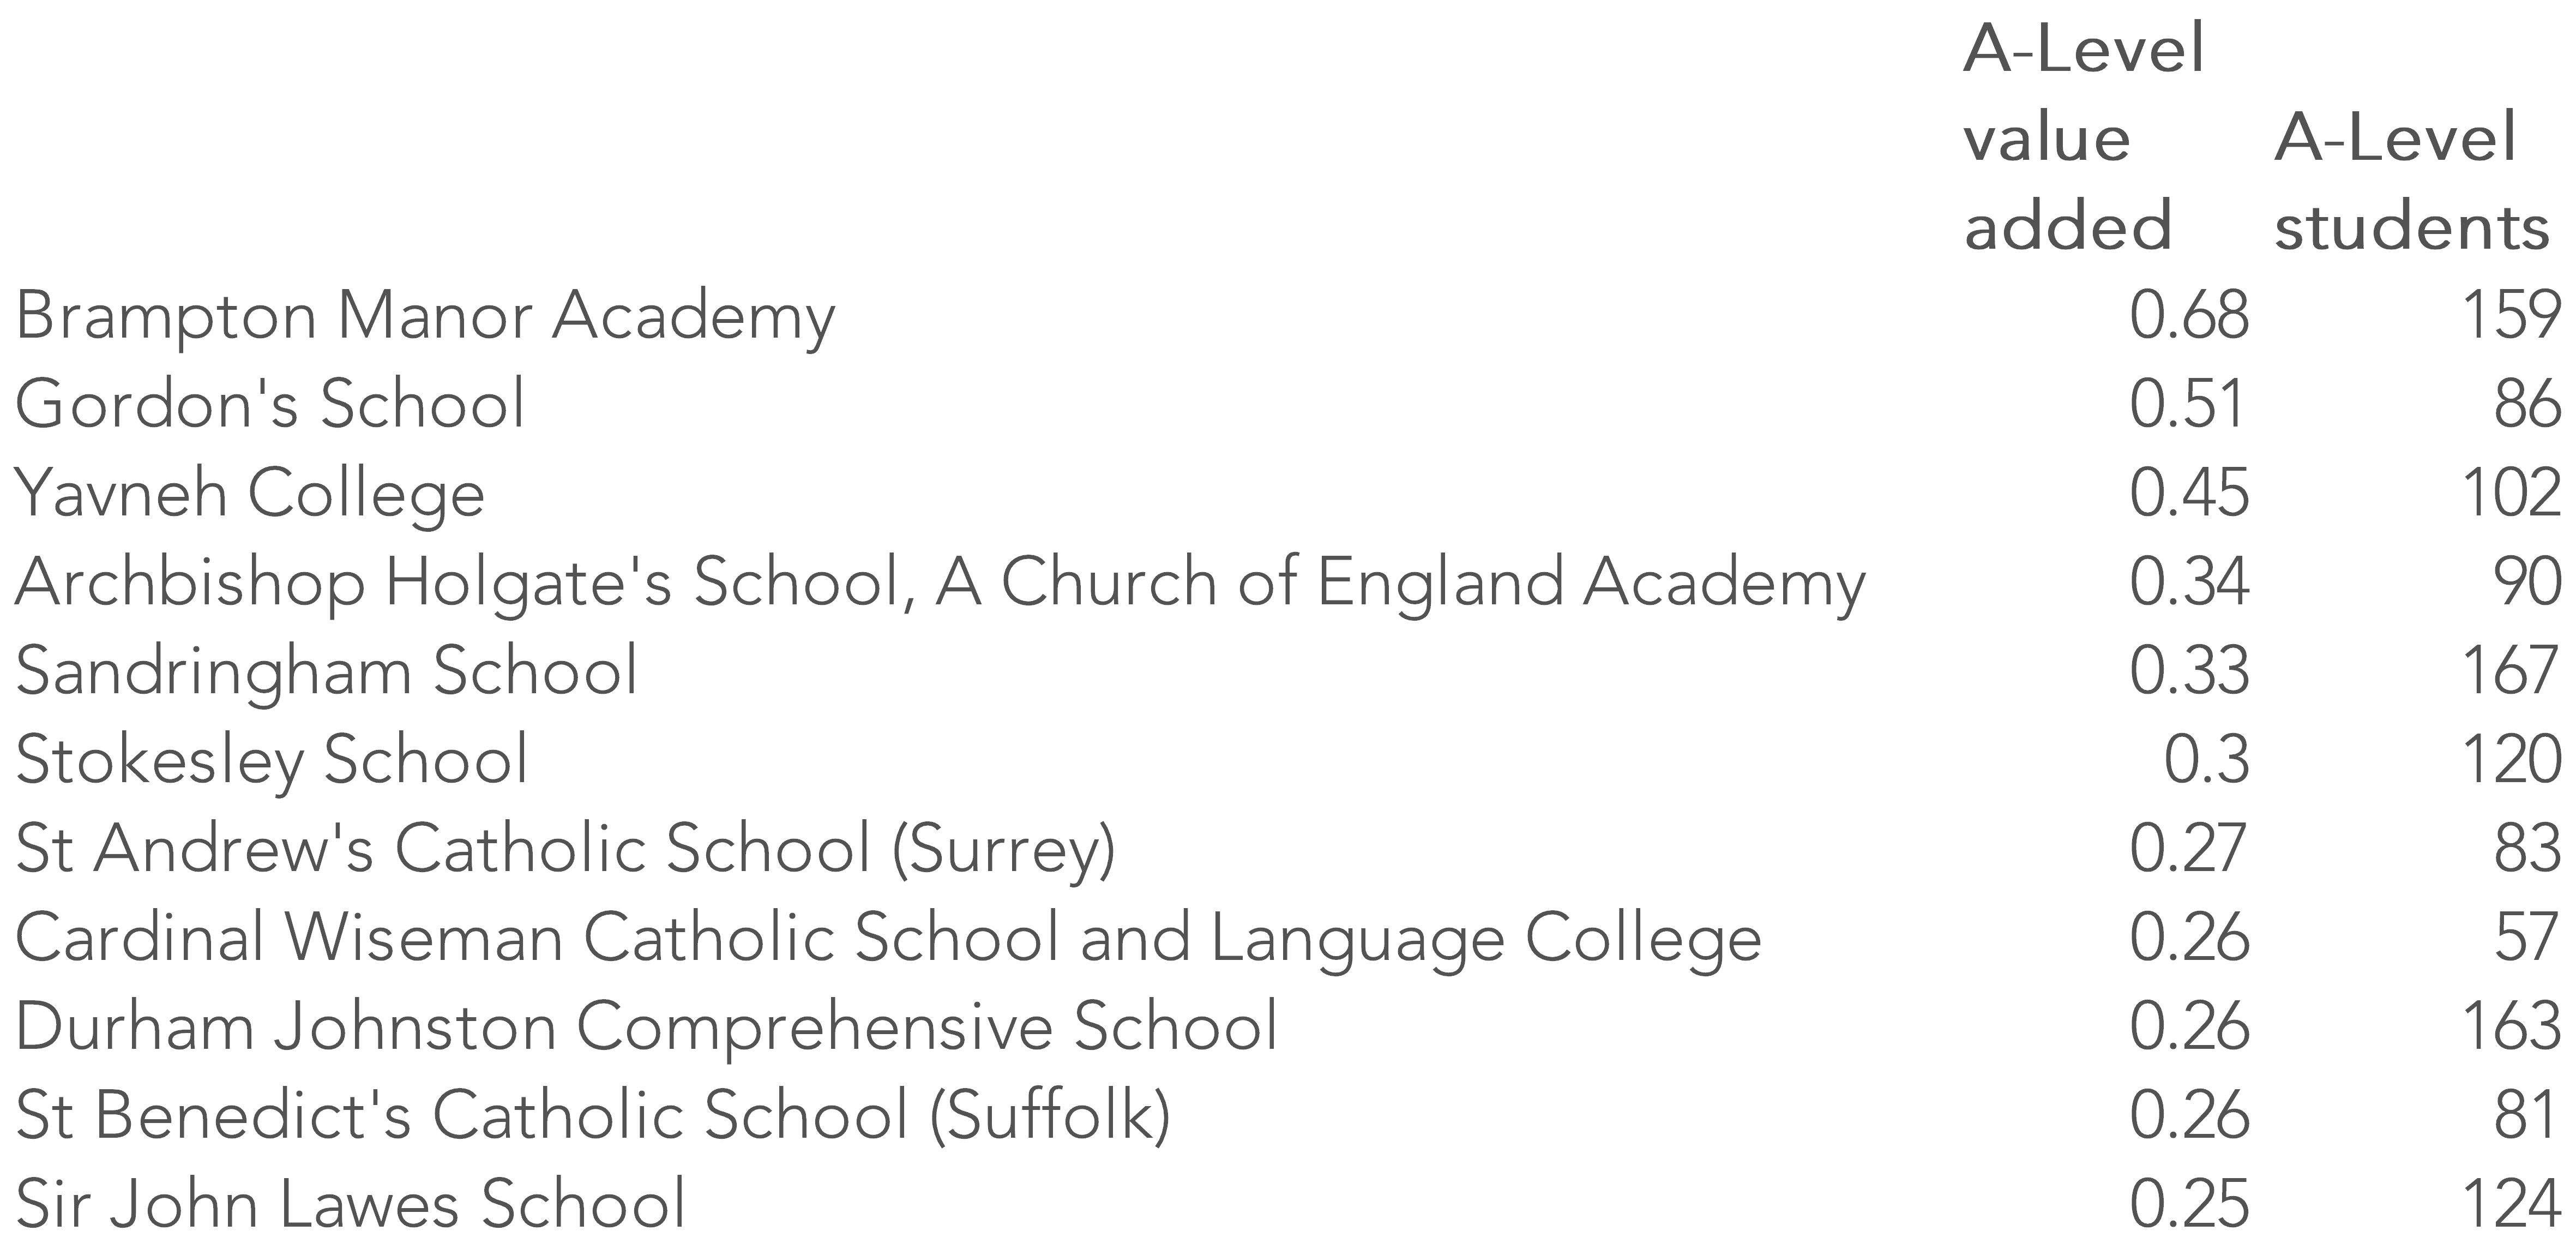
It might be possible to quantify the impact of taking A-Levels at a top comprehensive (however defined) compared to an independent school, but the analysis would have to take place at student-level.
As we could not (ethically) randomise the allocation of students to schools it would be a case of making some assumptions and using observational data to compare a group of top comprehensive students with a group of independent school students who were similar in terms of prior attainment and observed characteristics.
But even then, any conclusions would have caveats.
Want to stay up-to-date with the latest research from Education Datalab? Sign up to our mailing list to get notifications about new blogposts, or to receive our half-termly newsletter.
1. This appears to be a simple average of the 10 schools’ VA scores. I calculate the average to be 0.23 when weighting by the number of A-Level entries
2. Technically, we would need to know the actual APS per entry of students included in the VA measure to calculate this. Some students will not be included in VA calculations due to not being assessed at KS4 in England.


Thanks for taking the time to get behind this data. Very difficult to extract like-for-like when comparing state vs independent. I would be really interested to know how the state Sixth Form Colleges perform against the independent sector. Has there been any research on this?
Thanks for commenting Simon. Based on DfE published value added indicators (as used in this blogpost), the performance of Sixth Form Colleges in A-levels is pretty much identical to non-selective state schools and hence is slightly below that of independent schools.
Can you please explain why the “Expected APS per A-Level Entry” is equal to the Average Point Score per A-Level Entry minus 10 times the A-Level Value Added? For example, the first entry has an Average Point Score per A-Level Entry of 54.5; the A-Value Added is 0.23; and the expected APS Per A-Level Entry is 52.2, which is 54.5 – (10*0.23) = 54.5 – 2.3 = 52.2.
Thanks
Thanks for the question Rocky. The A-level value added score is expressed as a fraction of a grade per entry (e.g. 0.5= half a grade). As a difference of 10 points represents 1 grade on the APS measure (e.g. 5 points= half a grade), I’ve multiplied the value added scores by 10 to put them on the same scale.