This year’s Key Stage 2 performance tables will be published tomorrow, summarising the attainment of pupils in KS2 tests in reading, maths, and grammar, punctuation and spelling (GPS).
But how reliable are these tests, and what does this mean for published performance indicators?
Getting the right balance
A well-designed test should give a pupil the opportunity to show how much she knows about the curriculum of a particular domain.
We cannot test everything, of course, so we test pupils on a sample of the content.
The longer a test, the more reliable it is, although returns quickly begin to diminish.
A balance is struck between achieving decent reliability and not subjecting pupils to overly long tests.
But to what extent does a single test give a reliable measure of a pupil’s current level of attainment?
Perhaps she would have achieved a better score with a different set of test items.
Maybe she was feeling less motivated than usual on the day, or the room where the test was taken was too cold.
The same could be said for all her classmates.
What would be the effect on the school’s published performance indicators?
Some numerical reasoning
To investigate this, let’s imagine we had two full sets of maths tests – both consisting of a test in arithmetic and two tests in reasoning, made up of different questions and taken on different days. Ideally they would be equivalent in terms of difficulty.
Clearly we haven’t got the resources to do this. But we can fashion something useful (albeit imperfect) from existing data.
In 2016 (and indeed 2017), pupils took two 35-mark tests in numerical reasoning a day apart. Do these tests give us a different picture of attainment in schools?
(If we had access to the question-level data we could do something better, creating equivalent half-tests using items from all three maths tests. But we don’t.)
The two tests are not quite equivalent in terms of difficulty, as pupils tended to score slightly higher on the first numerical reasoning paper than the second, but they are not wildly different.
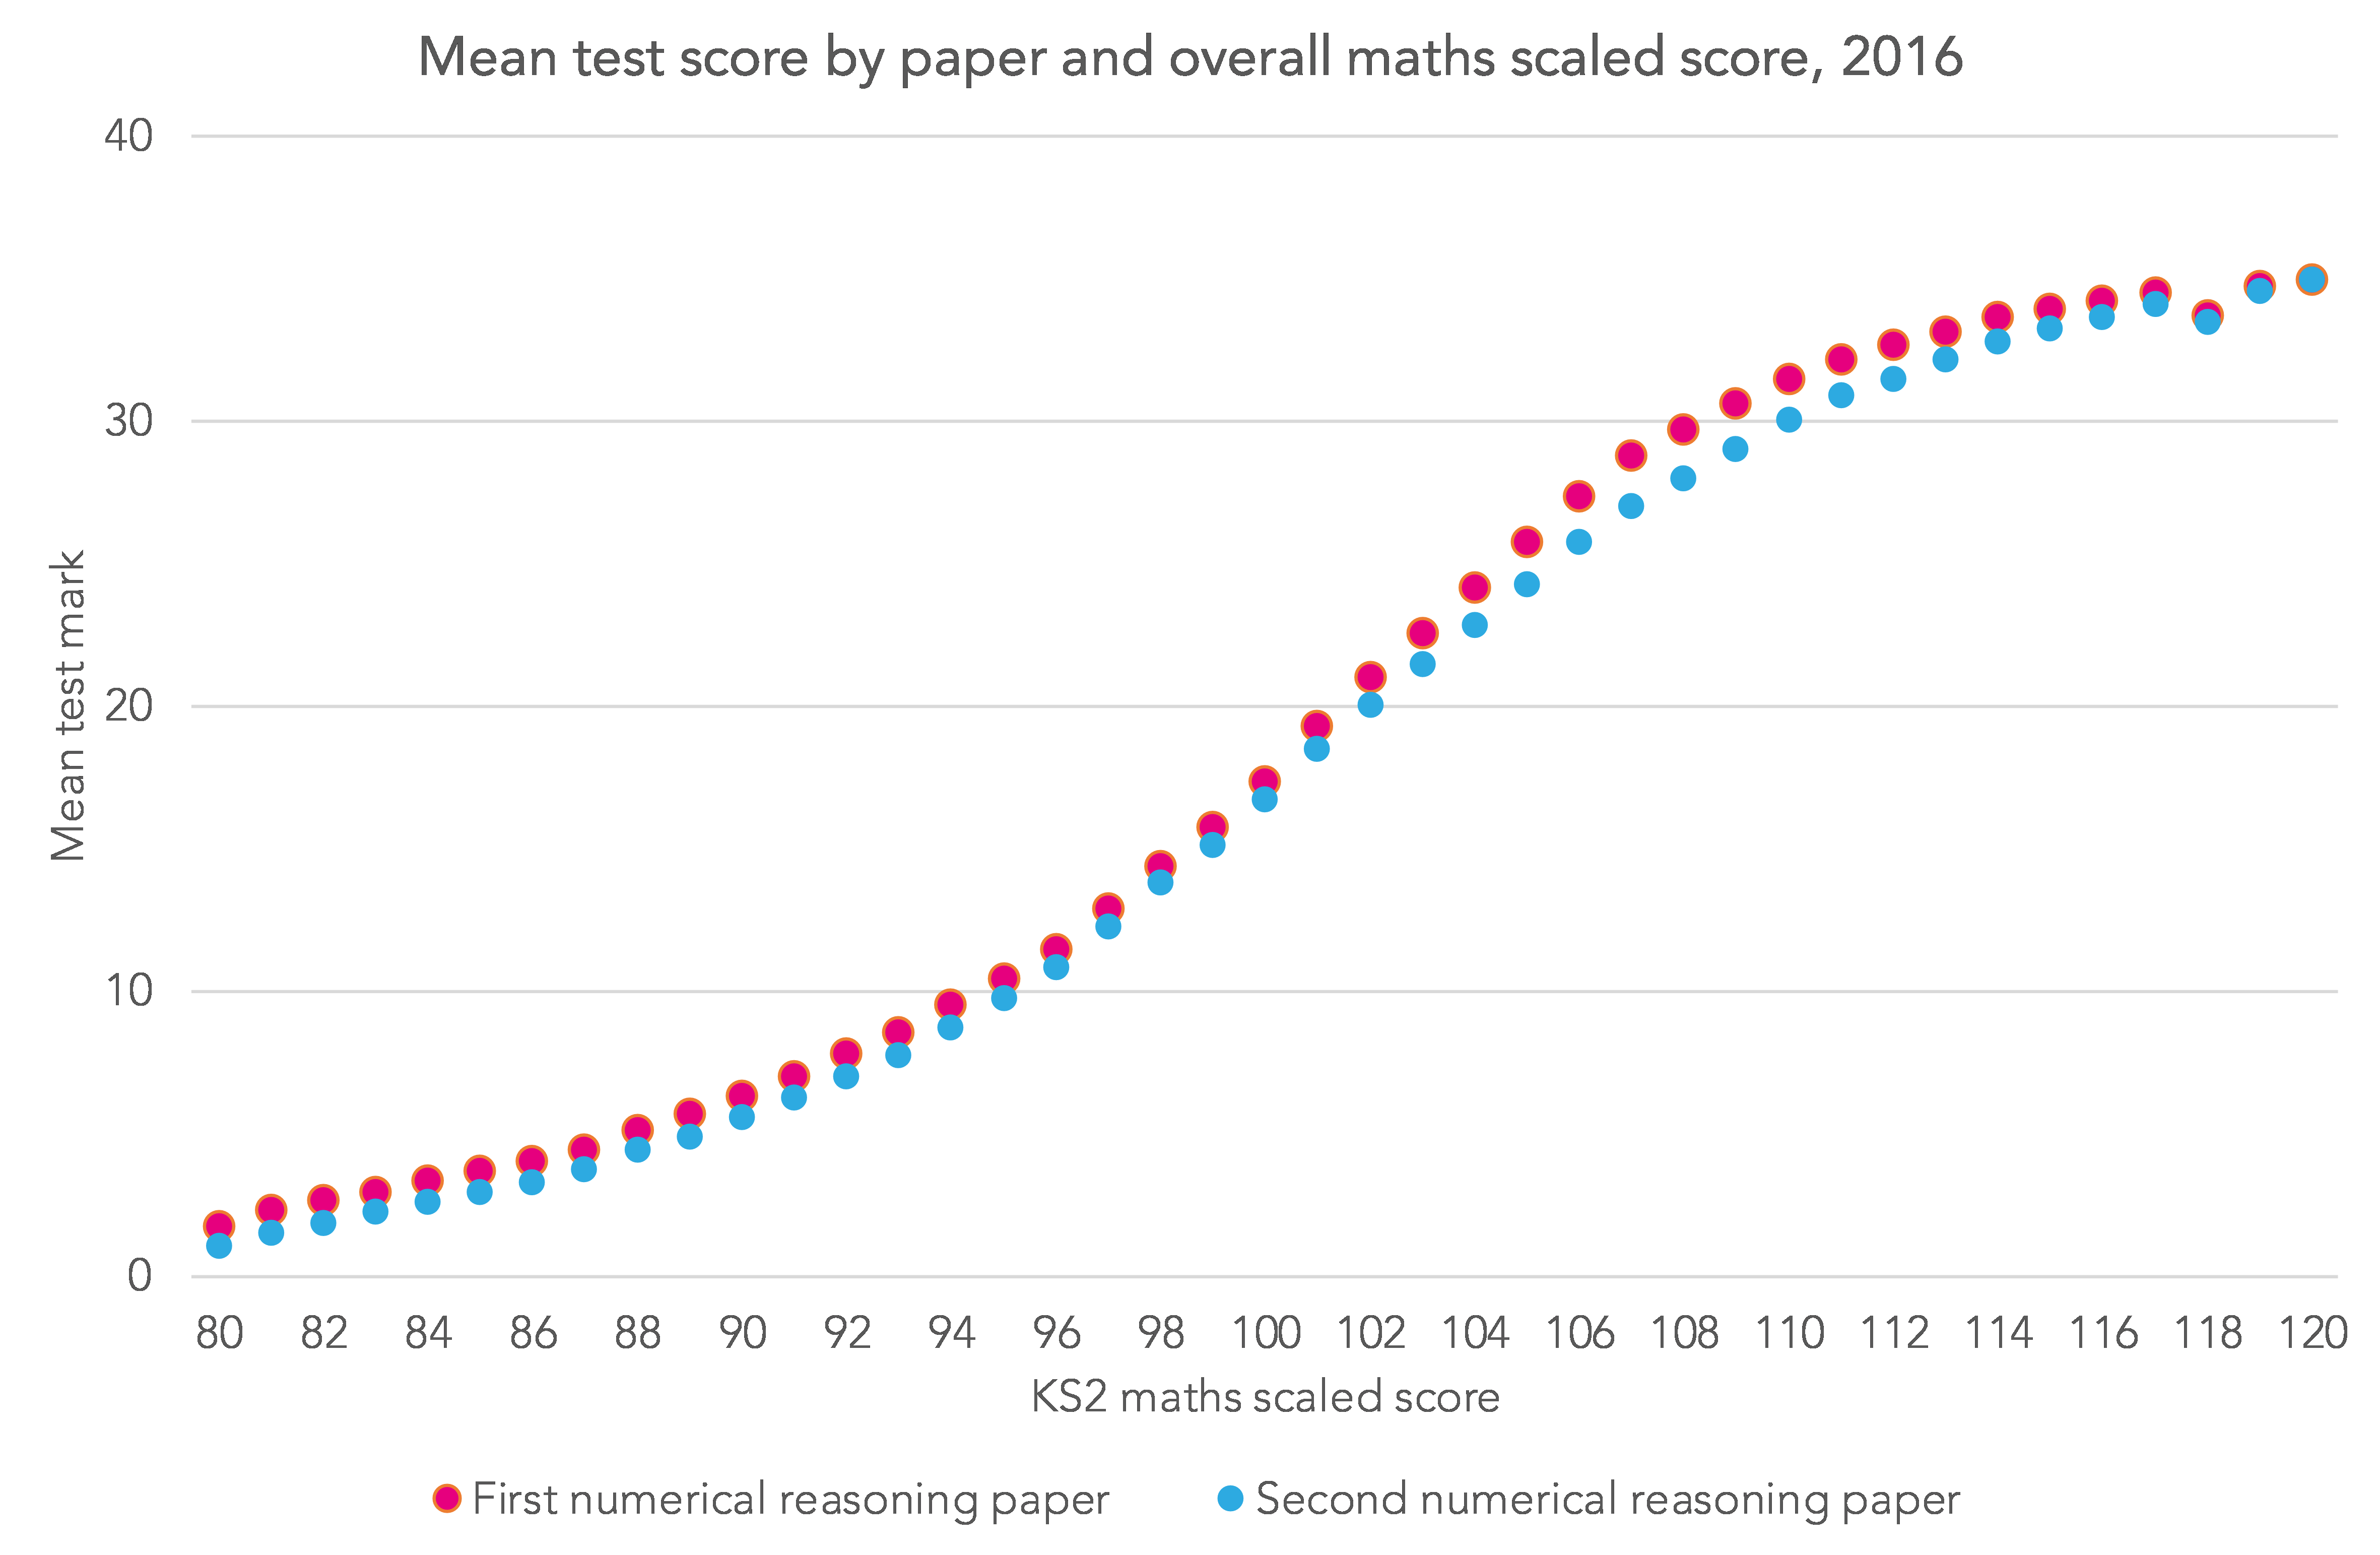
At pupil-level, the correlation between the two test scores is 0.88.
This is pretty good for a pair of 35-mark, 40-minute tests.
In fact, it could even be higher. Firstly, it is attenuated by measurement error – tests can never measure anything with perfect reliability. Secondly, it is reduced by a (slightly) restricted range of pupils as some do not take the tests, due to them working at a lower level. Bearing in mind the domain is mathematics, this could be as good as it gets.
The impact
So what difference does this make to schools’ results?
Let’s set a expected standard for each test, such that around 70% of pupils are deemed to be working at or above this standard. This was the percentage deemed to be at the expected standard in Key Stage 2 maths in 2016.
For maths paper two the threshold was 17 marks (70.2%), and for paper three, 16 marks (70.9%). The following chart compares the percentage of pupils at this expected standard based on the two tests at each school.
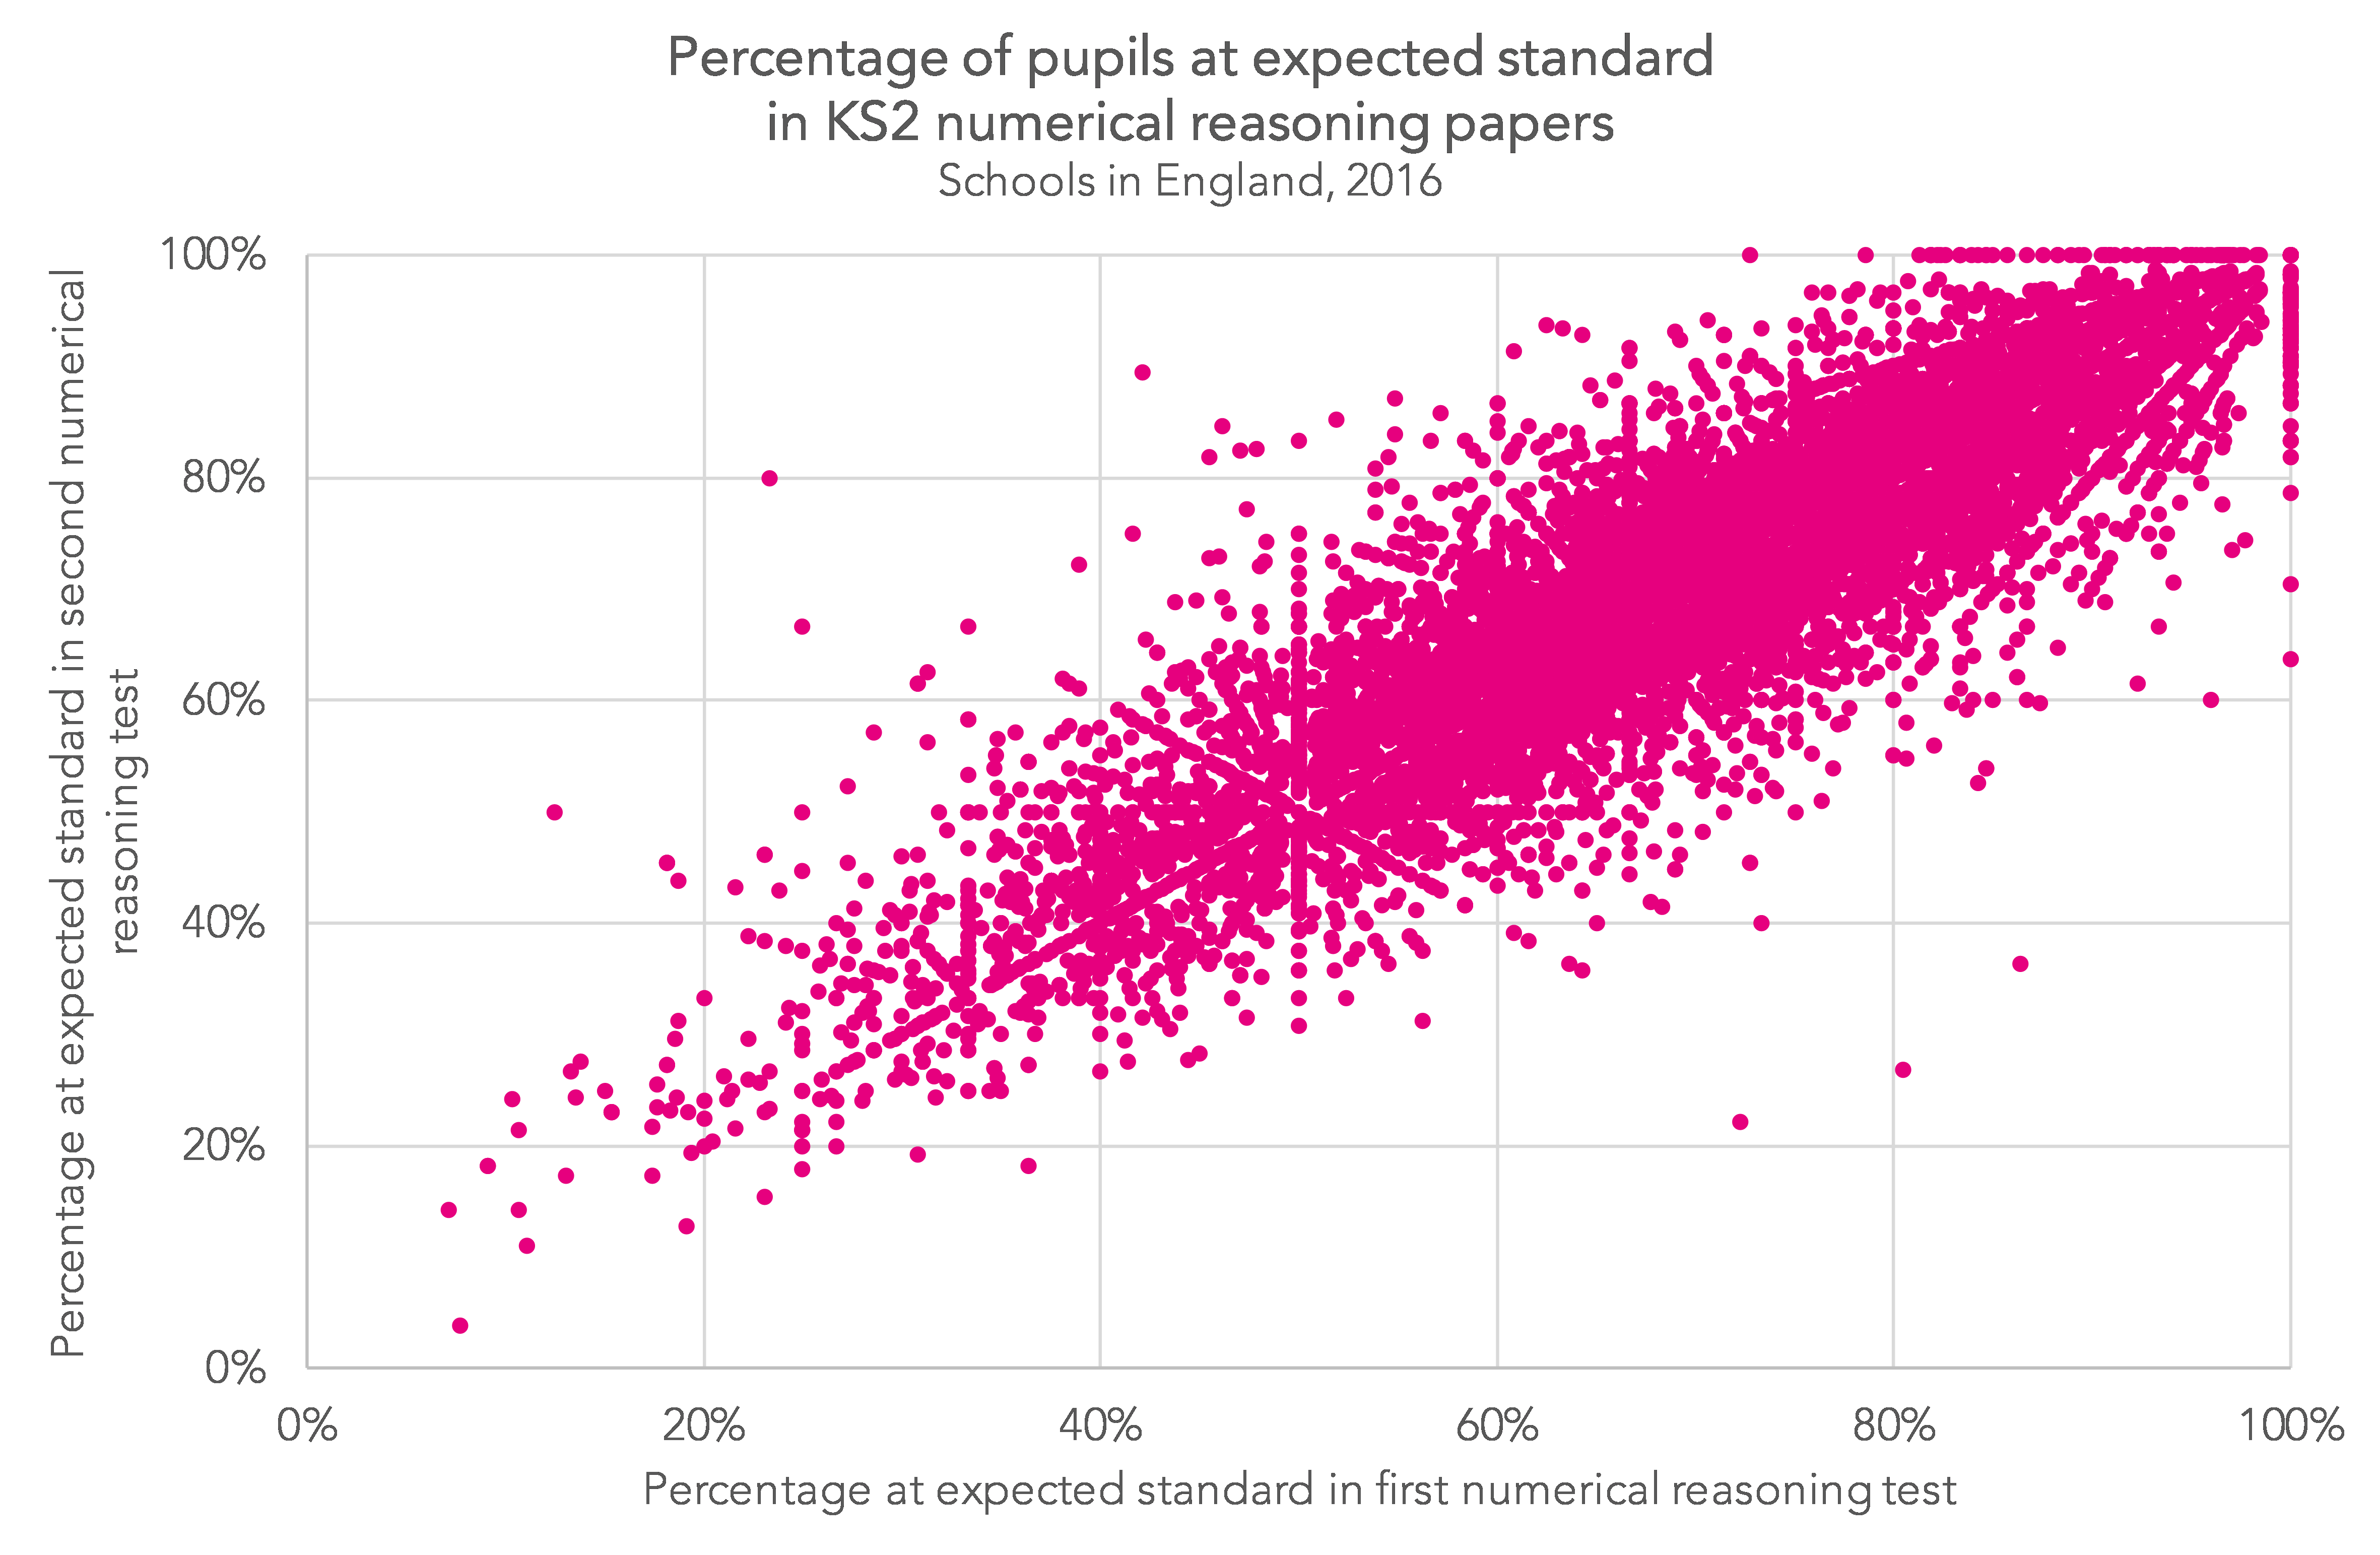
Overall, the correlation between both tests at school-level is high, at 0.89.
But even so, there are sizeable differences in performance for some schools.
We cannot assume that the differences would be so great if a test-retest analysis was performed on the full suite of Key Stage 2 maths tests (i.e. two papers in reasoning and one paper in arithmetic).
But we can probably confidently suggest from this that schools doing standardised tests may well see variation in results, and sometimes these variations will be large.
All the more so if pupil motivation varies from test to test.
It’s unlikely that someone would look at the results of two tests taken a day apart and attempt to draw strong conclusions from them. But for tests taken weeks apart, or a year apart, they might– and that is something to be cautious of.
In 2013, Ofqual published a very useful reliability compendium. However, it is now out of date. We need to know more about the reliability of the new Key Stage 2 tests, and about common tests used in schools more generally.
Want to stay up-to-date with the latest research from Education Datalab? Follow Education Datalab on Twitter to get all of our research as it comes out.


Is it necessary to give pupils (at the end of ks2) precisely the same tests, Year on Year, in order to be able to compare data accurately over time – and as they progress from Year 3 to Year 6? Also, without levels now, how accurately can any assessments within the primary age range be used in a predictive mannner?