Answer: It isn’t.
So why ask the question?
Well, among the glut of statistics published by the Department for Education on Thursday was a statistical first release on the performance of multi-academy trusts (MATs) [PDF].
At the top of the second page was this curious chart.
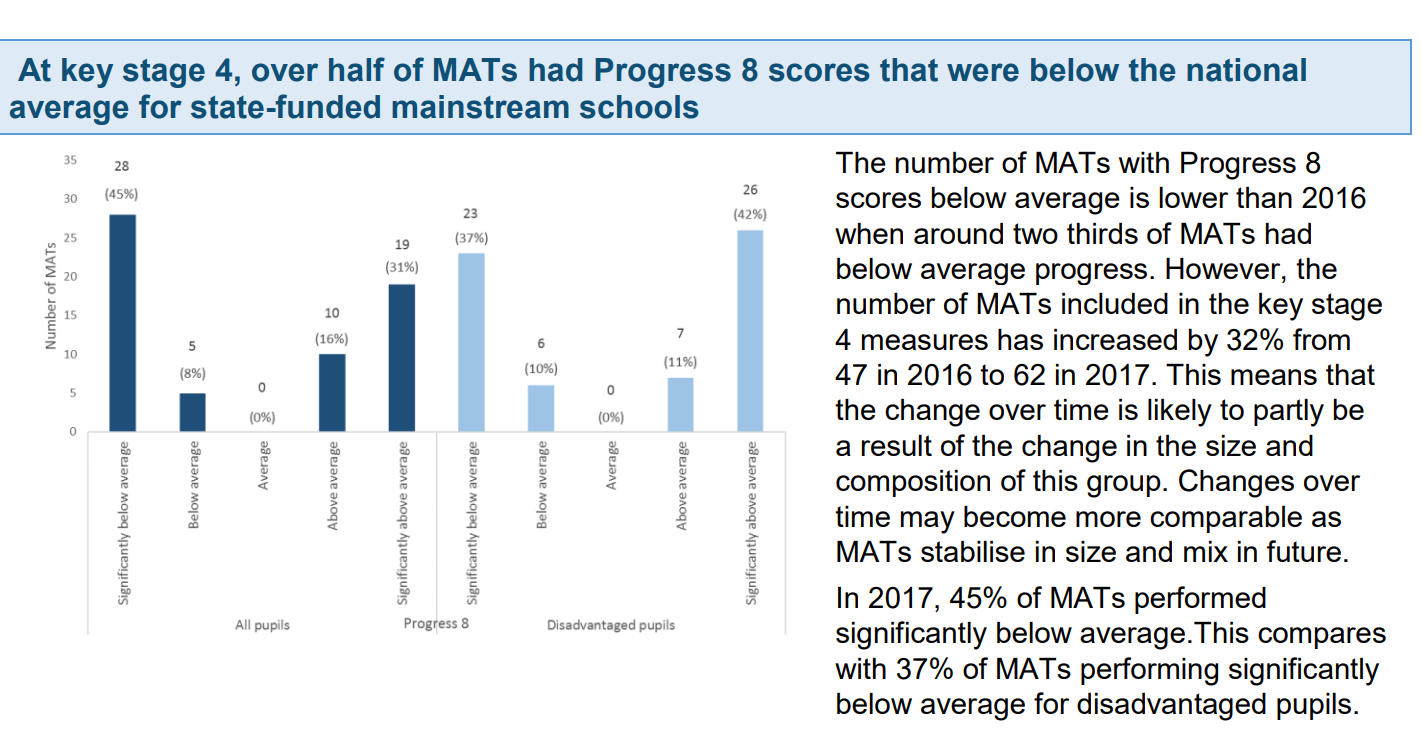
At first glance, this looks rather alarming. It seems to suggest that the performance of MATs was either extremely negative or extremely positive. None is classified as “average”. This is a big story and, sure enough, The Guardian picked up on it.
But does the data support this conclusion?
Data on the 62 MATs reported in the SFR can be downloaded for further inspection by anyone from here [XLS].
If you produce a histogram of the mean Progress 8 scores for each MAT, it will look something like the chart below.
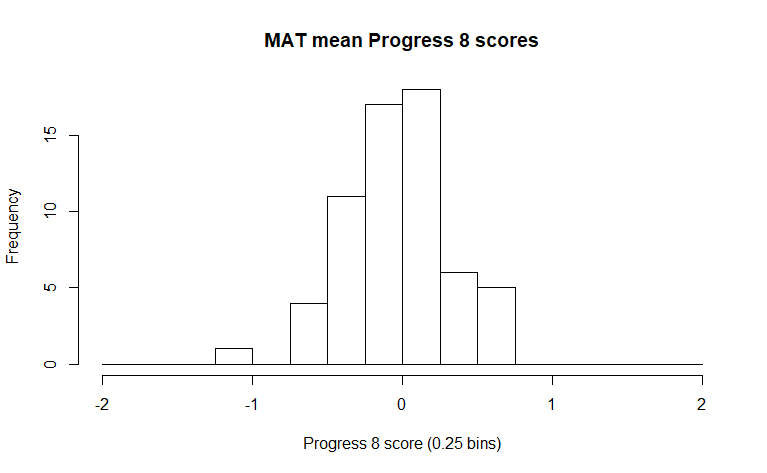
These scores don’t look particularly extreme. Of the 62, four have a score below -0.5, and five have a score above 0.5, but over half have a score between -0.25 and 0.25.
So what is going on?
The answer is that perennial favourite: mistaking statistical significance for educational importance.
Some of these MATs are very large. As a result, any difference, however small, between a MAT’s mean Progress 8 score and the national average (0) would result in it being classified as significantly different from average.
Let’s take E-ACT as an example. The 1,651 pupils at the end of Key Stage 4 in its 11 schools achieved an average Progress 8 score of -0.1. This is classified as significantly below average. But the score of -0.1 notionally represents one grade (on the 9-1 GCSE scale) in one of the 10 subjects included in Progress 8 (English and maths count double) per pupil. In practical terms, a minuscule difference.
In fact, with 1,651 pupils, scores of 0.06 or above would be classified as significantly above average and scores of -0.06 or lower as significantly below average.
The funnel plot below shows the mean Progress 8 scores for the 62 MATs. Any plotted outside the dashed lines that form the funnel would be classified as significantly different from average.
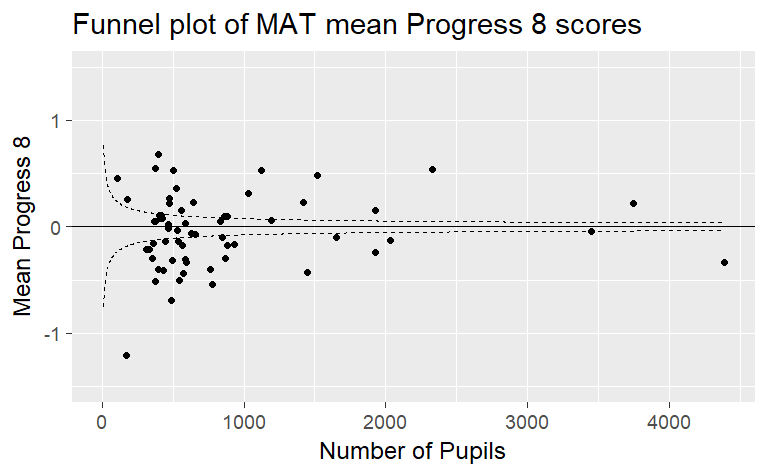
With a large enough number of pupils, almost any difference will be significant.
Finally, we return to the SFR and the surprising lack of MATs classified as average. As far as I can tell from inspecting the underlying data, this would only occur if a MAT achieved a P8 score of 0 exactly.
I have no idea why the chart that appeared in the SFR was considered a suitable way of showing the variation in MAT performance but, in my view, it is misleading. It certainly isn’t suitable for a publication that carries the Official Statistics banner.
Want to stay up-to-date with the latest research from Education Datalab? Sign up to our mailing list to get notifications about new blogposts, or to receive our half-termly newsletter.


So this means that MATs, on average, are no better or worse (on this measure) than other types of schools?
Actually this is a very important article and needs to be taken on board by the DfE