Progress 8 is a school-level attainment measure that takes account of pupils’ prior attainment at the end of Key Stage 2. However, the measure only includes who reach the end of Key Stage 4 at a school.
But what about those pupils who left schools before January of Year 11 and who aren’t included in Progress 8? What if they were included?
The perverse incentive of Progress 8
The Department for Education (DfE) plans to make changes to the Progress 8 methodology [PDF, p.13] this year to reduce the effect of “outliers”, or pupils with extremely negative Progress 8 scores.
These tend to be pupils with average Key Stage 2 results or better, who go on to achieve very little by the end of Key Stage 4 for a variety of reasons such as illness, bereavement or refusing to attend. We wrote about the issue here.
Capping the P8 scores of “outliers” will go some way to addressing perhaps the most perverse incentive in Progress 8, namely to manage such pupils off-roll before the January of Year 11. If they do so, then such pupils won’t be included in the school’s published performance statistics.
Measuring from the beginning rather than the end
Progress 8 is calculated for pupils who have reached the end of Key Stage 4 in state schools (mainstream and special). Everybody else – including those who move into PRUs or alternative provision, those who are home-educated, or those who fall out of the system entirely – are not included.
The Progress 8 model, which summarises the relationship between Attainment 8 scores and Key Stage 2 scores, is meanwhile based just on those pupils who reach the end of Key Stage 4 in mainstream schools.
For this alternative measure, we identify all pupils who were assessed at the end of Key Stage 2 in 2011/12 and who were on the roll of a state-funded mainstream school in January 2013. We report pupils at the school they were attending at this point, regardless of where they completed Key Stage 4.
Exceptions are made for a) pupils attending middle schools, and b) schools which merged or amalgamated between 2012/13 and 2016/17.
In the case of a), pupils are reported at the first school with a Key Stage 4 cohort they attend.
For b), pupils are reported at the school formed following merger/amalgamation.
Destinations
A total of 516,000 pupils are in our cohort, almost 483,000 of whom (93%) were included in the national Progress 8 calculations in 2017 at a state-funded mainstream school[1] excluding schools which admit at age 14 (UTCs and studio schools)
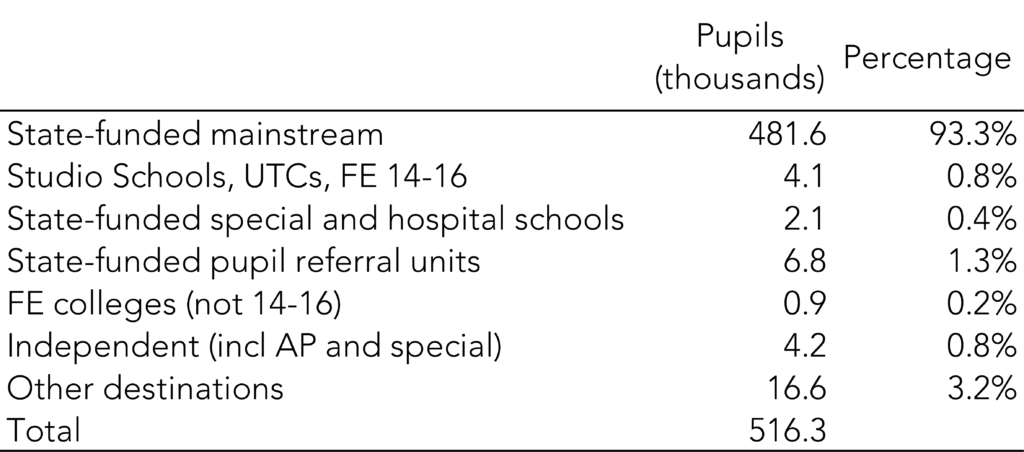
The destinations of the remaining 7% are shown in the table below. Almost 7,000 pupils completed Key Stage 4 at a state-funded pupil referral unit, 4,000 moved to state-funded establishments which admit at age 14 (studio schools, UTCs and some FE colleges) and another 4,000 moved into the independent sector (including independent alternative provision). The destinations of almost 17,000 young people are recorded as unknown. These will include those in home education and those who have emigrated, among other outcomes.
End of Key Stage 4 destinations 2017
Pupils on roll in Year 7 in state-funded mainstream schools[2], January 2013
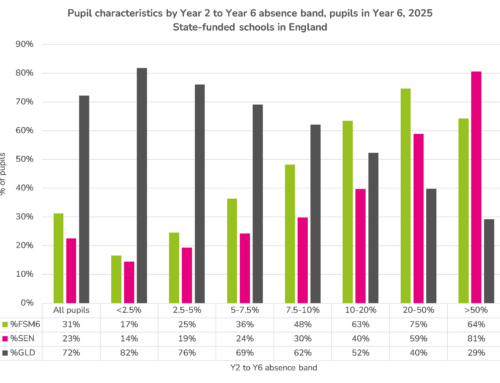
But while an average of 7% of pupils leave the state-funded mainstream sector, this figure is much larger for certain pupil groups. These include:
- over half of Gypsy/Roma and Irish heritage Traveller pupils
- 15% of pupils classified as long-term disadvantaged[3]
- 10% of black Caribbean and mixed white/black Caribbean pupils
These figures, together with recalculated Progress 8 scores by ethnicity and disadvantage, can be found in an appendix table accessible here [PDF].
Predicted scores
Producing our alternative Progress 8 involves recalculating the predicted values for each Key Stage 2 fine grade, which are the values against which each pupil’s Attainment 8 score is measured. (Any pupils not found in the 2017 Key Stage 4 data is assigned an Attainment 8 point score of 0.)
Recalculated predicted values are shown as blue dots in the chart below. They tend to be lower than the published P8 predicted values (the pink dots), particularly for pupils with lower levels of Key Stage 2 attainment. Differences can be as large as three points.
This is because of the inclusion in our model of pupils who finish their secondary education in special schools, alternative provision, or elsewhere – who tend to have lower KS4 results than those who finish their secondary schooling in mainstream education – unlike in the published DfE P8 model.
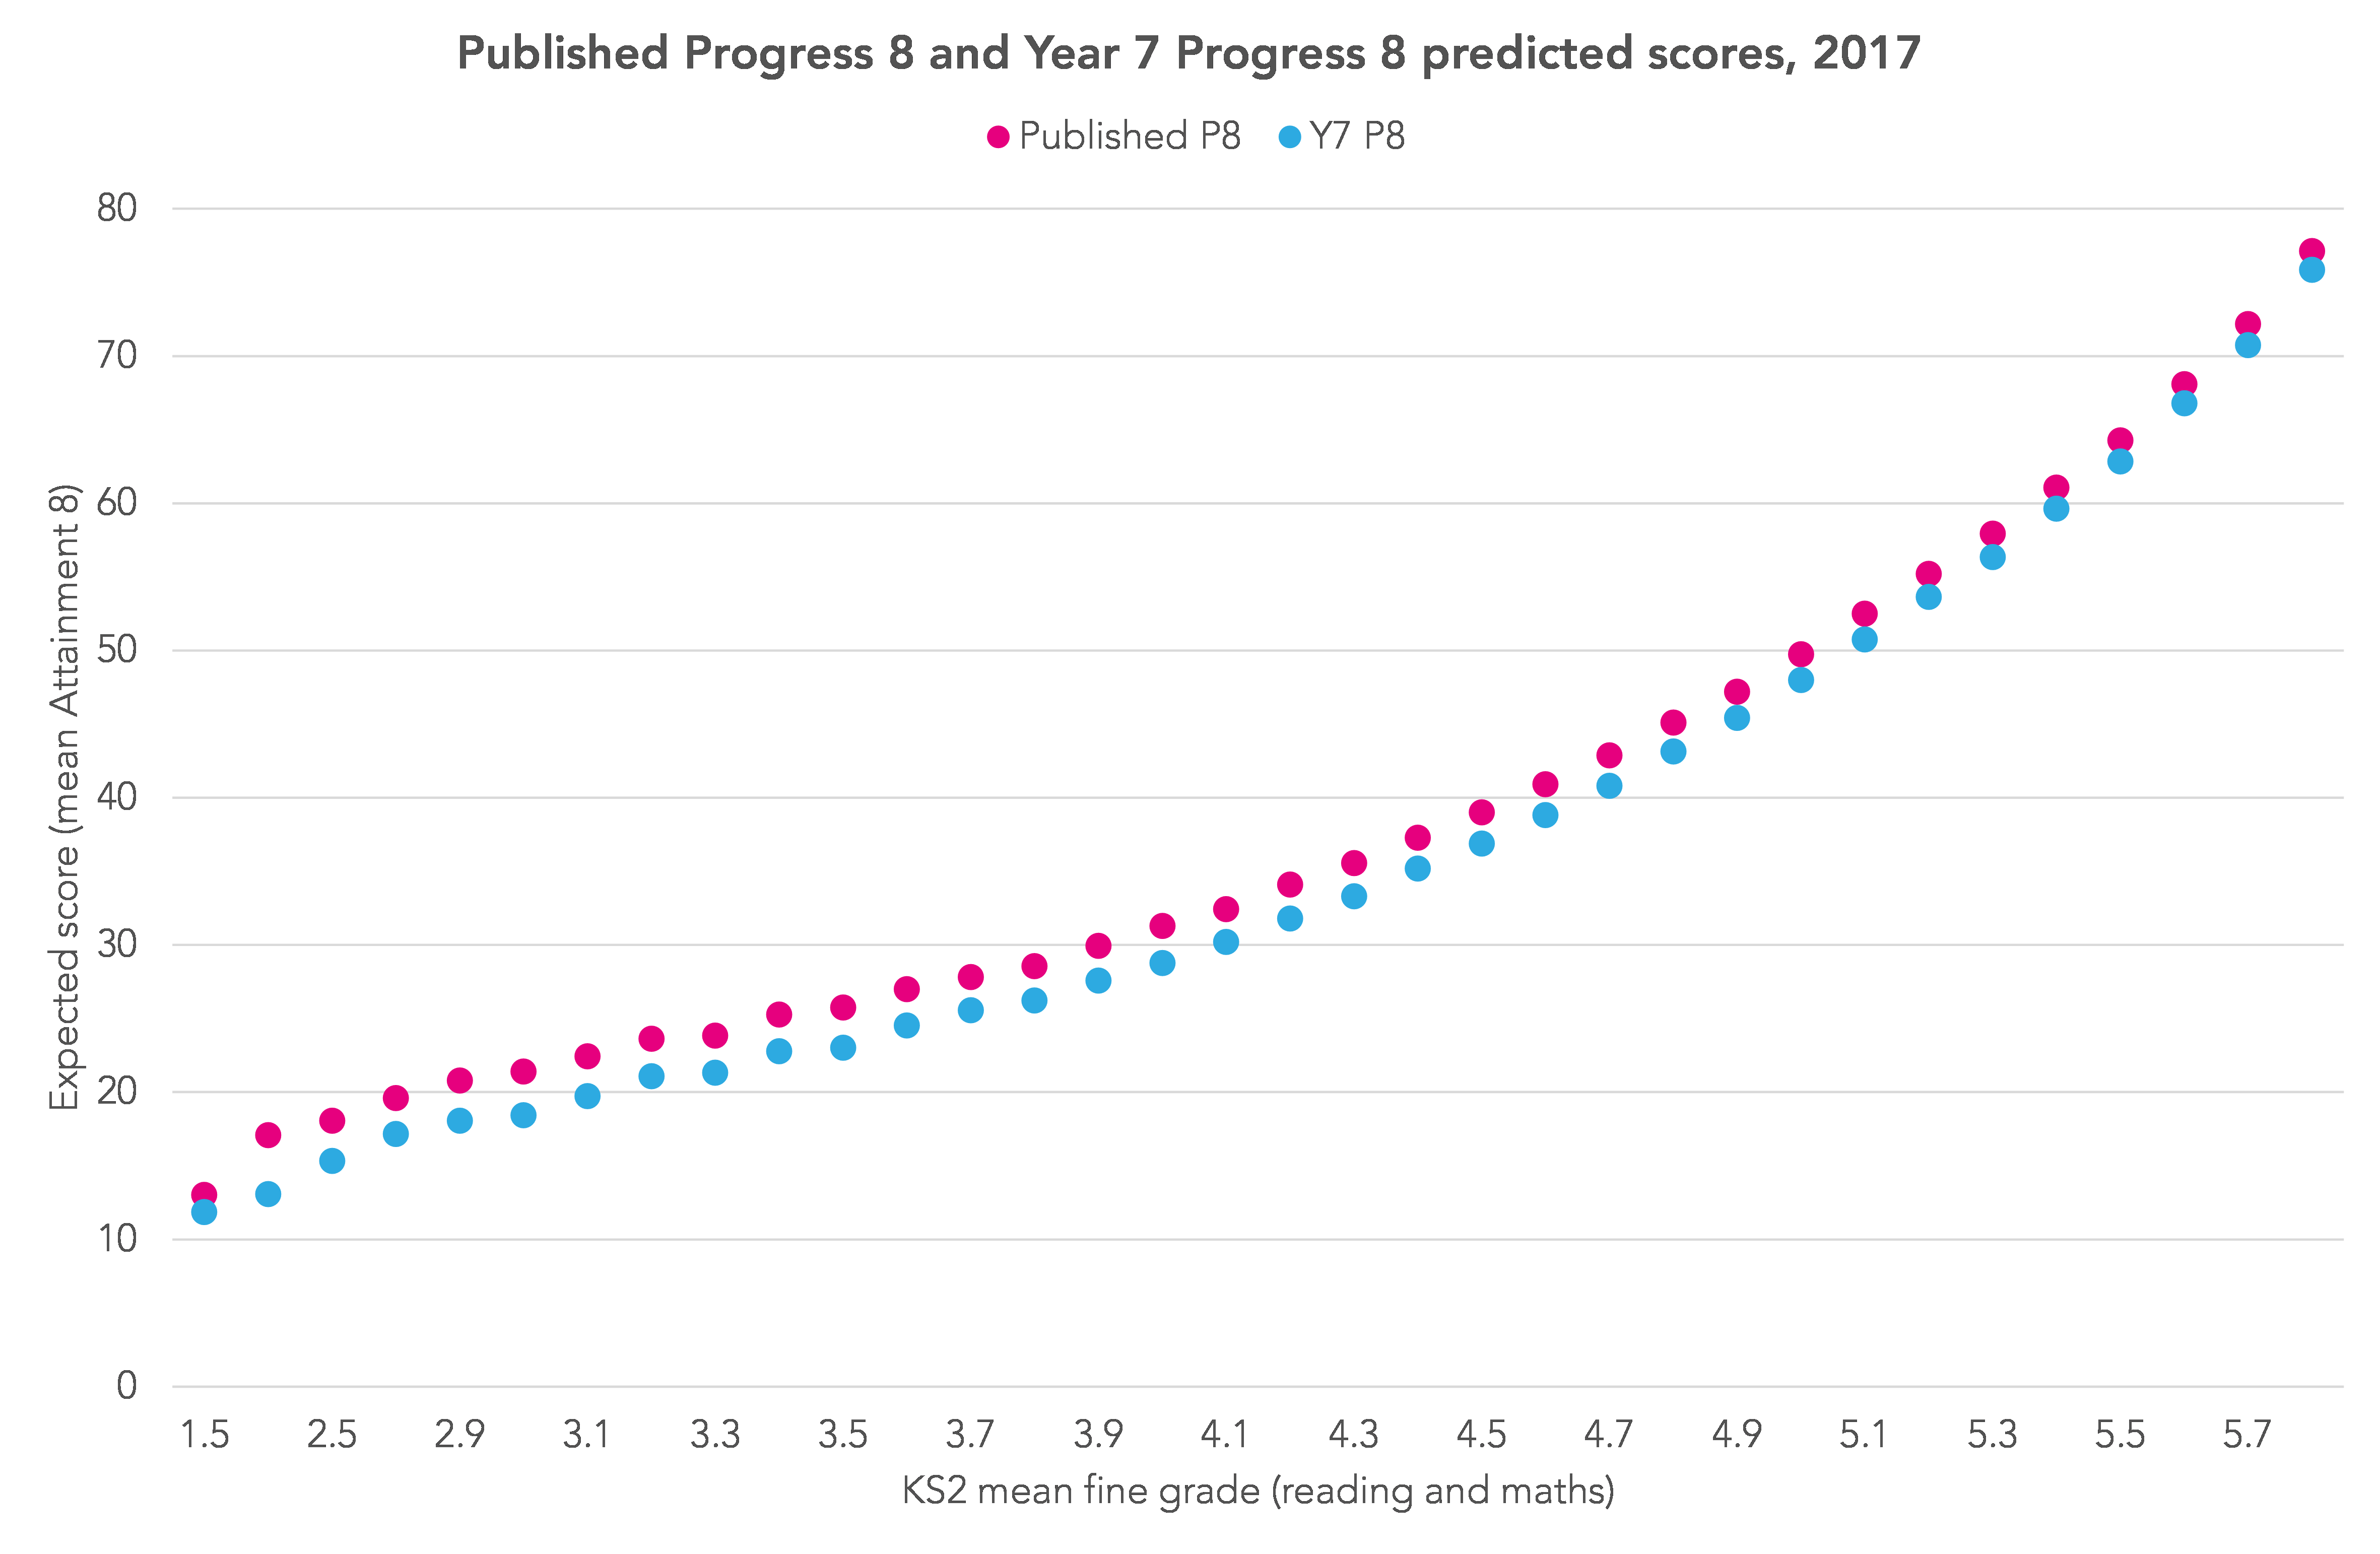
The recalculated predicted scores then give rise to the Year 7 P8 scores, shown against published P8 scores in the chart below.

The impact
The two measures are strongly correlated (r=0.94). This is unsurprising, given that over 80% of records used to calculate both measures are the same pupils at the same schools. But there are some large changes for individual schools. These occur where there is a lot of movement off, or onto, the school roll.
A couple of such schools have been marked with blue dots on the chart above.
The one on the right of the chart is a school which retained just a third of the pupils on roll in Year 7 in January 2013 all the way through to the end of Key Stage 4. It’s P8 score fell from over 0.5 to below -0.5.
The left blue dot had a higher P8 score when based on pupils on roll in Year 7, moving from well below the floor standard (-0.5) to just below the coasting standard (-0.25). Over a quarter of the pupils counted in the published P8 measure were recruited between Year 7 and Year 11. They achieved a published P8 score of -1.7.
In other words, doing the right thing and taking on pupils in need of a school place has severely damaged the school’s P8 measure.
Should this measure replace the current Progress 8?
We aren’t proposing this measure instead of the published Progress 8 measure but it, or a similar measure, could be produced to sit alongside it.
Its main weakness is that schools end up being accountable for pupils for whom they are not responsible. While this might be acceptable in the case of exclusions and managed moves, it might be less acceptable in the case of pupils who move for reasons beyond a school’s control, including those who leave the country altogether.
We have previously suggested reweighting performance measures based on the length of time pupils are on roll at secondary schools. This would perhaps alleviate some of the problems but still offers some (albeit reduced) incentive to move pupils off roll.
None of these measures on its own is ideal, but together, alongside data on movements on and off the school roll, they would provide a more rounded view of the attainment of all pupils who had been on a school’s books.
Want to stay up-to-date with the latest research from Education Datalab? Sign up to our mailing list to get notifications about new blogposts, or to receive our half-termly newsletter.
1. In addition to the 483,000 pupils who were in Year 7 in January 2013, there were just over 4,000 other pupils included in the published 2017 Progress 8 measure. These include pupils who were assessed at Key Stage 2 prior to 2012, as well as pupils who were not attending a state-funded mainstream school in England in January 2013 but who moved into the sector at a later date.
2. Excluding studio schools and university technical colleges.
3. In receipt of free school meals for at least 80% of their school career.


Leave A Comment