Update 31/08/18: We have made a substantial revision to this post following the comment from Mr D below, relating to additional categories of pupils who could be removed from schools’ performance indicators in 2017.
Pupils vanishing off school rolls made front-page news in the Times on Tuesday (£). This is something we’ve written about extensively, both here and here.
The Times reported that the number of pupils leaving between Year 10 and the end of Year 11 had increased over the last three years – but what if we look at a longer period?
How many pupils leave between Year 10 and the end of Year 11?
The Times found that there were 540,000 pupils on-roll in state-funded schools (mainstream and special) in Year 10 in January 2016, but only 527,000 were counted in school performance tables (league tables, as they are colloquially known) in 2017, a shortfall of 13,000.
However, National Pupil Database (NPD) data shows that of the 540,000 pupils, 17,000 did not have a corresponding record in the 2017 school performance tables data at a state-funded mainstream or special school. The difference of 4,000 versus the Times’s figure is due to pupils who were not on roll in Year 10 moving into state-funded schools.
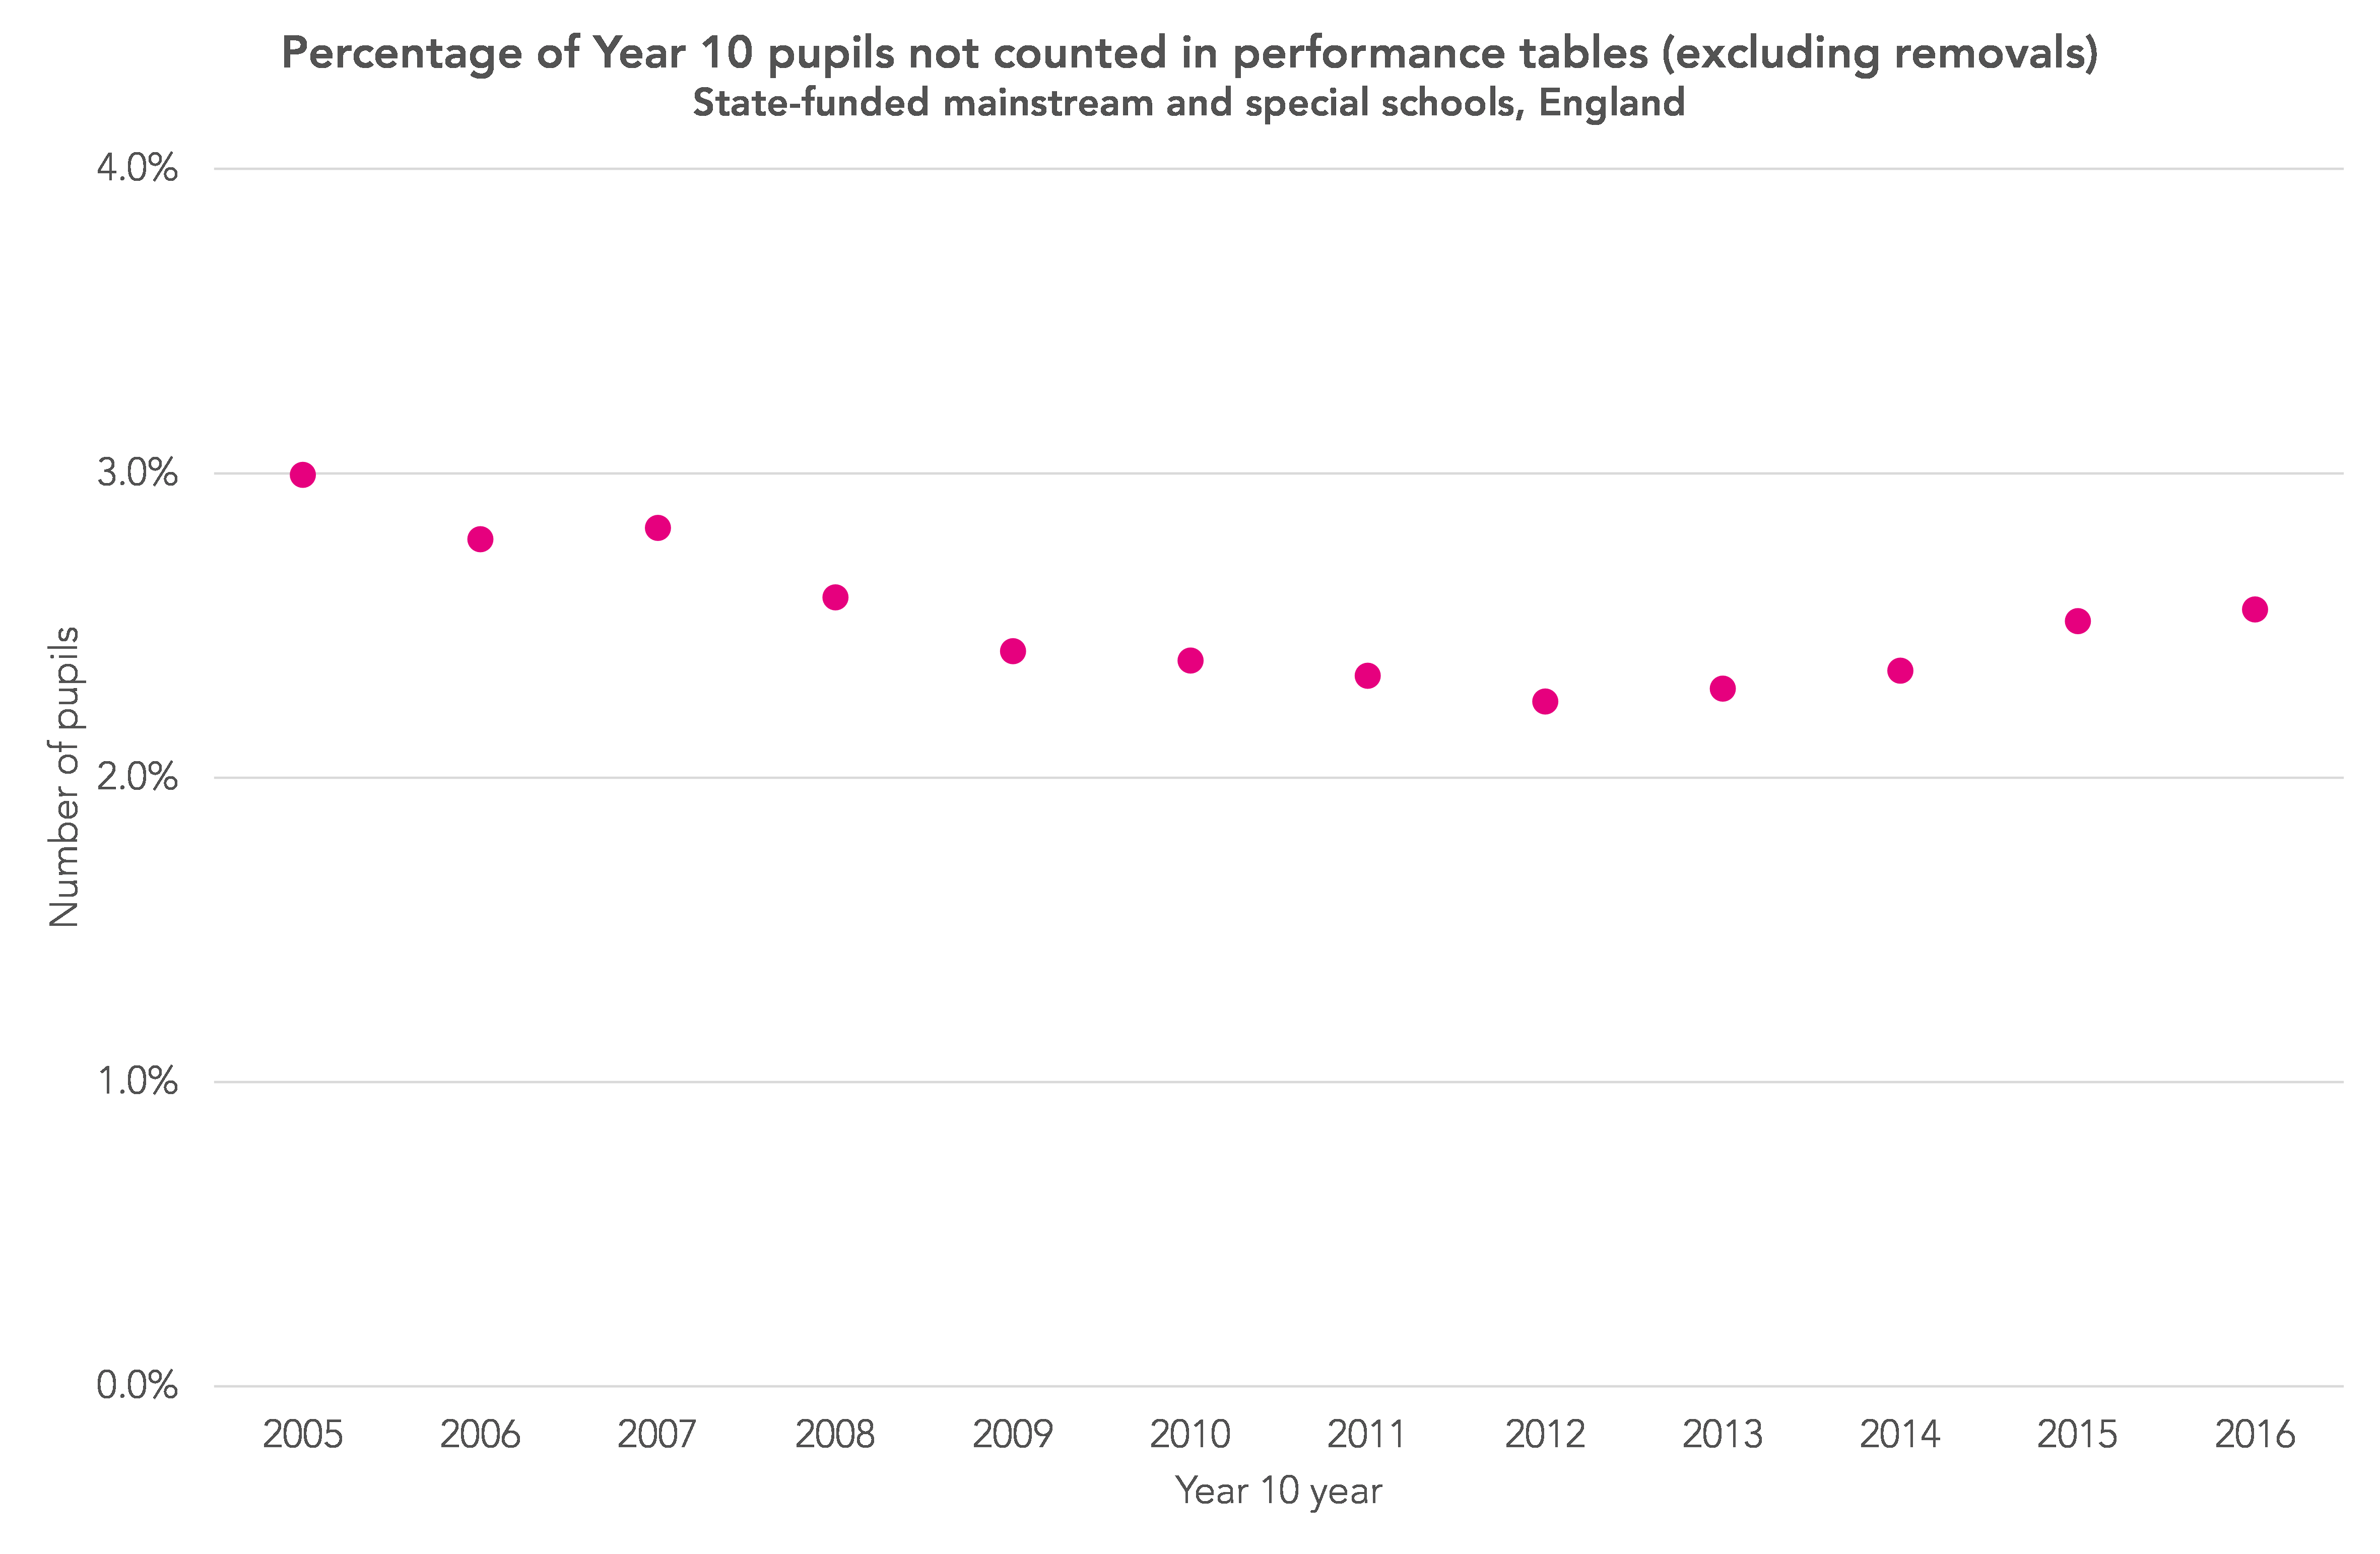
Sticking with our own calculations, the chart below shows the number of Year 10 pupils not counted in performance tables data a year later. For example, those shown as being in Year 10 in 2016 should have appeared in performance tables for 2017.

This seems to suggest that things were worse in the past (specifically, in 2006).
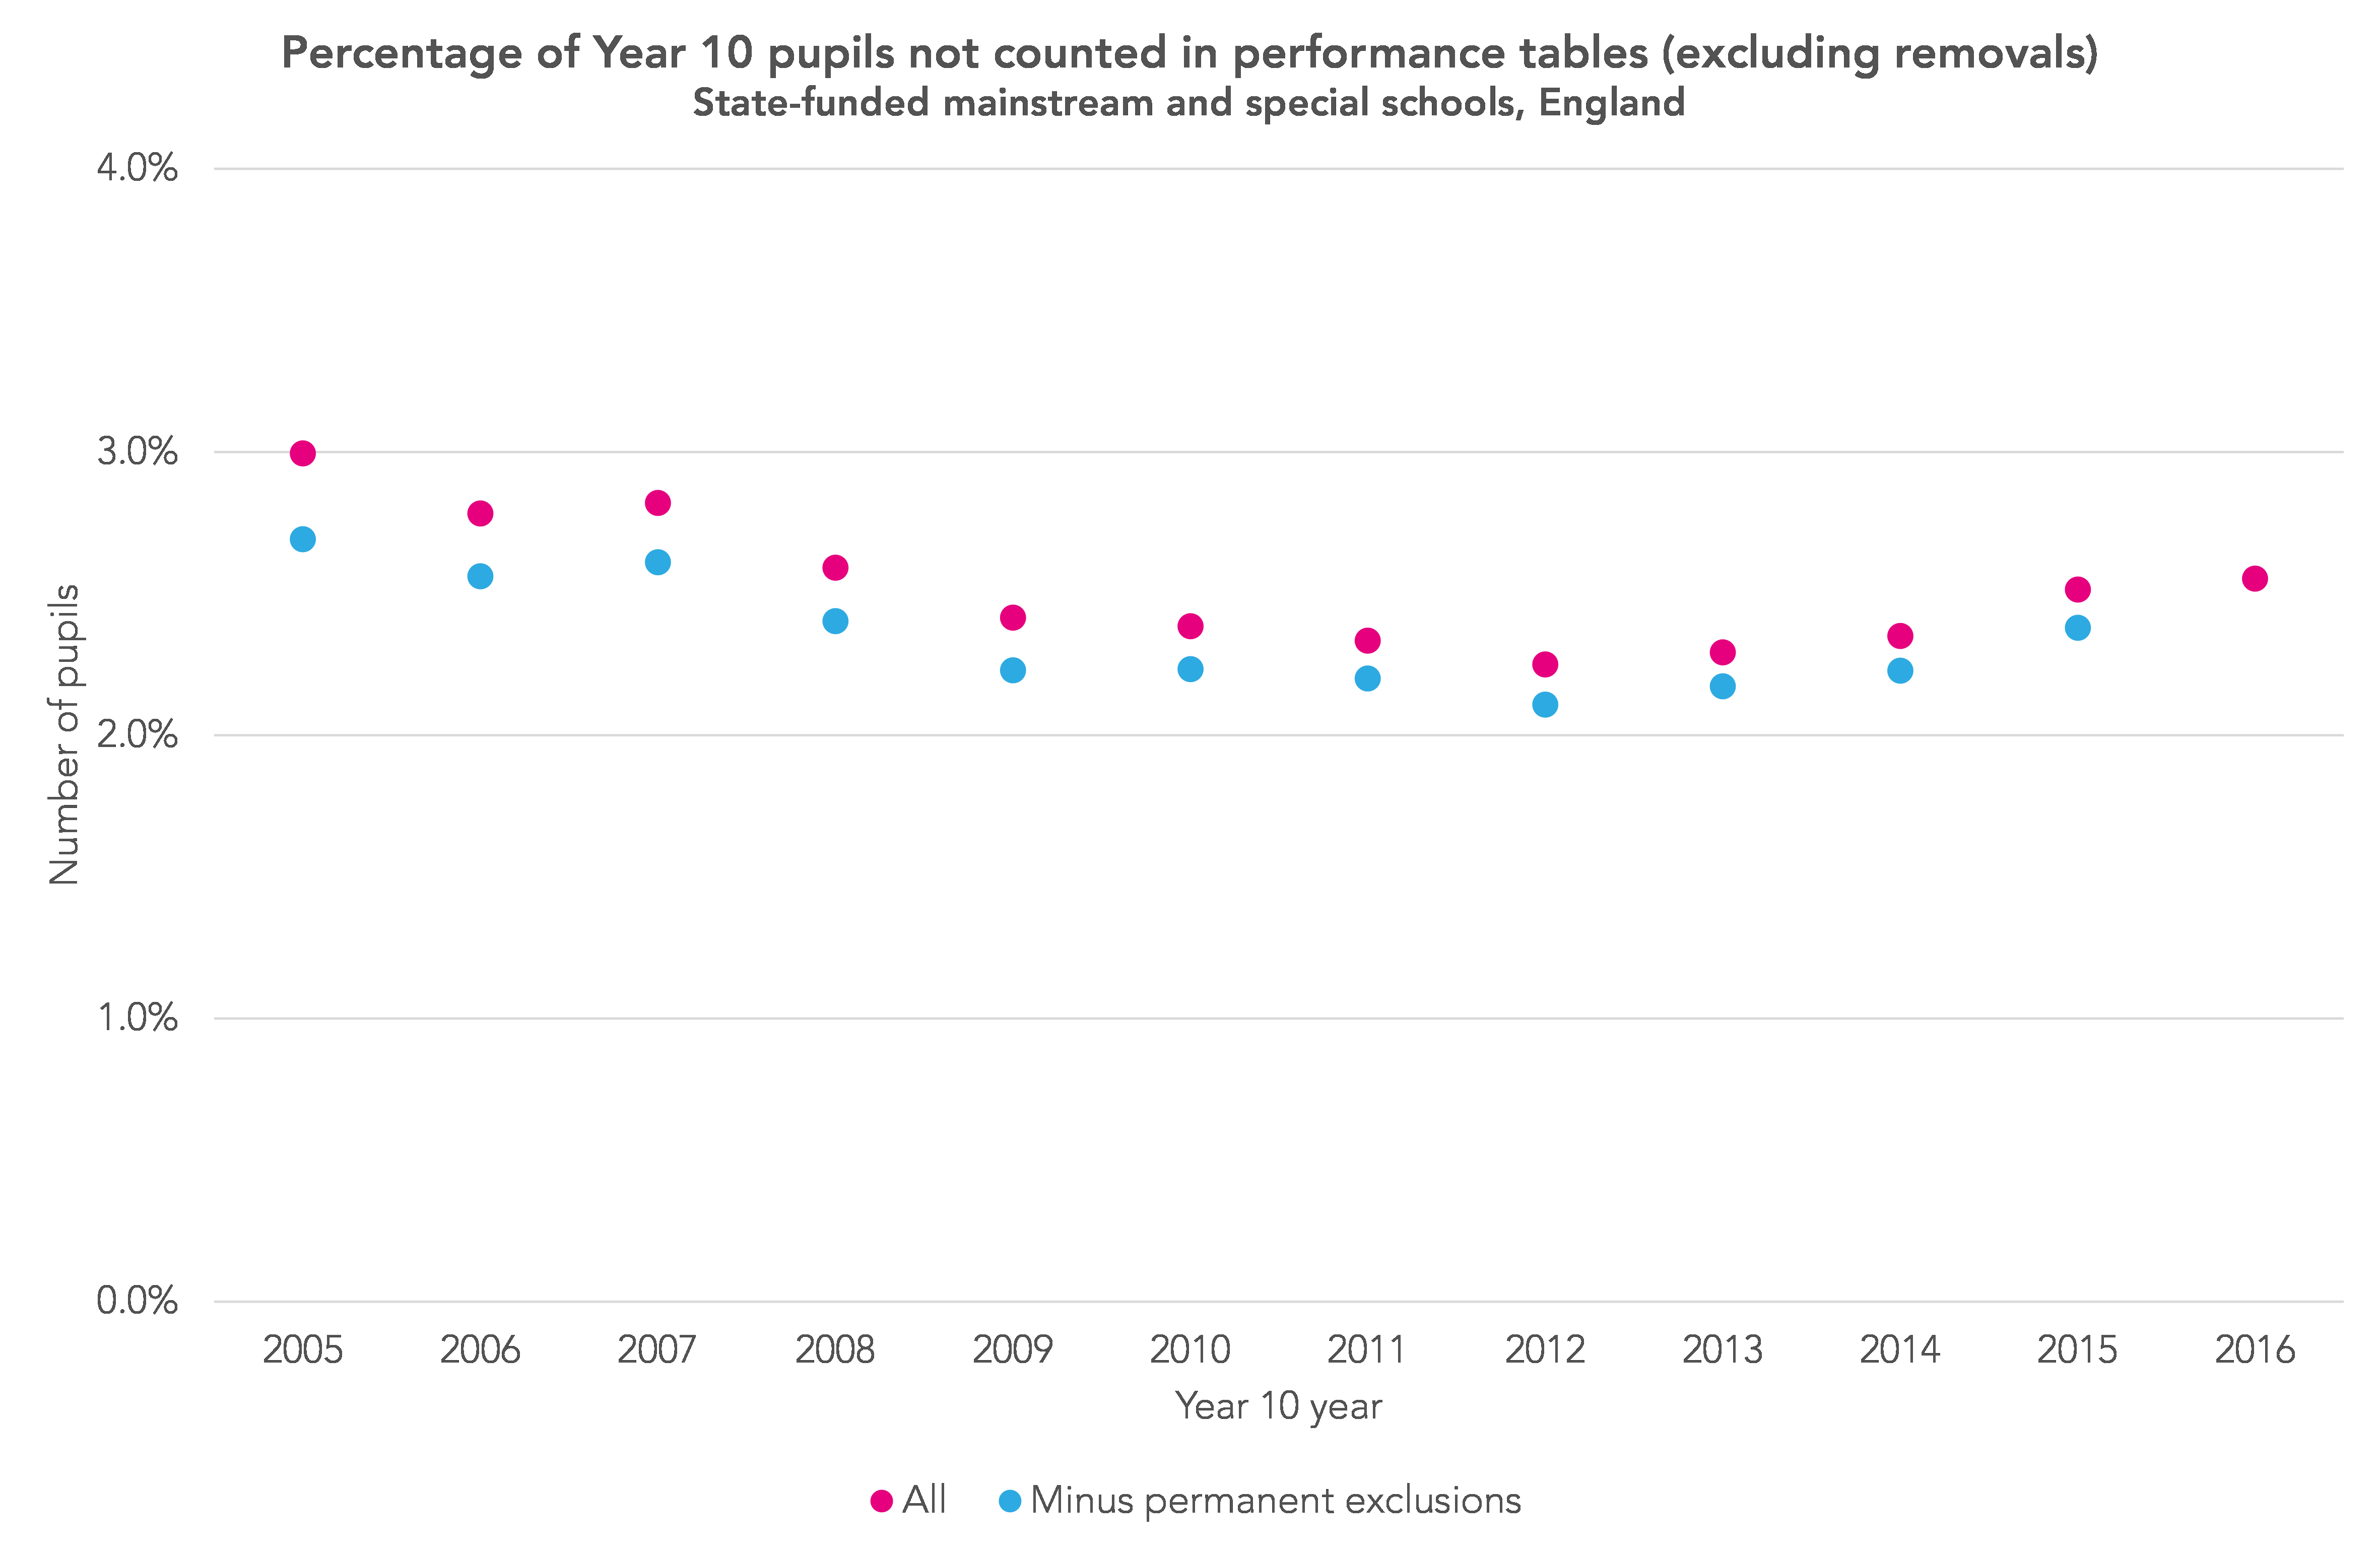
Update 31/08/2018: However, as Mr D mentions in the comments below, schools could request that pupils on roll could be removed from school performance data in 2017 (so, those in Year 10 in 2016 – the final year in the chart above) for a variety of additional reasons that were not previously available. These include school refusal, and physical and mental health issues. Schools have for a number of years been able to request the removal of pupils admitted following permanent exclusion from another school, and recent arrivals from overseas whose first language is not English.
Just over 5,000 pupils were removed from school performance measures in 2017 for reasons other than permanent exclusion and recent arrival from overseas, even though they remained on the school roll. This compares to less than 1,000 in 2016. If we remove these pupils from the chart (for all years), the data for the 2016 Year 10 cohort looks less stark in comparison to the 2014 and 2015 cohorts.

However, looking purely at pupil numbers since 2005 ignores the fact that the 2017 cohort (540,000) was much smaller than the 2006 cohort (606,000).
If we instead chart the number of Year 10 pupils not counted in performance tables as a percentage of the cohort, the situation in 2017 still appears worse than 2013, but better than 2006.
(With all of this, it is worth remembering that pupils don’t just leave during Year 10 and Year 11, as we show here).
Why did moves fall between 2006 and 2013?
The chart above shows that moves fell consistently between 2006 and 2013, since when they have begun to increase. Why might this be the case?
The first factor is permanent exclusion.
As the Department for Education data on exclusions [PDF] shows, the rate of permanent exclusions from secondary schools fell between 2007 and 2013, since when it has begun to increase.
Again using NPD data, if we take out Year 10 pupils who were subsequently excluded from the previous chart, we see firstly that permanent exclusion only accounts for a small proportion of all moves off-roll after Year 10, with the general trend remaining the same. (Unfortunately we do not have the full year’s exclusions data for 2017 to hand).
Our second thought is about the effect of changing rates of emigration. The problem here is that we do not know from the data available which pupils have emigrated.
This is compounded by the fact that getting a handle on emigration from official statistics is also tricky, given that estimates are published for under 15s for the UK as a whole and their accuracy has been called into question.
But, taken at face value, the estimates suggest that emigration fell up to 2013, then increased in 2014, since when it has fallen again.

Source: Office for National Statistics
Finally, there is the question of the extent to which the changing accountability pressures on schools are a contributory factor.
We can’t answer this, but it is worth summarising the changes during the period covered by the first two charts above.
They begin in the era of contextual value added (CVA) and alternative (Section 96) qualifications. CVA was abolished in 2011 by the Coalition government, but alternative qualifications grew in popularity until 2012 and continued to be included in performance tables until 2013, after which the reforms recommended by the Wolf report [PDF] were implemented. Progress 8 was then introduced as the headline accountability measure for secondary schools in 2016.
So, all-in-all, it does appear that proportionally more pupils are now being lost from state-funded schools after January of Year 10; this proportion having fallen between 2006 and 2013. But we cannot be certain how much emigration is playing a part in this.
Want to stay up-to-date with the latest research from FFT Education Datalab? Sign up to Datalab’s mailing list to get notifications about new blogposts, or to receive the team’s half-termly newsletter.


Dave, I have read much of your work and this, along with some of the “dodgy ks2″data is fascinating. I think the more delving done into these topics the better as I believe illegal off rolling is making a mockery of progress 8 data on a school level. Two schools could be performing equally as well however if one has lost 6 of their worst progress 8 students they suddenly look like a more successful institution.
Hi Dave, do the figures take into account those students the DfE removes from the performance cohort for each school based on school requests? i.e. they were on the January census, but not in performance cohort. For example, last year (2017), schools could request that students with extremely poor attendance not be counted in their performance cohort if they could show enough evidence that the school had done everything in its power to engage the student. Likewise, schools can request the removal of students whose physical or mental health has had a significantly detrimental effect on their ability to take exams. In these cases there is no off-rolling, the school supports them the whole way.
It would be interesting to know the number, nationally, of students who complete Y11 but are not shown in performance cohorts after removal requests and a breakdown of the reasons (and possibly the number of rejections from the DfE for spurious requests).
Many, many this comment. I had neglected to factor in this additional category of removals in the original post so have made a substantial correction. Unfortunately, we do not know from the data we have the reasons why the 5 thousand pupils were removed. I suspect this could be done under FOI. Thanks again.
Dave
In Northern Ireland schools have to list the reasons why students are ineligible to be included in examination returns. The inspectorate have access to this for each school and the Dept of Ed (NI) provide it through FOI. I’m not sure why the Dept for Ed in England do not publish the no. of ineligible students in performance figures. In my experience the variation is stark and questions can be raised around school improvement issues if the stats look uncharacteristically high.
Hi Mark. Thanks for the comment. This sounds like a good idea.
Thanks for providing great informative and looking beautiful blog. Keep it up