This blogpost is part of the FFT Key Stage 4 Early Results Service. The service allows schools to upload their KS4 results and then access an early analysis of their results. Participating schools that have already uploaded their results can download their reports in FFT Aspire now. Schools can also continue to upload their results until 14 September.
A total of 1,548 schools have participated in the FFT KS4 Early Results Service so far, which we offered for the first time this year. Around half of state-funded mainstream schools are included.
So what does headline Key Stage 4 attainment for 2018 look like?
Participating schools sent us a file of 2018 Key Stage 4 data, consisting of pupils’ scores for:
- Attainment 8
- English language
- English literature
- maths
We used the data as it was supplied to us, though we did remove pupils with missing or unusual data. Over the next few months, schools will begin the process of checking data with DfE, which will include (among other things):
- ensuring that all results are present for all pupils;
- removing pupils from performance measures where they should not be included; and
- ensuring that the grades recorded for pupils are correct (this includes details of remarks).
This process will culminate in the publication of revised secondary school performance tables in January.
Can participating schools provide a reasonable approximation of national averages for 2018?
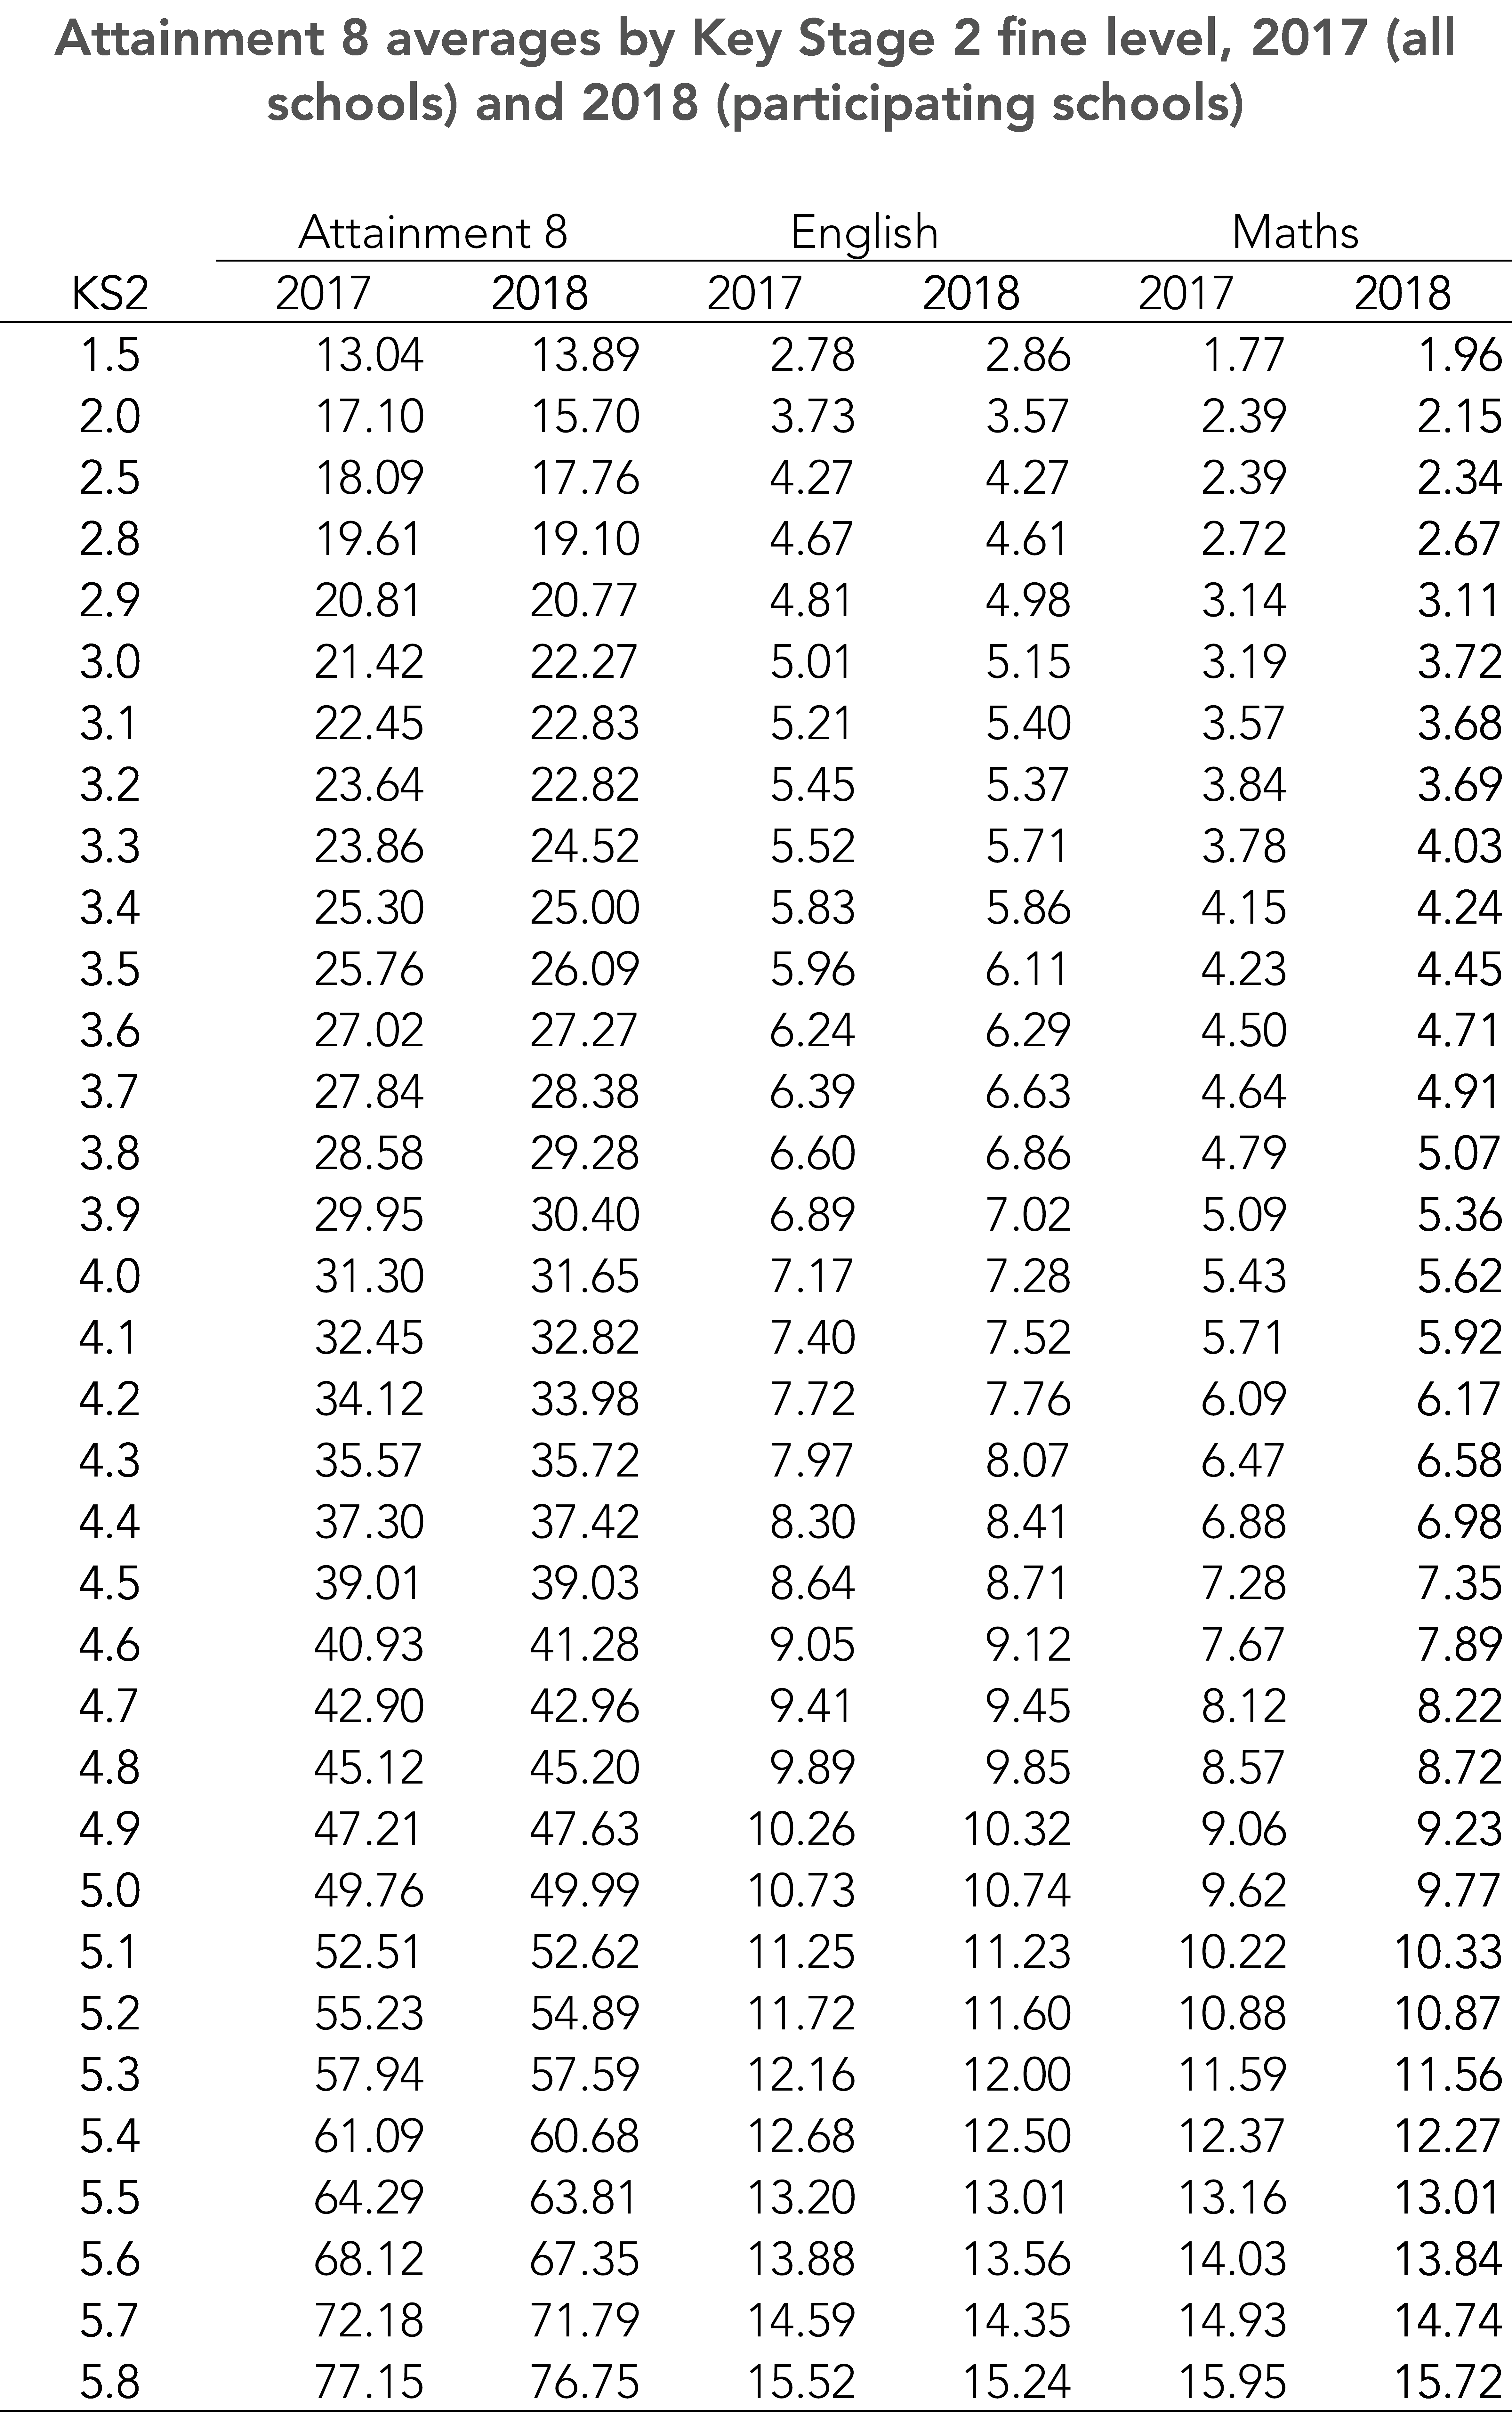
Looking backwards, state-funded mainstream schools participating in the Early Results Service had slightly higher Attainment 8, English and maths scores in 2017 than the average for all state-funded mainstream schools.

So, while there are, of course, no guarantees, the 2018 results for participating schools should provide a reasonable approximation of the provisional national average for all state-funded mainstream schools.
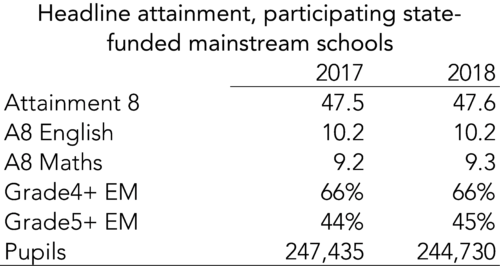
Attainment in 2018
On average, attainment in 2018 in participating schools was barely any different to 2017. We would expect the 2018 indicators to have increased a touch by January, as a results of remarks and other factors.
Progress 8
Although DfE will publish provisional Progress 8 scores early in October, schools are understandably keen to get a handle on their scores for 2018.
At the end of the post is a table showing how provisional Progress 8 benchmarks (overall, English and maths) have changed compared to last year for each prior attainment group. Averages for participating schools in 2017 were very close to published national averages, always within 0.6 points and within 0.2 points for KS2 fine levels of 3.9 and higher.
The differences can be seen in chart below. We’ve plotted the differences in average points per Attainment 8 entry (or “slot”). There are 10 slots overall, with two in each of English and maths.
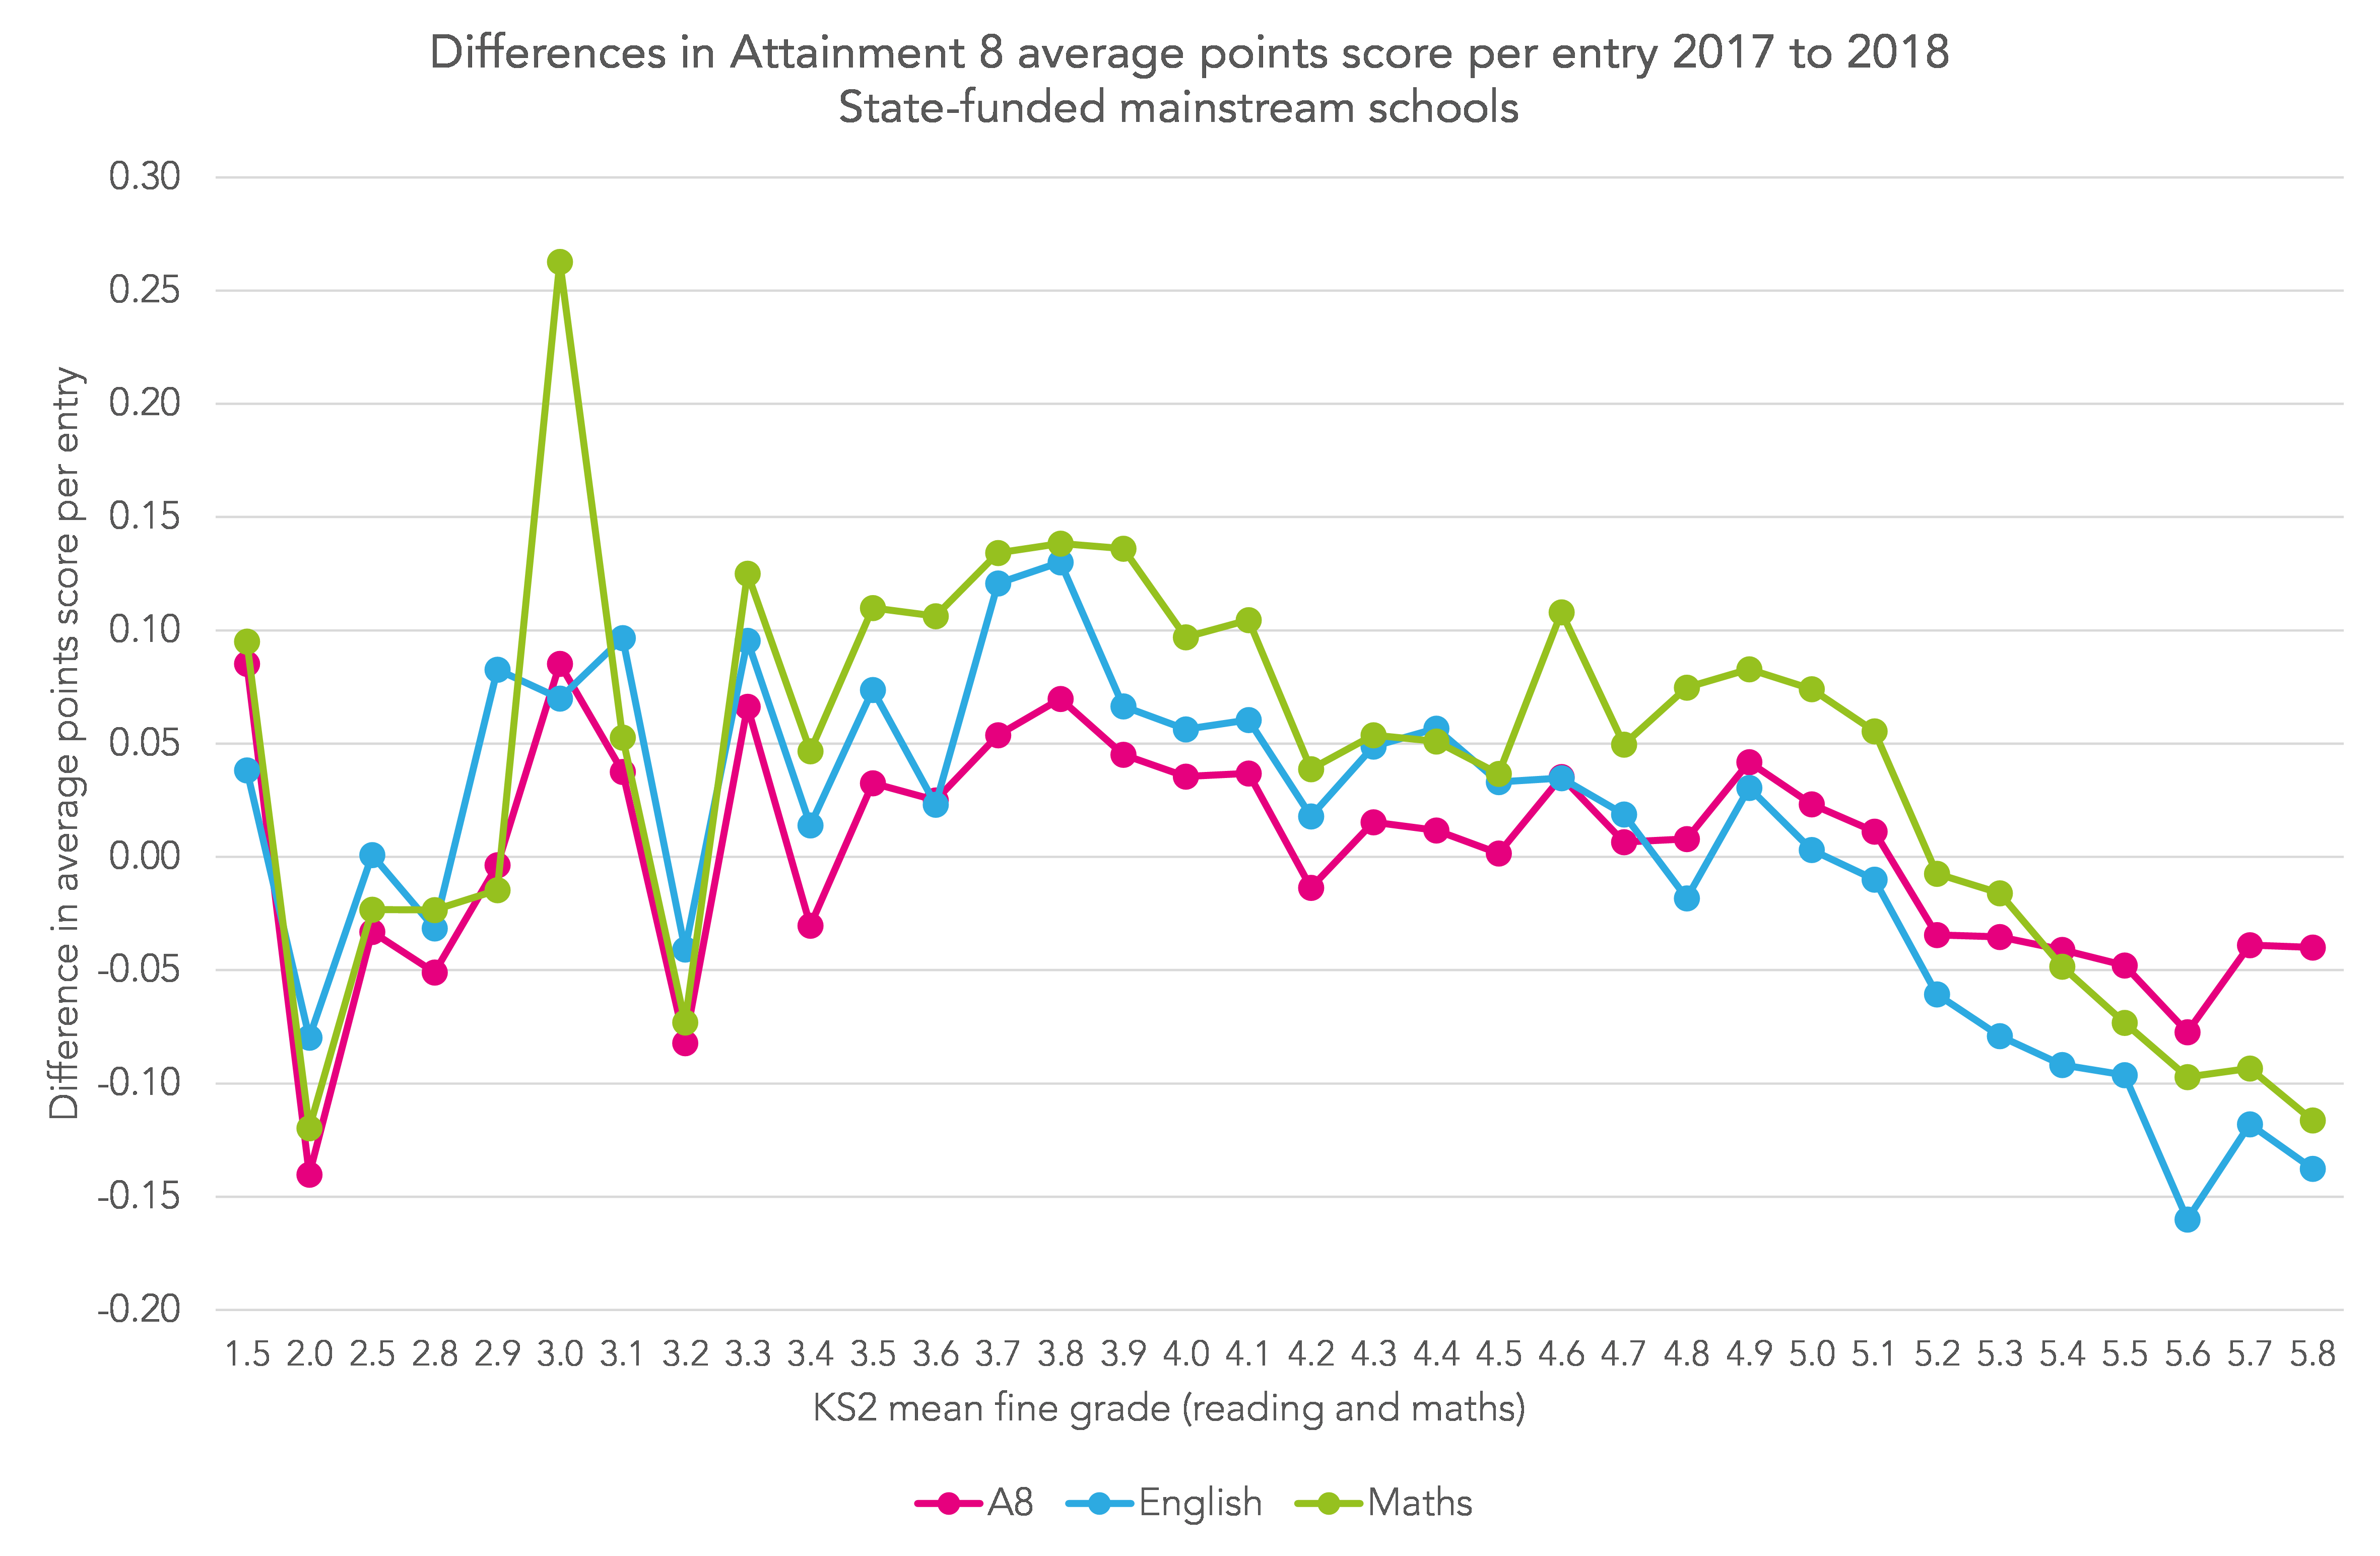
We would expect some changes in Attainment 8 average points per entry by prior attainment group even if the overall average remains largely unchanged.
This is because differences in qualifications taken disproportionately affect particular parts of the prior attainment distribution.
Firstly, ECDL – the European Computer Driving Licence – is no longer included. This tended to raise the Attainment 8 scores, and therefore Progress 8 scores, of schools which entered pupils en masse as we described here.
Secondly, more GCSEs were graded 9-1 in 2018. The legacy points scale for A*-G GCSEs awarded 4 points for a grade C, which rather undervalued them. The grade C range has been split across grades 4 and 5 in reformed GCSEs.
Finally, the prior attainment distribution has shifted very slightly to the right, meaning there are slightly more pupils with higher levels of prior attainment. For example, in participating schools, 22.6% of the 2018 cohort had achieved a KS2 fine level of 5.4 or higher compared to 21.2% in 2017.
In general terms, we see that scores have tended to rise slightly in the middle of the prior attainment distribution and tended to fall at the upper end, particularly in English. We’ll spend a bit more time looking into this over the next week or two.
Correlation with 2018
Progress 8 scores from 2018 are reasonably well correlated with those from 2017 among participating schools (r=0.77).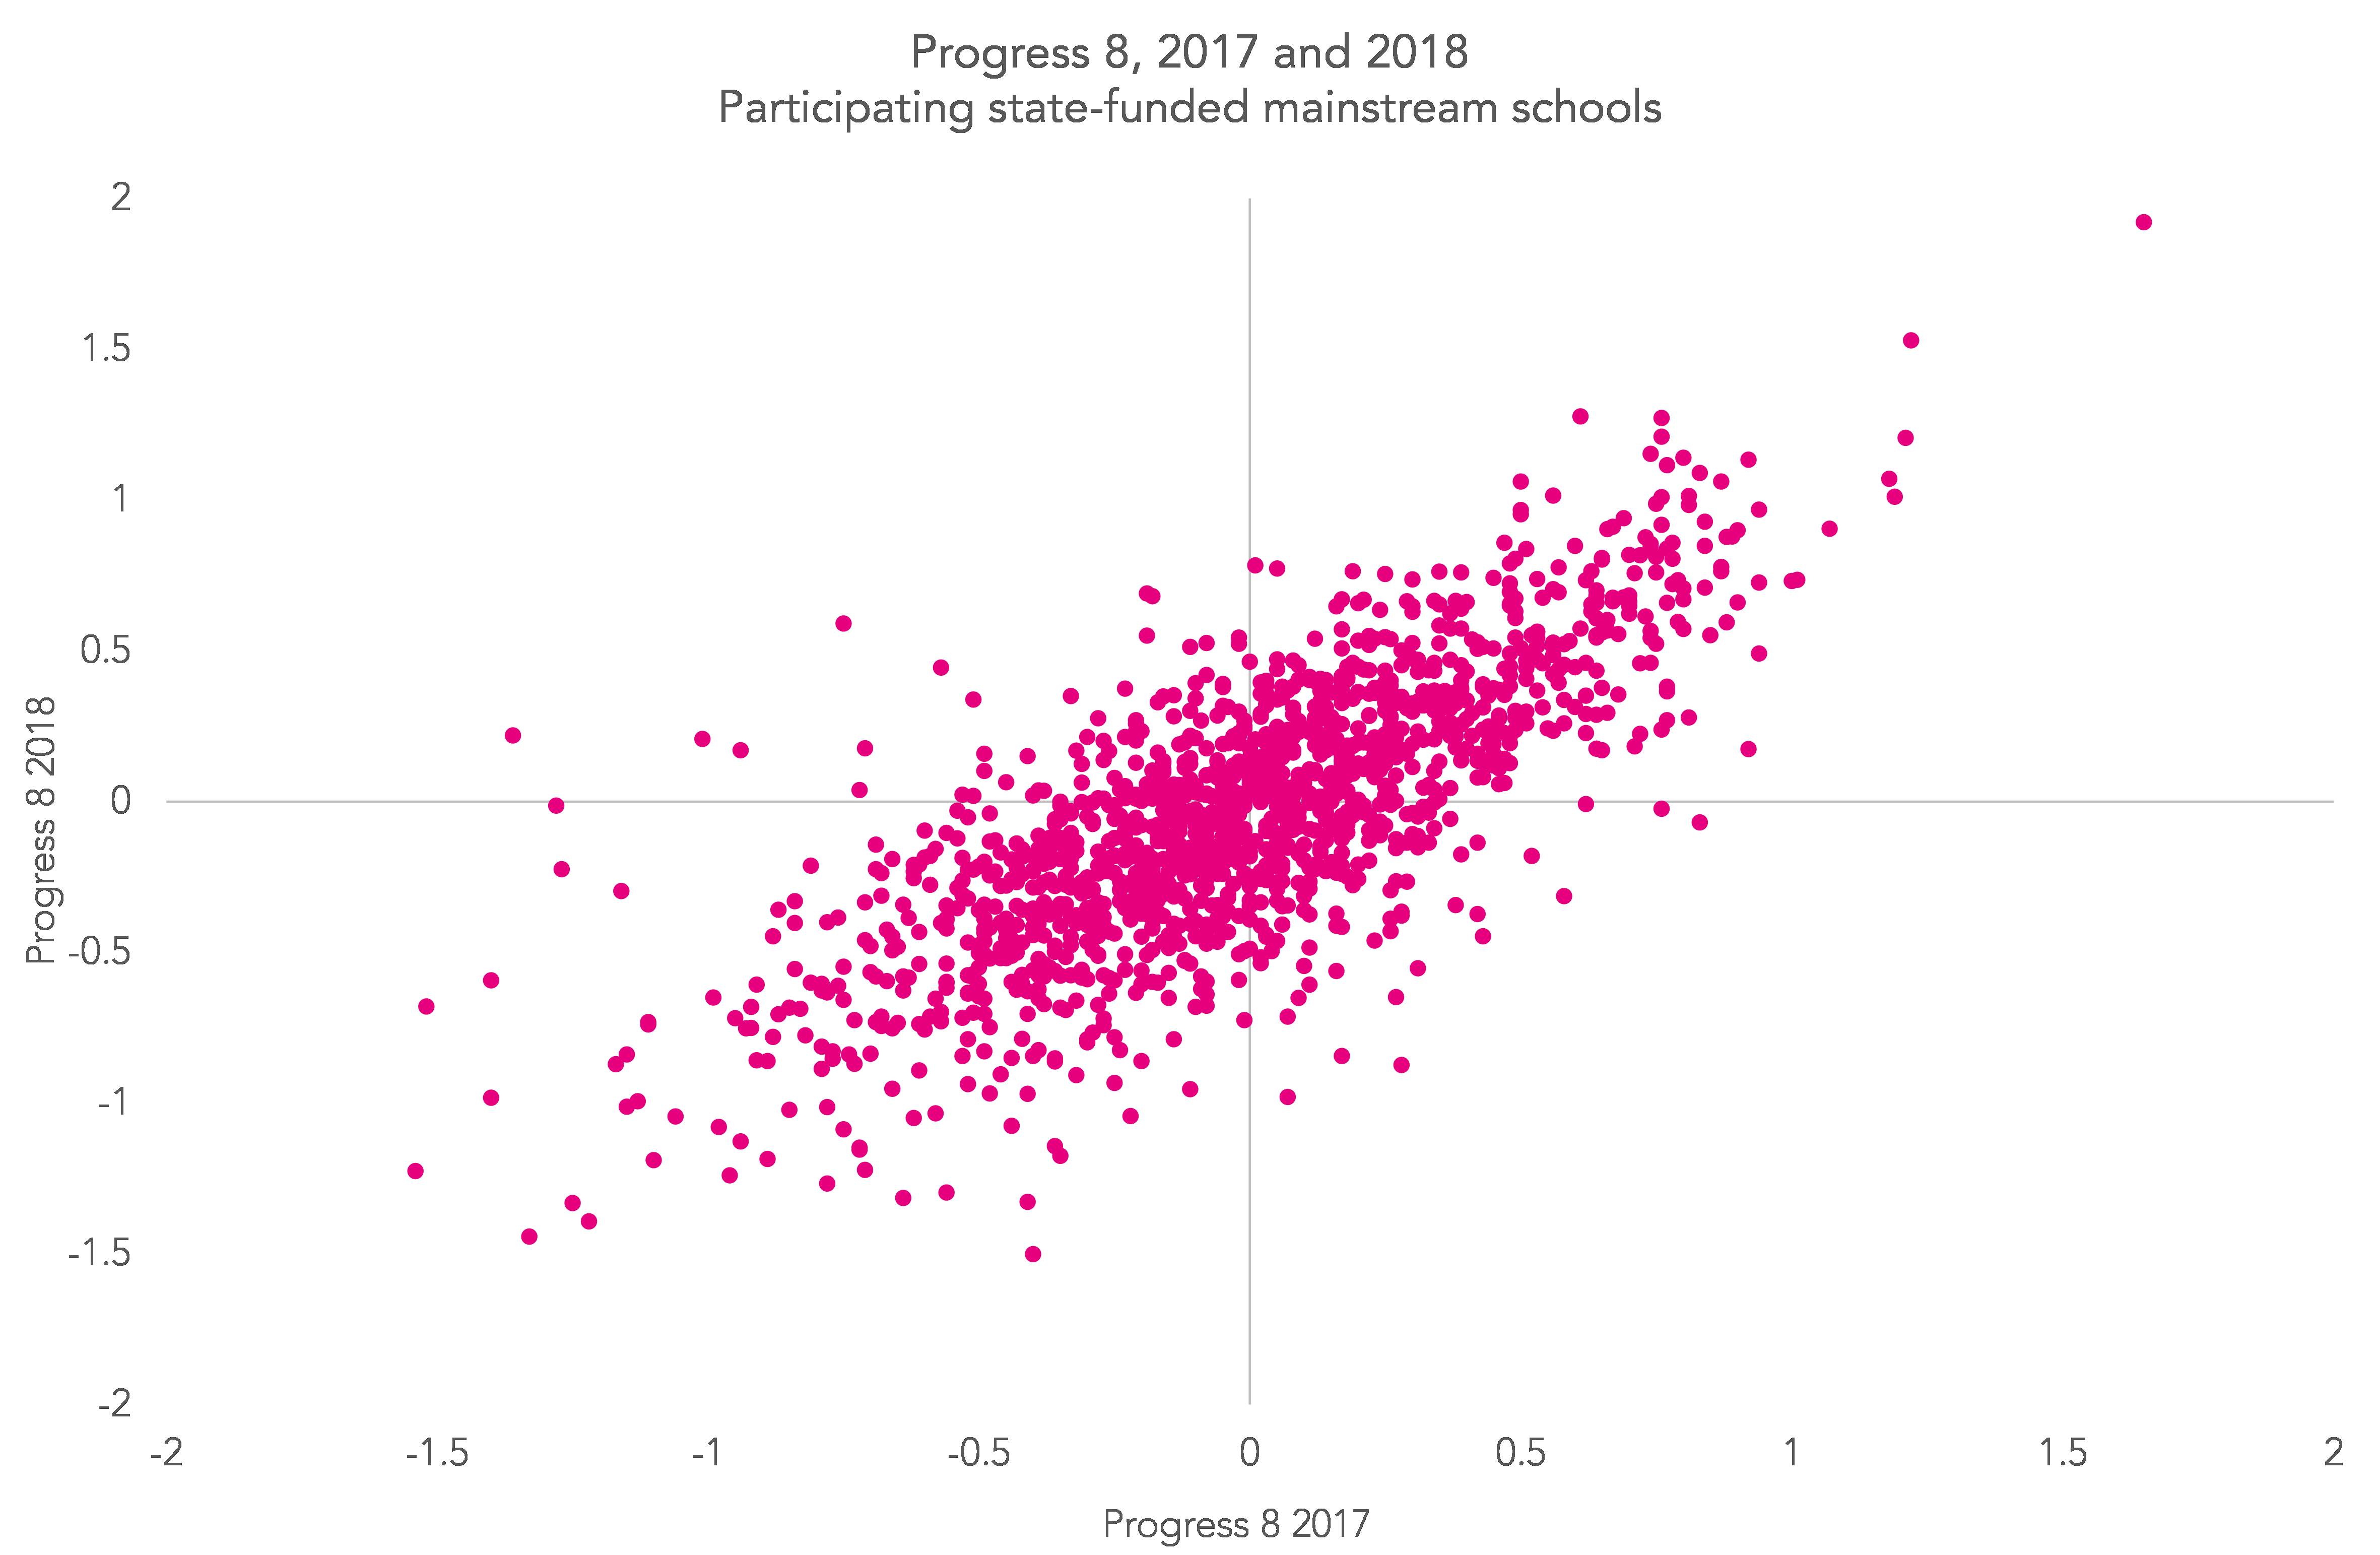
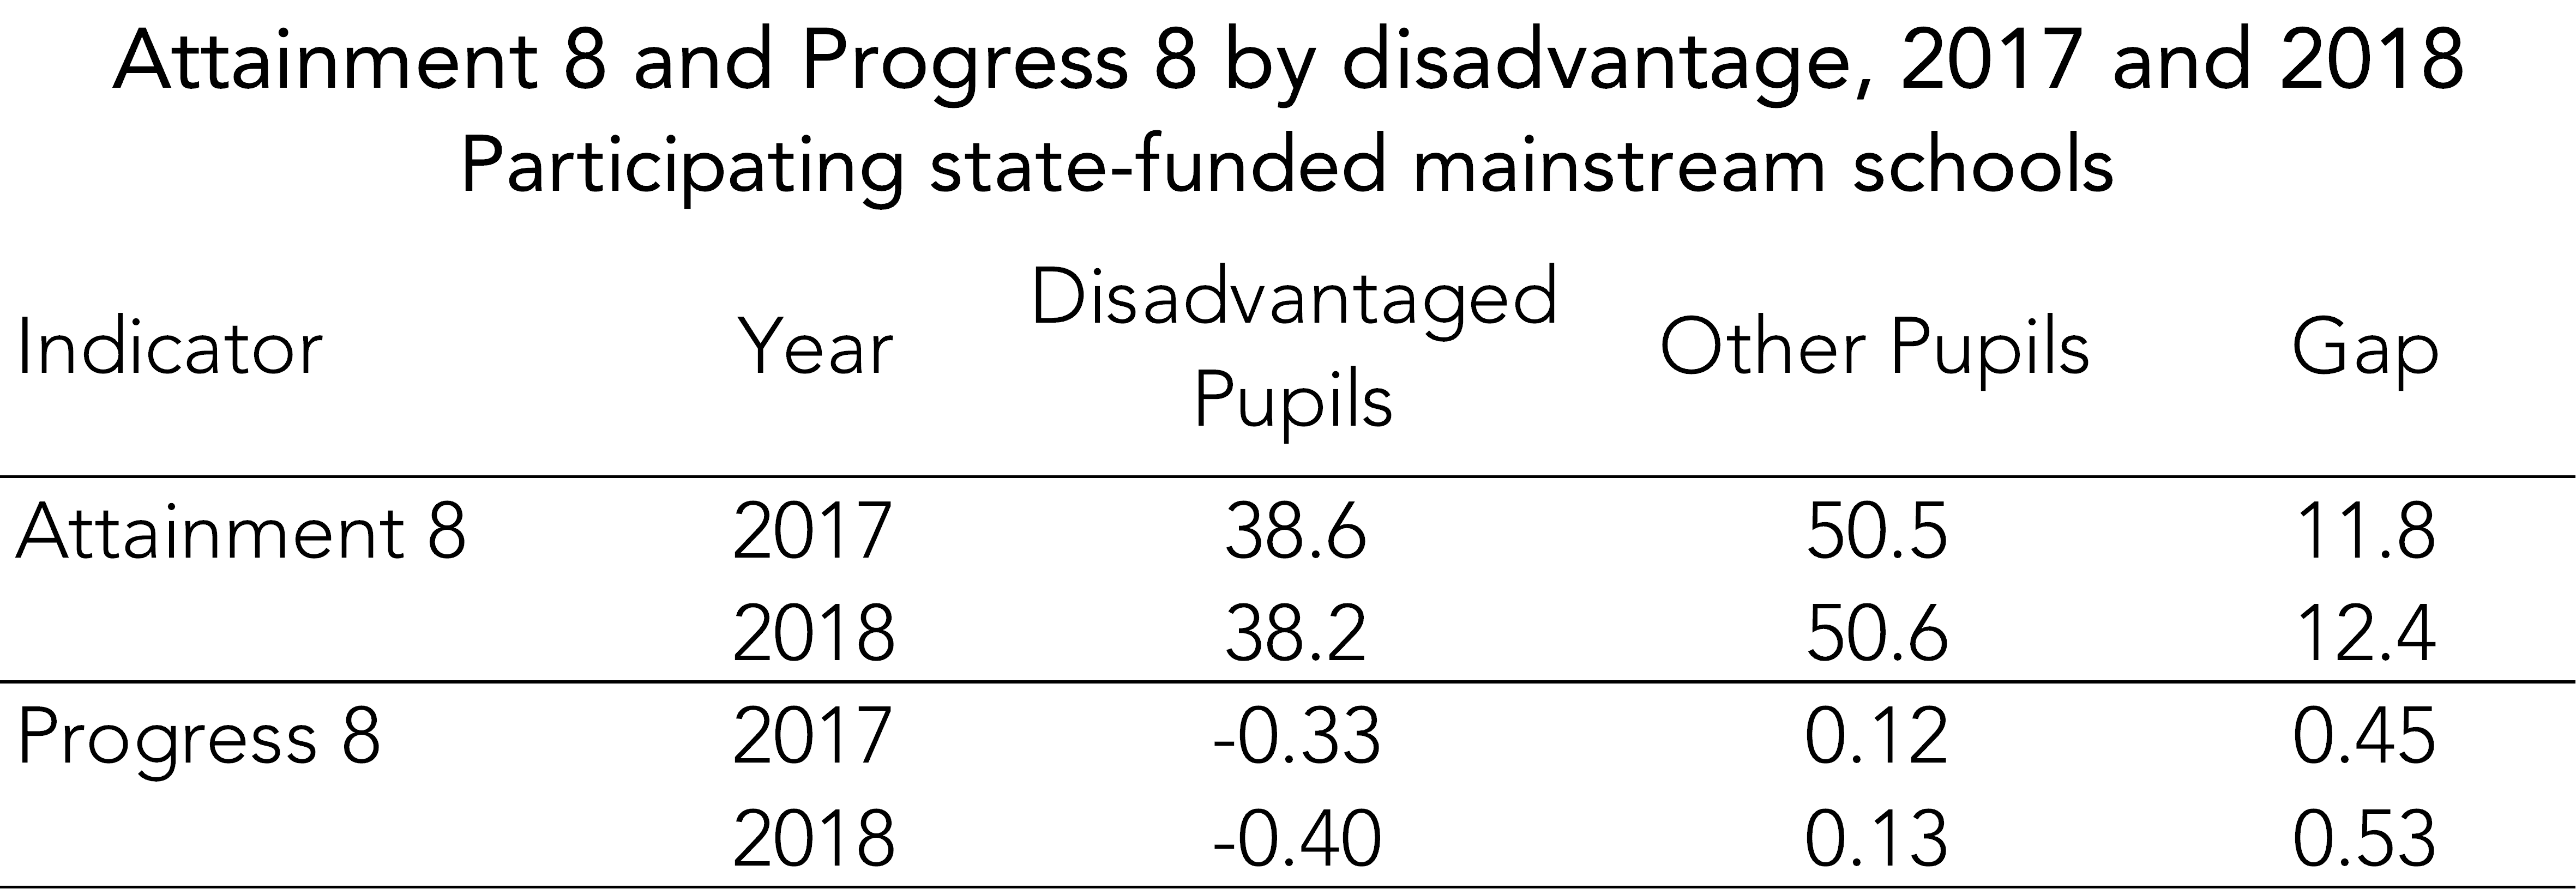
The disadvantage gap
Finally, a word on the “gap” between disadvantaged pupils and their peers. Among participating schools, it looks as if gaps have widened slightly for both Attainment 8 and Progress 8.
This blogpost is part of the FFT Key Stage 4 Early Results Service. The service allows schools to upload their KS4 results and then access an early analysis of their results. Participating schools that have already uploaded their results can download their reports in FFT Aspire now. Schools can also continue to upload their results until 14 September.
Want to stay up-to-date with the latest research from FFT Education Datalab? Sign up to our mailing list to get notifications about new blogposts, or to receive our half-termly newsletter.


Where can I find the data relating to my school?
Hi Kate. If you log in to Aspire, and go to the downloads menu in the top right-hand corner (↓), choosing ‘FFT special reports’ will take you to the page on which the report can be found if your school uploaded its KS4 data.
How many of the schools that provided results from selective schools? Is this a representative sample?
62- so grammars are slightly under-represented. As for whether it’s representative, it depends on what question is being asked. In this case we’re looking at whether we can approximate national averages for state-funded mainstream schools using the data from participating schools. Based on their attainment from 2017, it looks like a reasonable approximation.