A quick glance at official special educational needs statistics reveals that 14.6% of all pupils in England were classified as having special educational needs in 2018. This includes those with a statement of SEN or an education and health care plan (EHCP), and those receiving school-based support.
This figure has declined from 21.1% in 2010. The SEND reforms of 2014 have played a part, although the incidence rate was declining prior to their introduction.
But how many pupils are classified as having SEN at any point during their school career? The answer is more than you might think.
The chart below looks at a single cohort of pupils – those in Year 1 in the autumn term of the 2005/06 school year in state-funded schools.[1] (This group would have been in Year 9 when the SEND reforms were introduced in September 2014.)
The chart shows the proportion of this cohort classified as having SEN in each termly census.
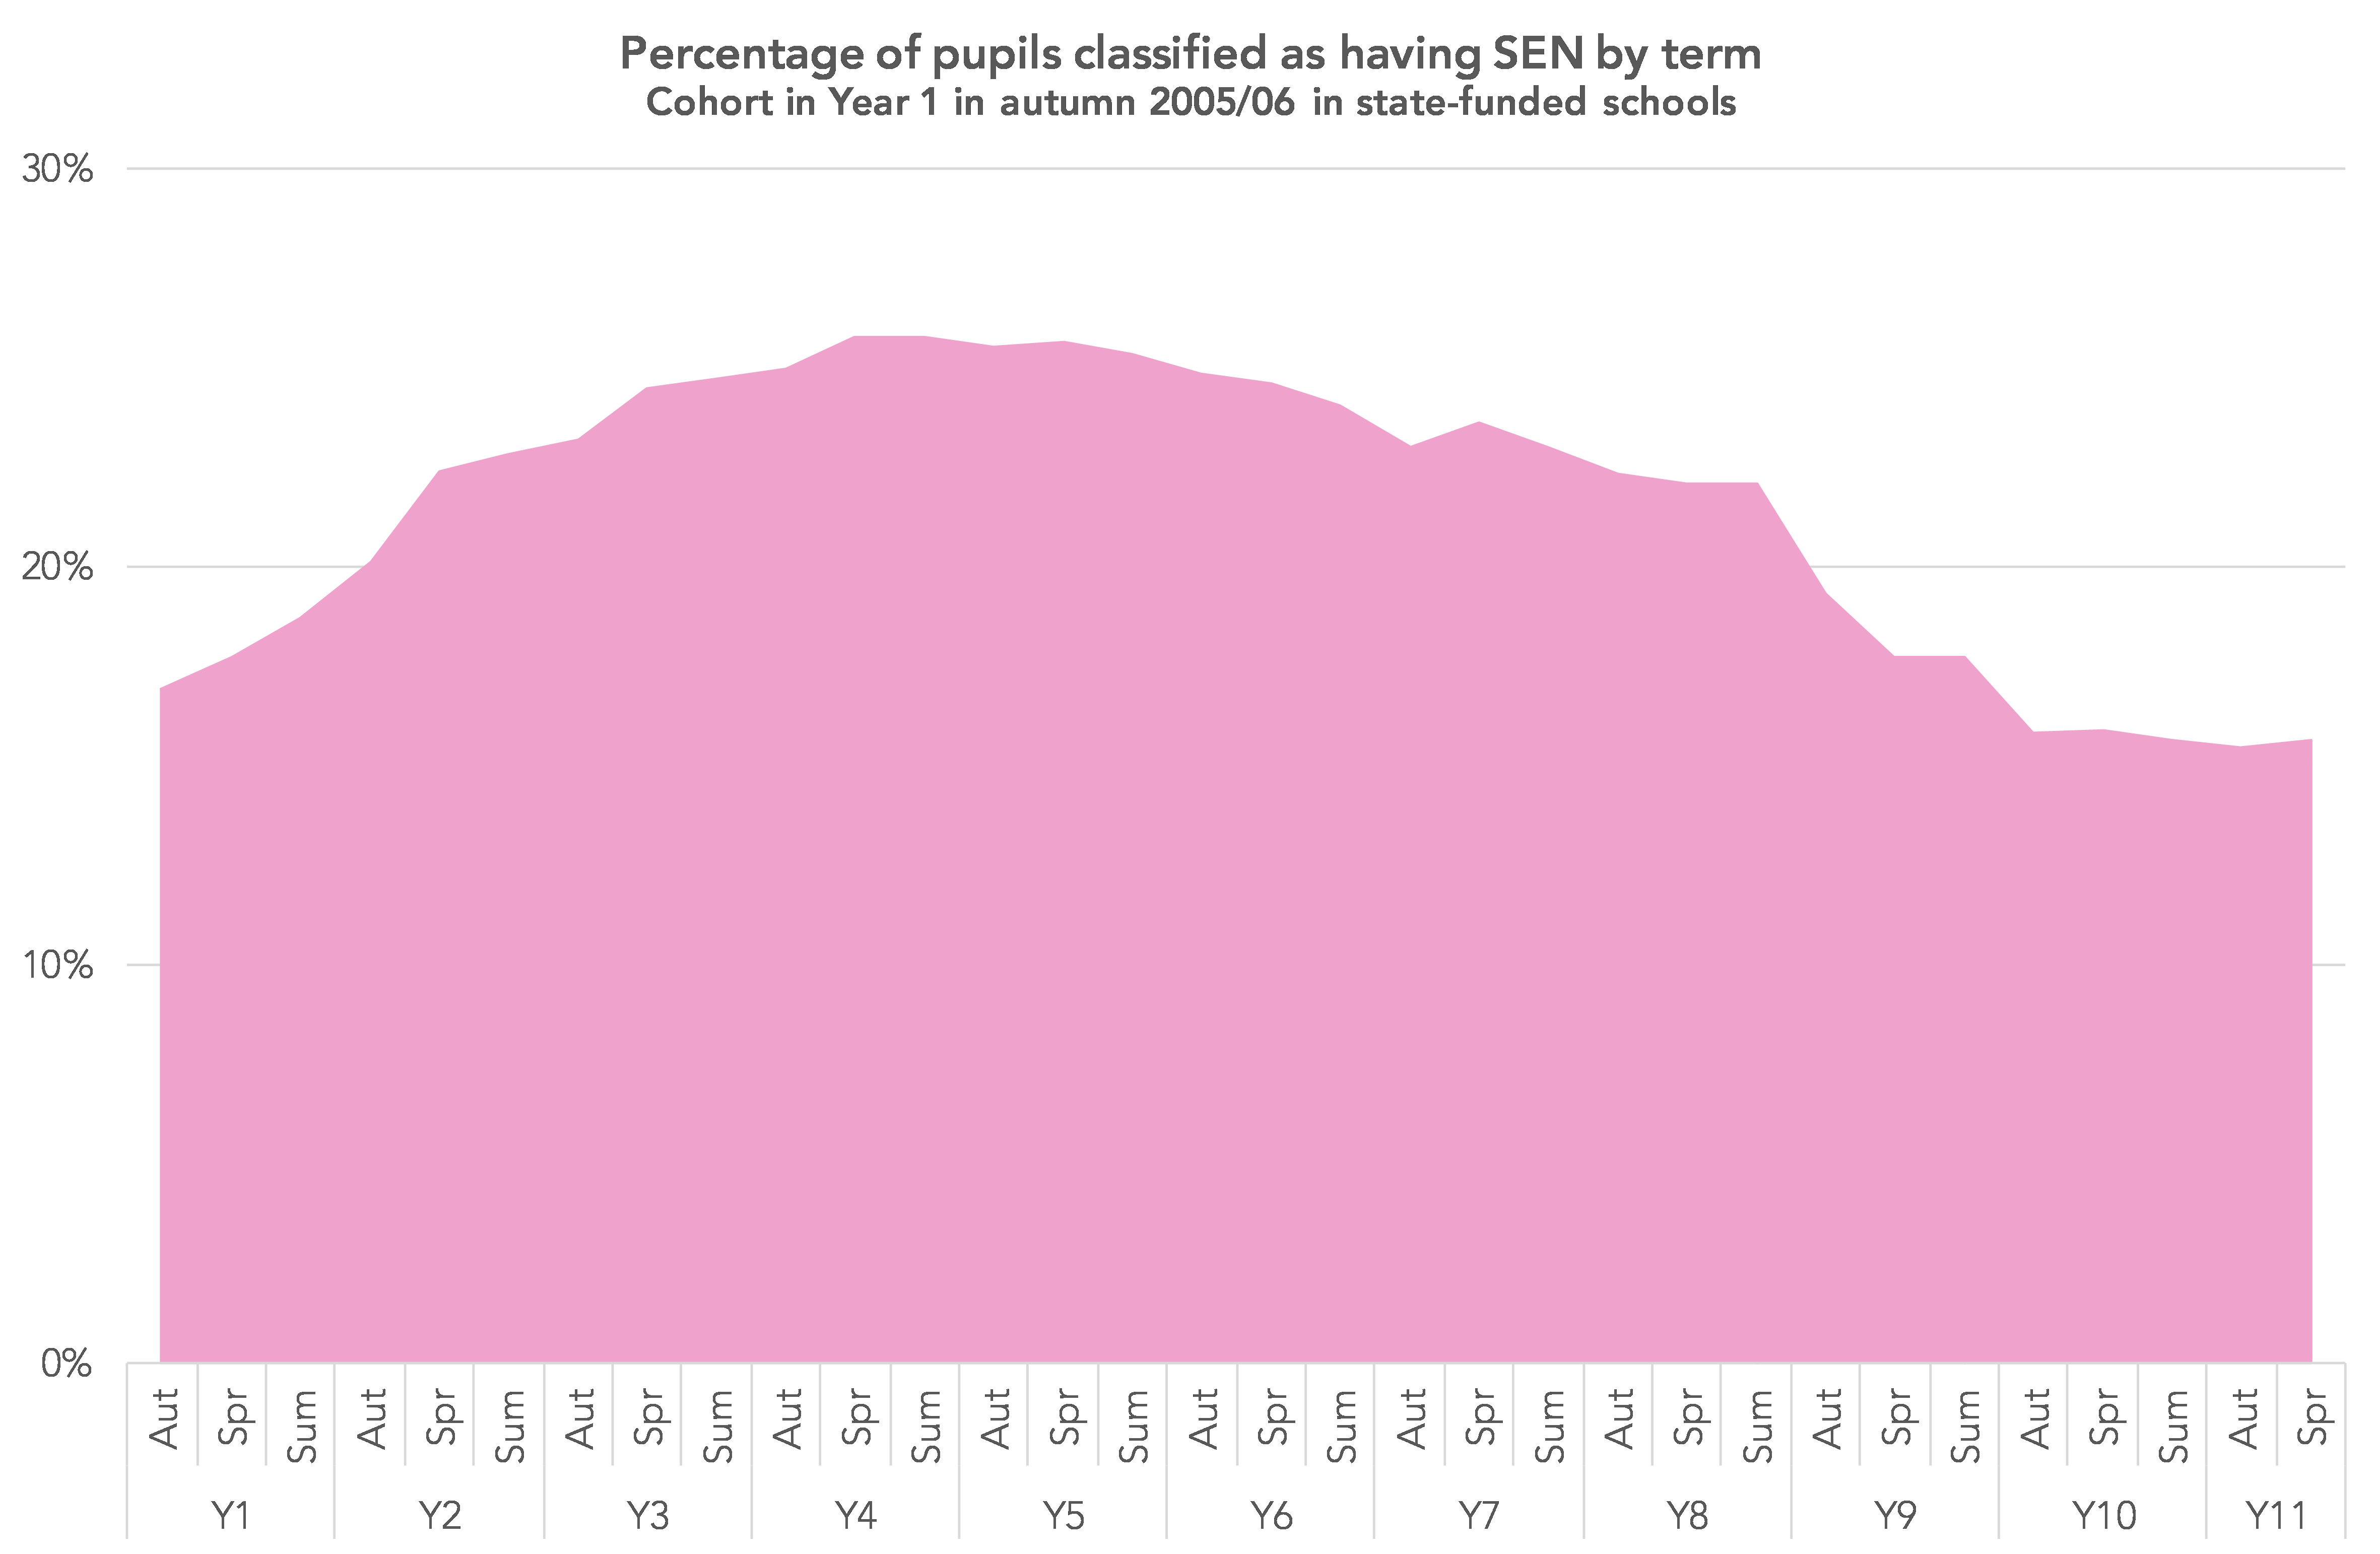
In autumn of Year 1, 17% of the pupils were classified as having SEN. This rose to almost 26% by the spring term of Year 4, before falling to 16% by the spring of Year 11.
The chart below adds in detail on the SEN classification – showing pupils who were classified as having SEN for the first time (green) and those classified as having SEN for the final time (blue).
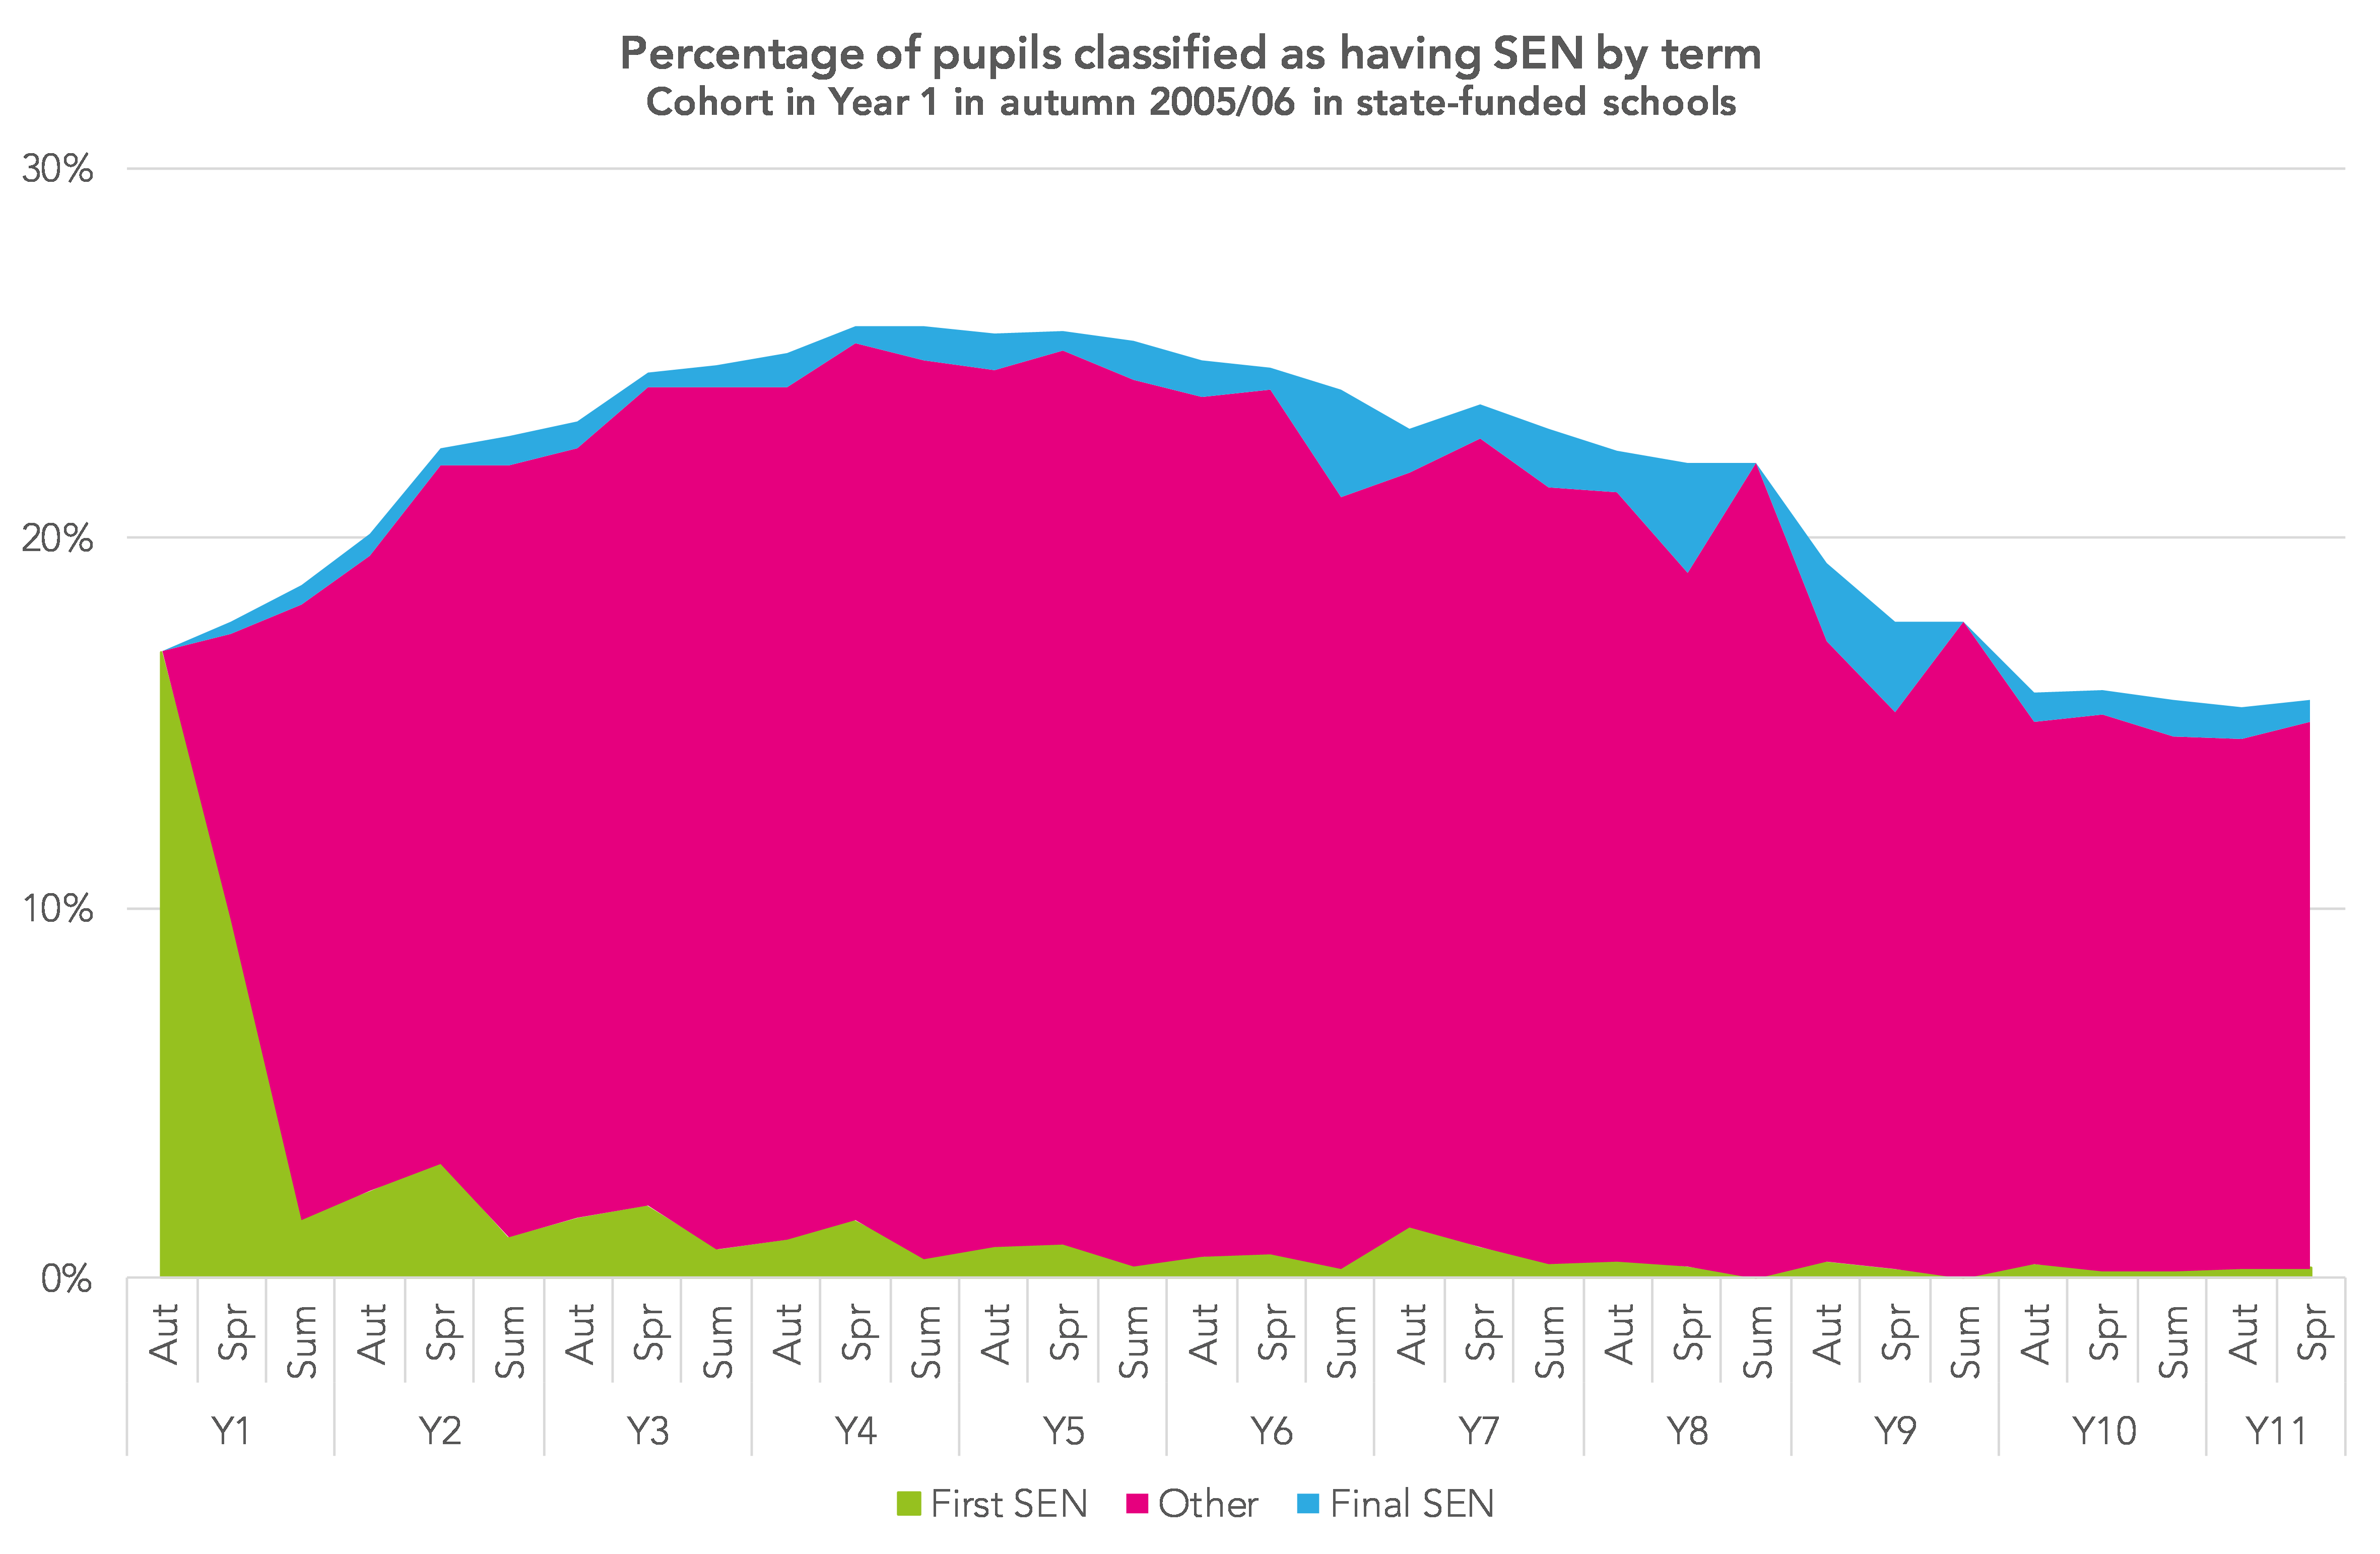
(Some pupils would in fact have been classified in nursery and Reception before the chart starts.)
In primary schools, the incidence of pupils being classified as having SEN for the first time falls as pupils get older, although there are spikes in each spring census – used by many local authorities to allocate funding based on SEN provision. Another spike then occurs in the autumn of Year 7 when most pupils would have changed schools.
The incidence of pupils being classified as having SEN for the final time is much more common in secondary schools than in primary, particularly in Years 7 to 9.[2] This will include pupils leaving the state-funded schools sector, including those moving into alternative provision.
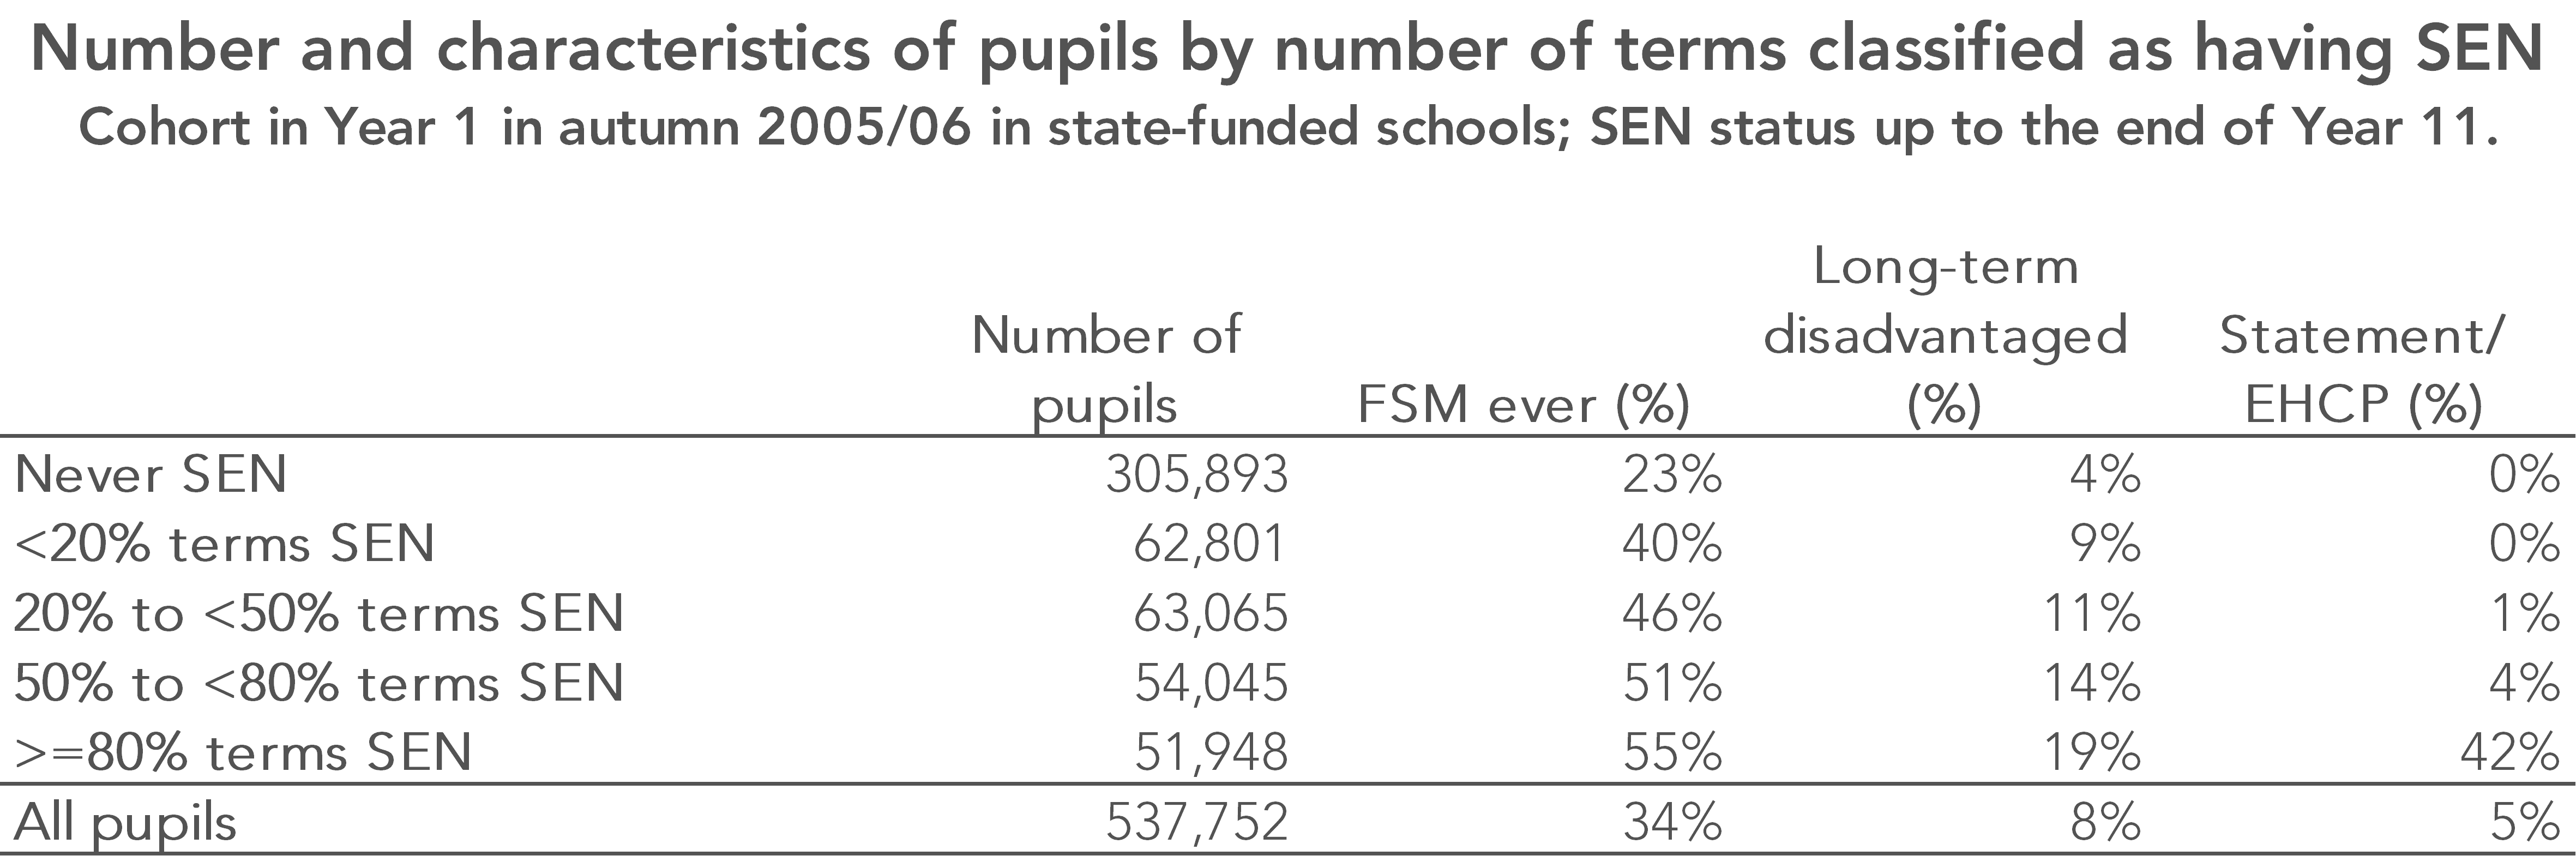
Some pupils spent just a few terms on schools’ SEN registers. But, 52,000 pupils spent at least 80% of their school career classified as having SEN and, as the table below shows, this group were five times more likely to be long-term disadvantaged than pupils who were never SEN. Over 40% of these pupils had a statement of SEN/EHCP – but this means that around 30,000 pupils had long-term SEN but did not have a statement/EHCP.
As the chart below shows, in total, 44% of the cohort had ever been classified as having SEN by the time they reached the end of Year 11.
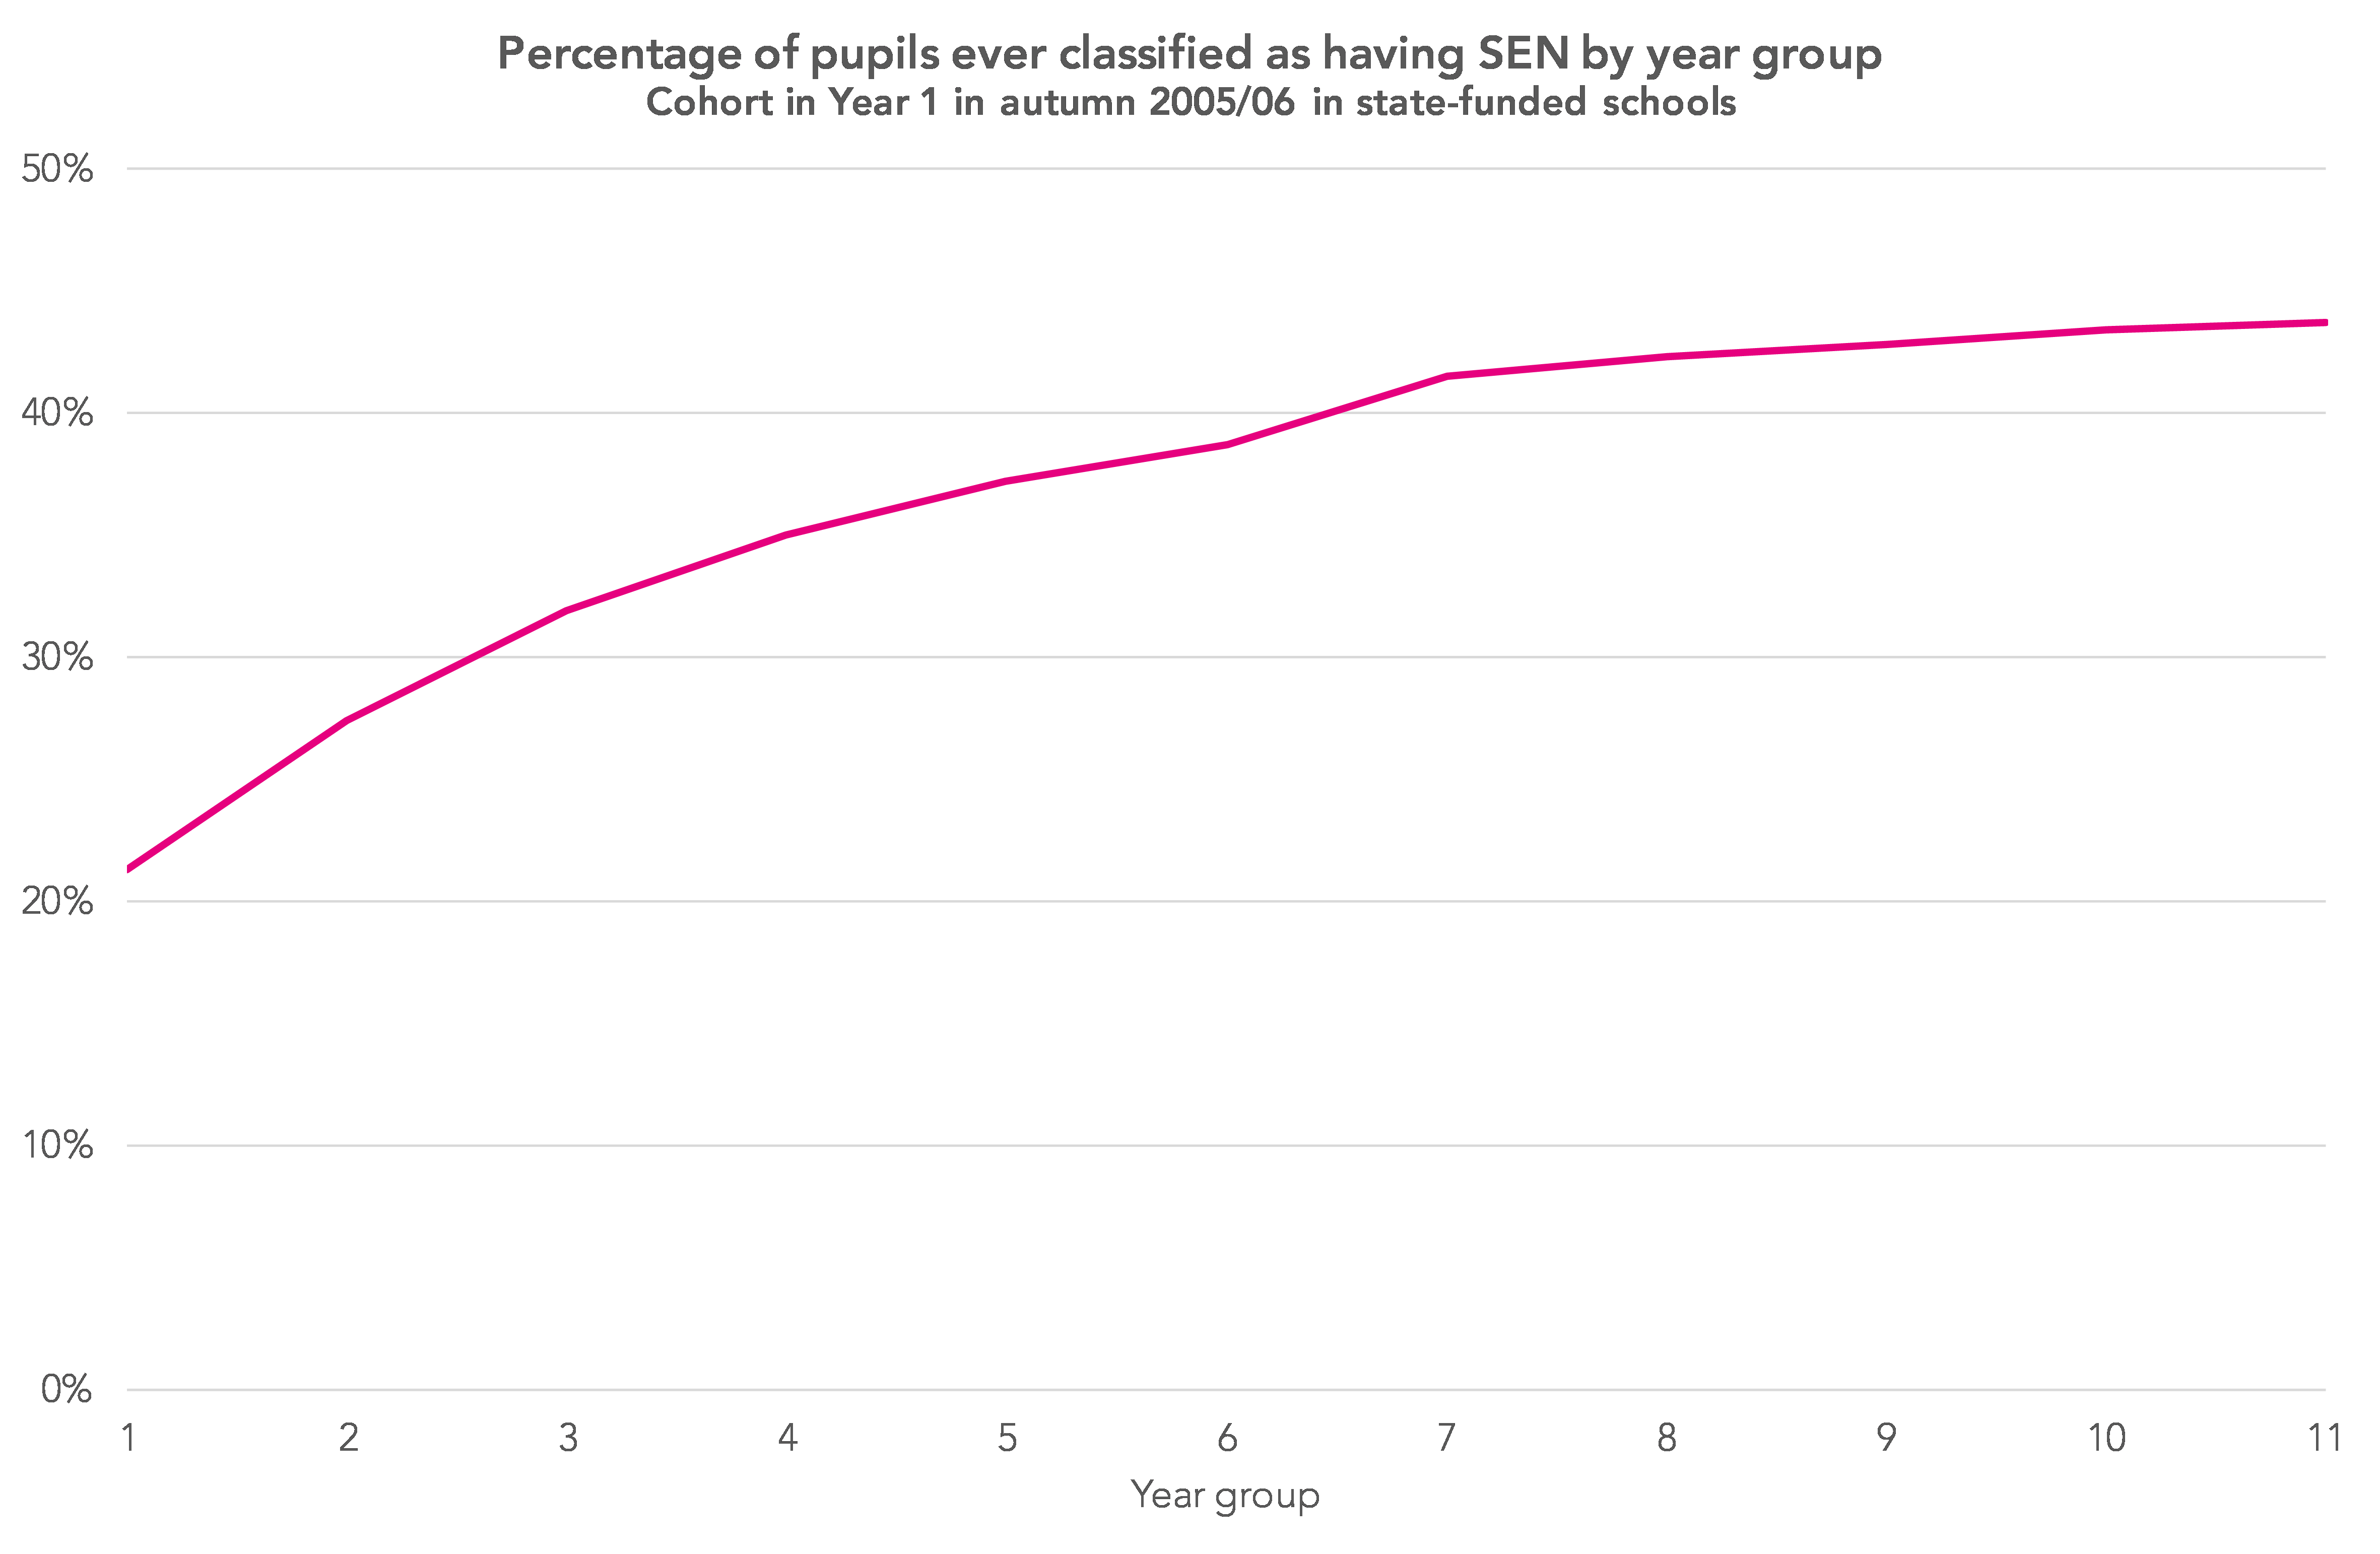
By the end of Year 1, just over 21% of pupils had been classified as having SEN (either in early years or Year 1). This figure almost doubled to just under 42% by Year 7, increasing by just another 2 percentage points to 44% by the end of Year 11.
So probably a larger percentage than you might have thought from a quick glance at official SEN statistics.
That said, given the changes to SEND introduced in 2014, we might expect proportionately fewer pupils to be classified as having SEN in future.
The chart below shows the proportion of pupils to be classified as having SEN by the end of Year 1.
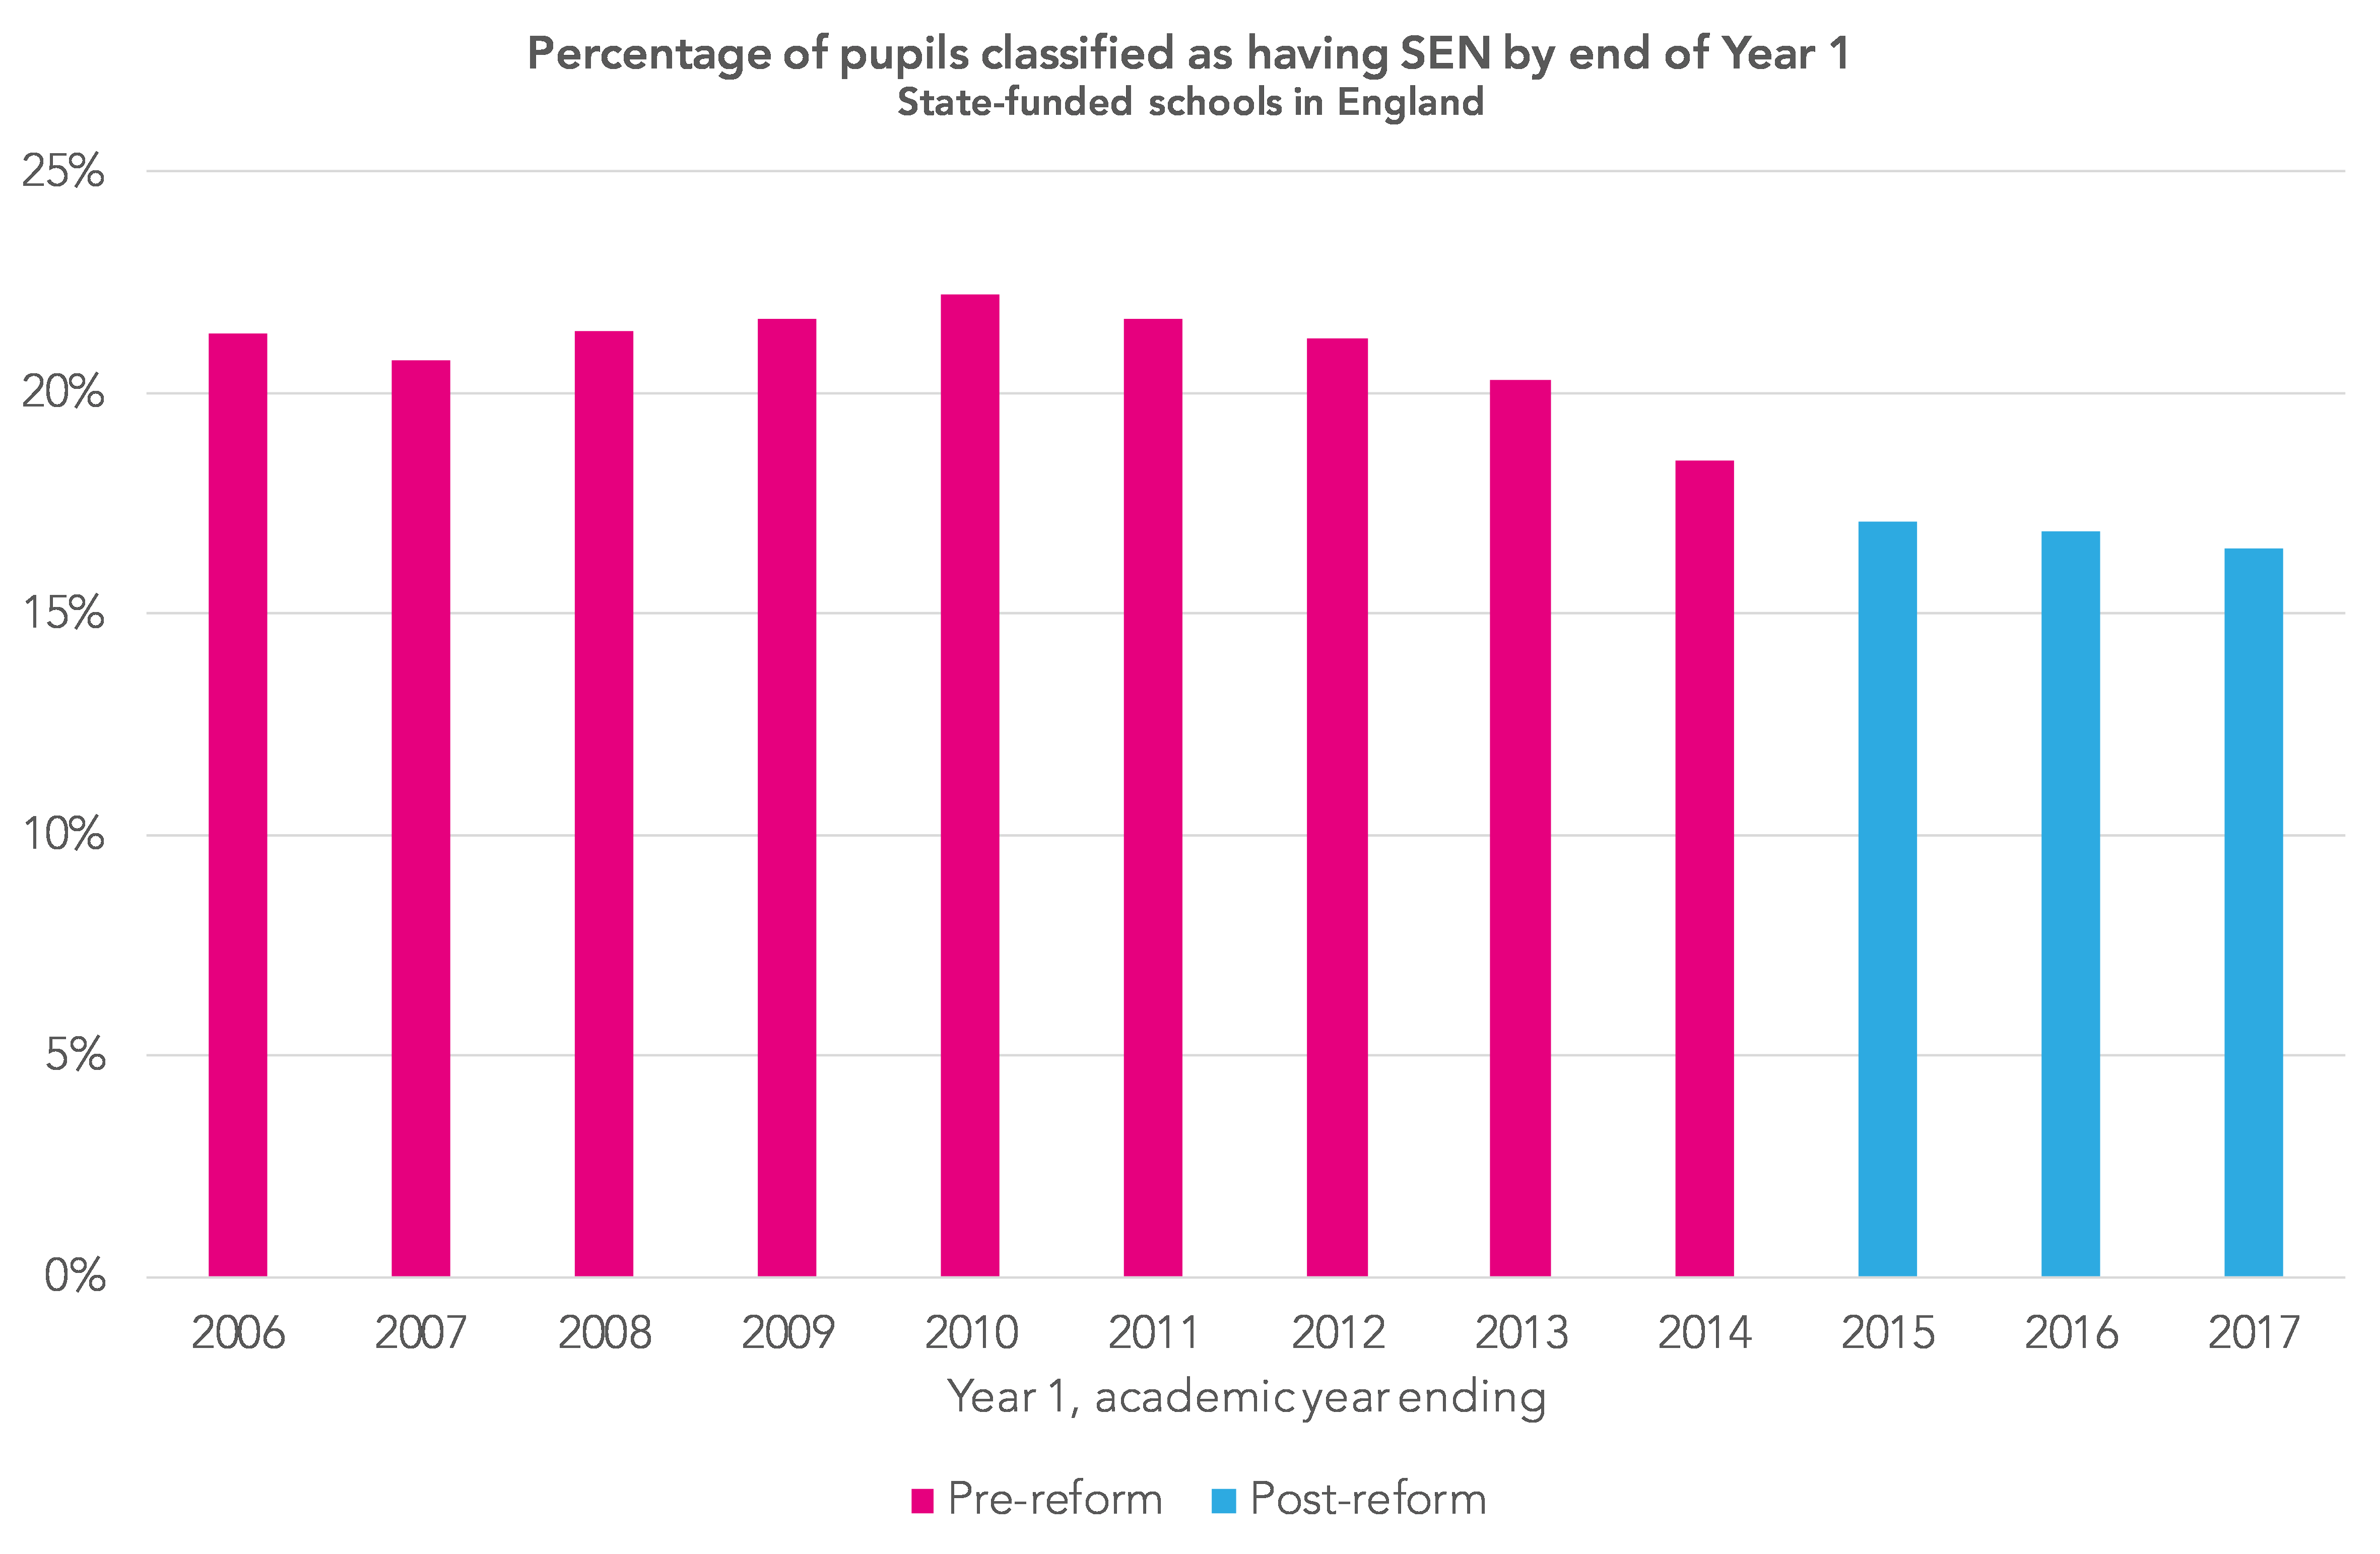
Whereas 21% of the cohort looked at in this blogpost had been classified as having SEN by the end of Year 1, just 17% of the more recent 2016/17 cohort had.
Want to stay up-to-date with the latest research from FFT Education Datalab? Follow us on Twitter to get all of our research as it comes out.
- Note that the national statistics figure cover those in state-funded schools and independent schools, while our analysis looks at those in state-funded schools only.
- SEN provision was not collected in school census in the summer terms of 2014 (Year 8) and 2015 (Year 9).
- Long-term disadvantaged pupils are those classified as eligible for and claiming free school meals in at least 80% of school census returns during their school career up to the end of Year 11.

Leave A Comment