This blogpost is part of the FFT KS2 Early Results Service. The service, available through FFT Aspire, allows schools to upload and receive an early analysis of their KS2 results.
So far, over 5,500 schools have participated in the FFT KS2 Early Results Service, the first year we have offered it.
The Department for Education produces interim statistics on attainment at a national level. We already know that the percentage of pupils achieving the expected standard has increased in maths but fallen in reading. Trends in reading and maths are shown in the chart below.
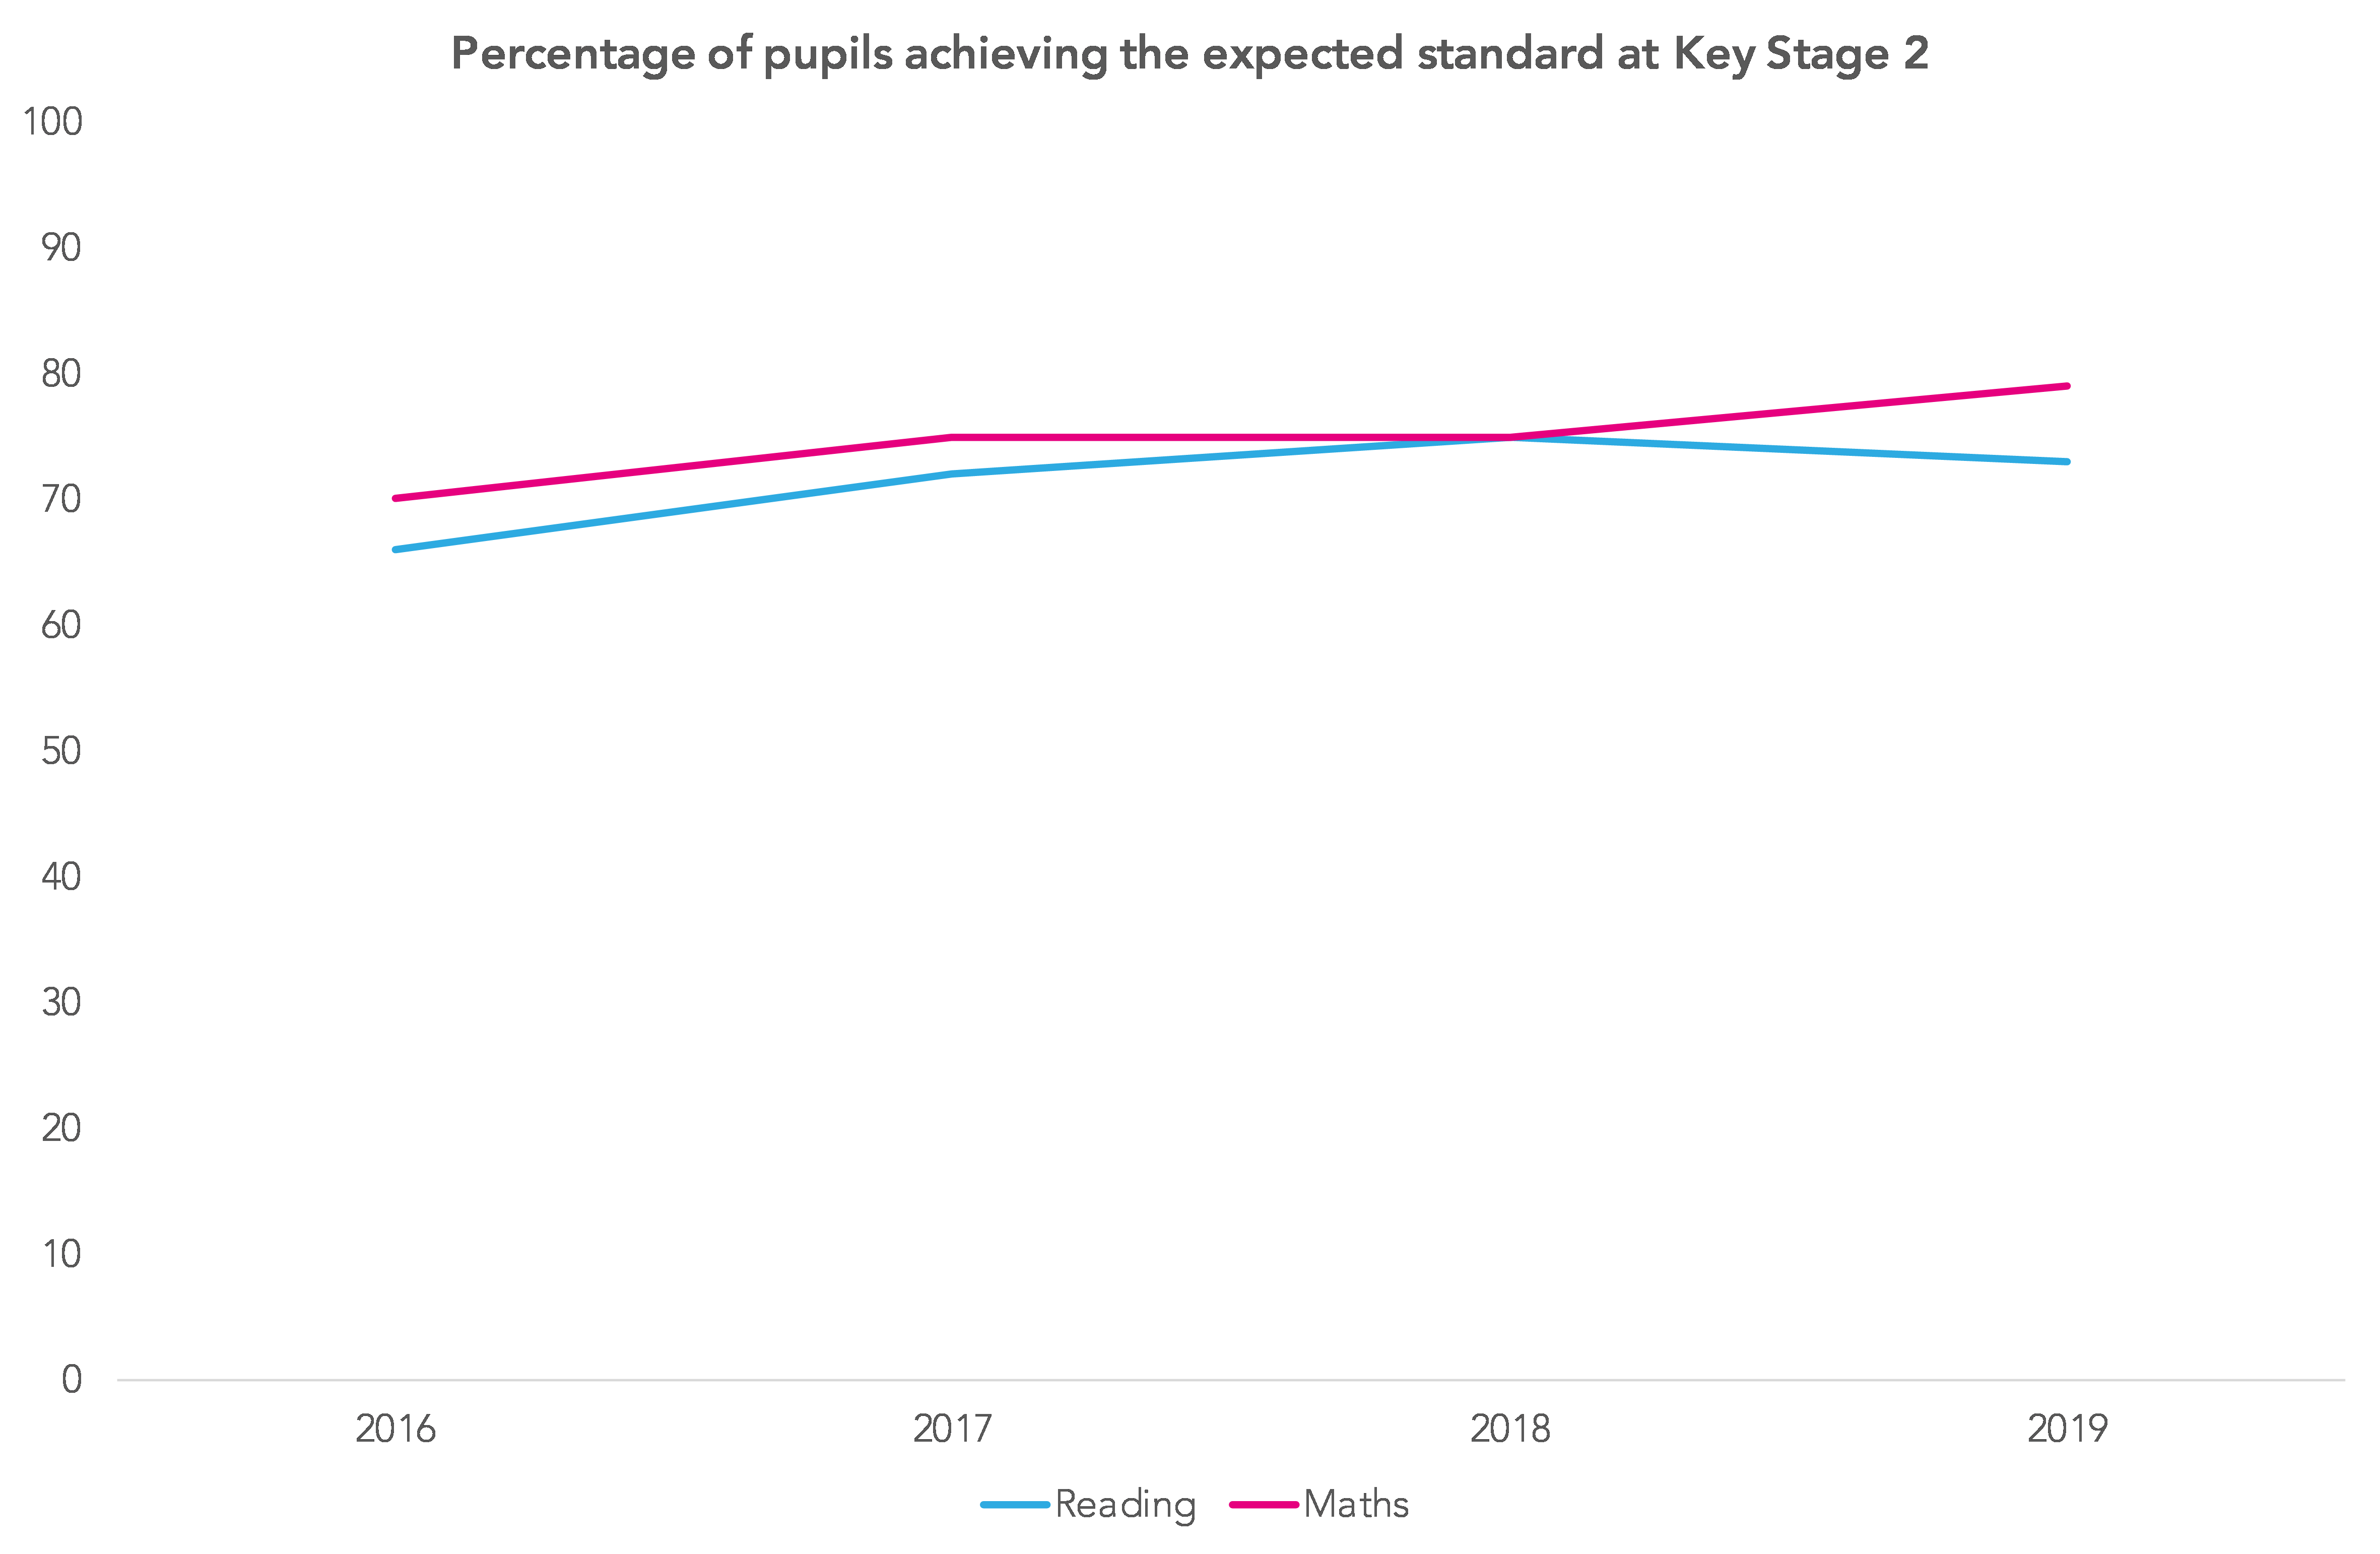
This was the fourth year of the new tests, and this cohort was the first to have completed the whole of Key Stage 2 since the revised primary curriculum was introduced in September 2014.
A fall in the percentage of pupils achieving the expected standard is not unprecedented. A similar thing happened in maths in the fourth year of the original national curriculum tests – 1998 – though it is very hard to look at the following chart and not suspect that something odd happened in setting the Level 4 boundary that year.

Looking now at data collected through the Early Results Service, lowering the 2019 expected standard threshold to 27 marks (instead of 29) would have resulted in 75% of our sample achieving it, rather than 73%.
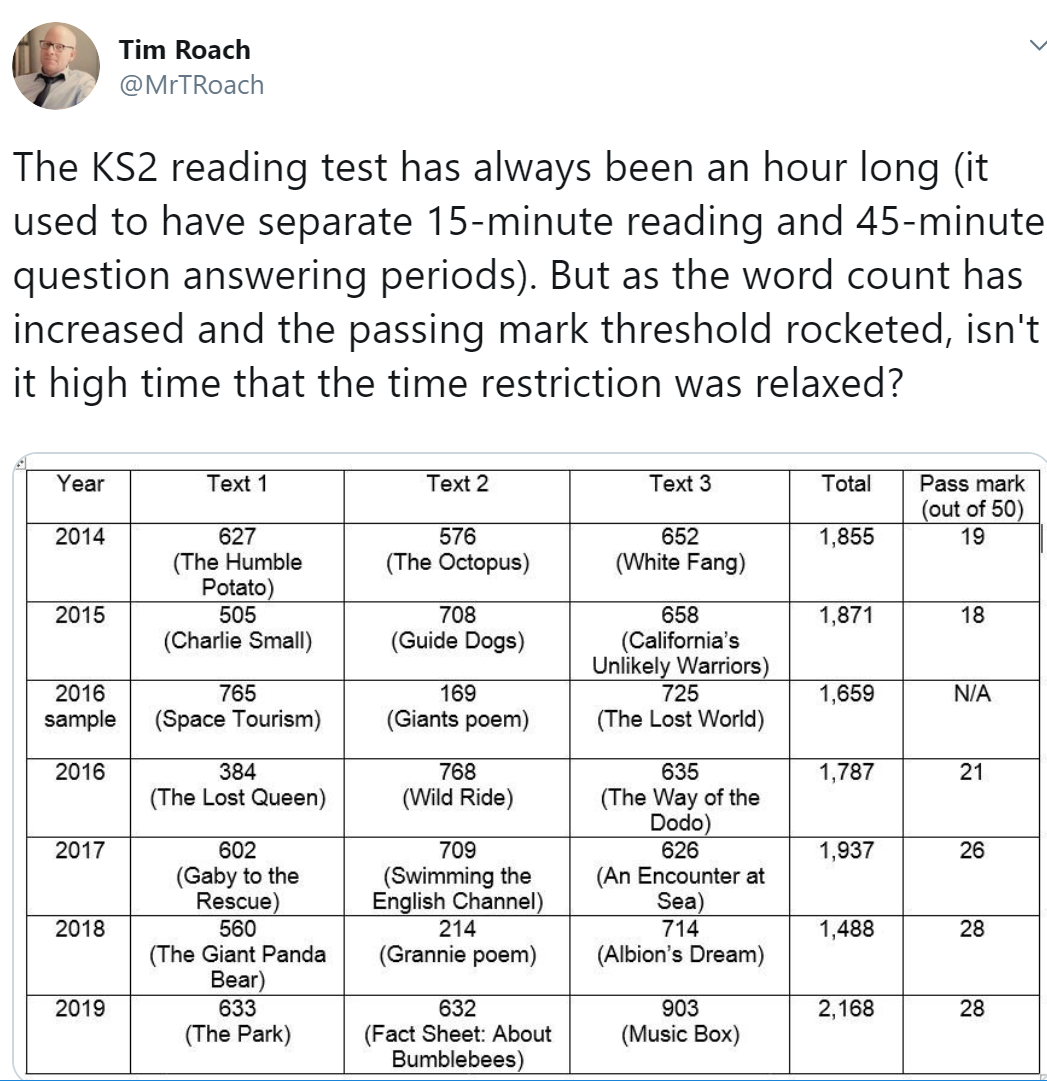
Some have suggested that the test may have been more difficult this year, not necessarily because the questions were harder but due to the number of words pupils had to read.
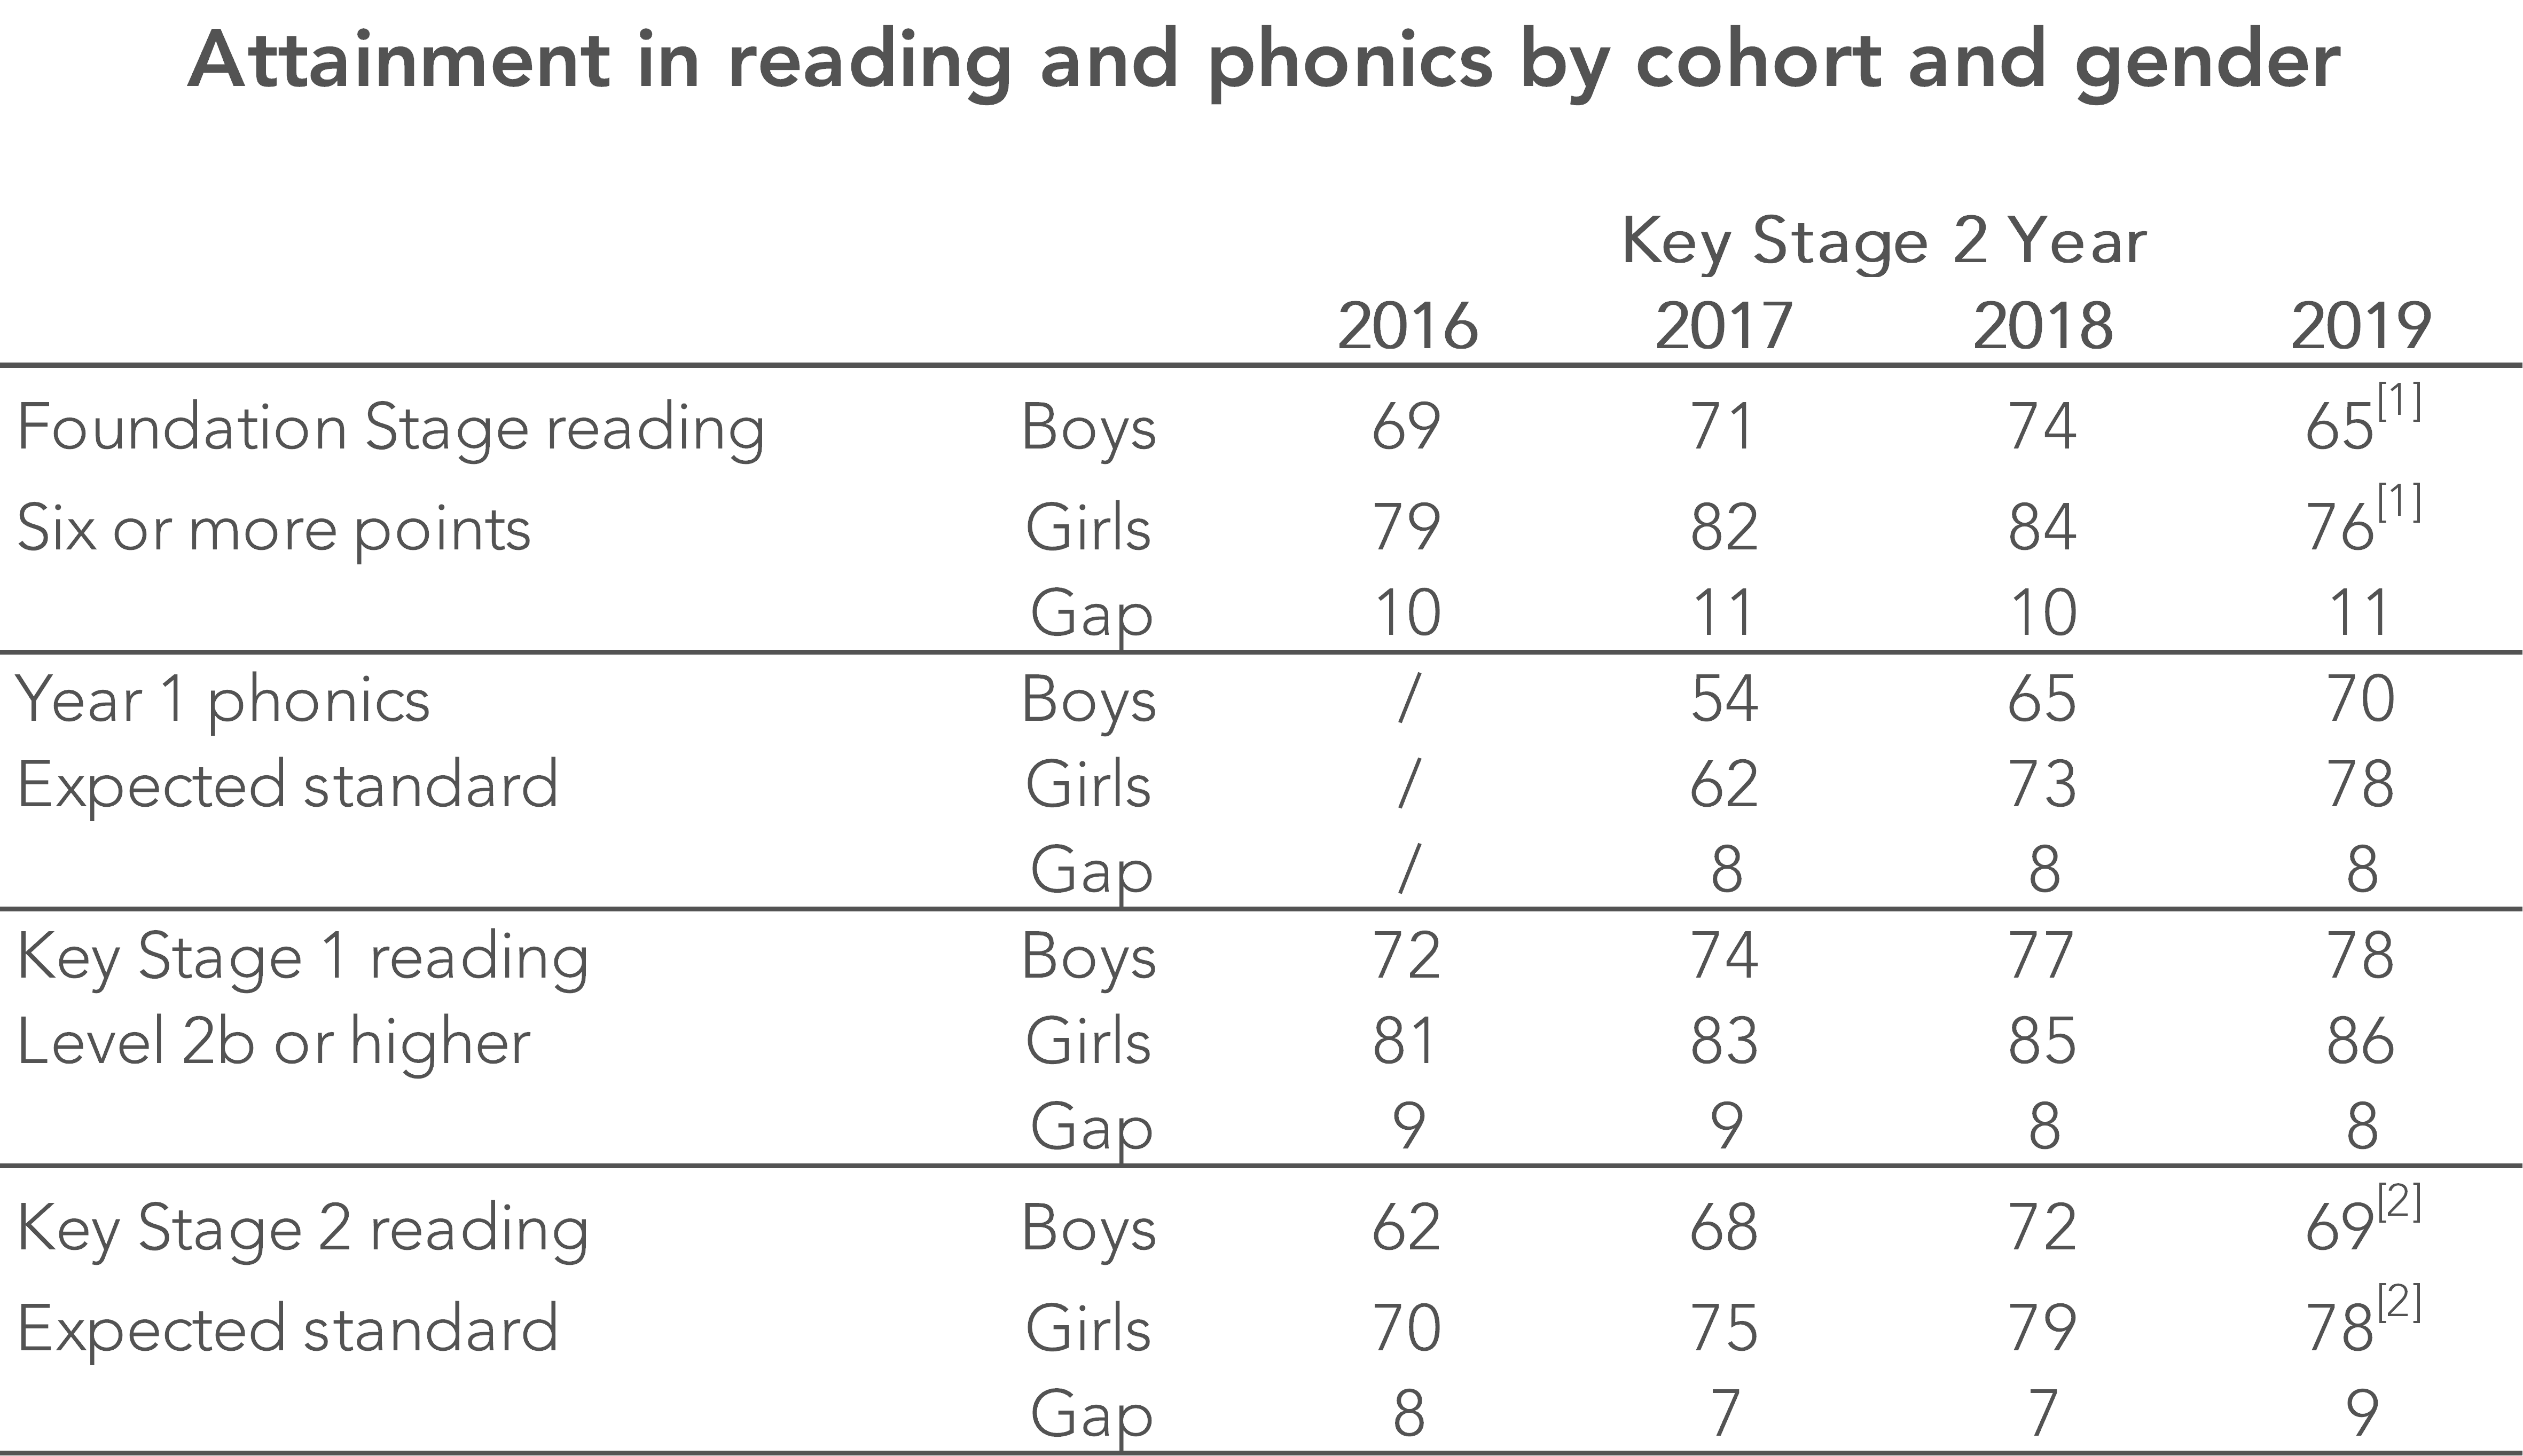
Based on the early data we have collected, it appears that the gender gap in terms of the percentage of pupils achieving the expected standard in reading has widened to 9 percentage points (from 7 percentage points last year), as shown in the final row of the table below.
FFT Aspire users
Already uploaded your KS2 results?
Click here to download your Aspire report.
Haven’t uploaded your KS2 results yet?
There’s still time to get a KS2 report. Click here for further details.
Want a KS1 report as well?
Click here for further details.
Not an FFT Aspire user?
Also shown are previous gaps in reading attainment for each national Key Stage 2 cohort. Boys lagged behind girls by 8 to 11 percentage points in all previous national assessments.
The attainment gap in reading widened slightly during Key Stage 2: early value added data suggests girls achieved 1.18 more scaled score points than boys with similar prior attainment. Among the same schools in 2018, the equivalent figure was 0.83 points.
Overall, boys’ and girls’ mean scaled scores differed by 2.45 points in 2019, hence around half of the gap (1.18) can be attributed to boys falling further behind during Key Stage 2 (half of the difference already exists by the end of Key Stage 1).
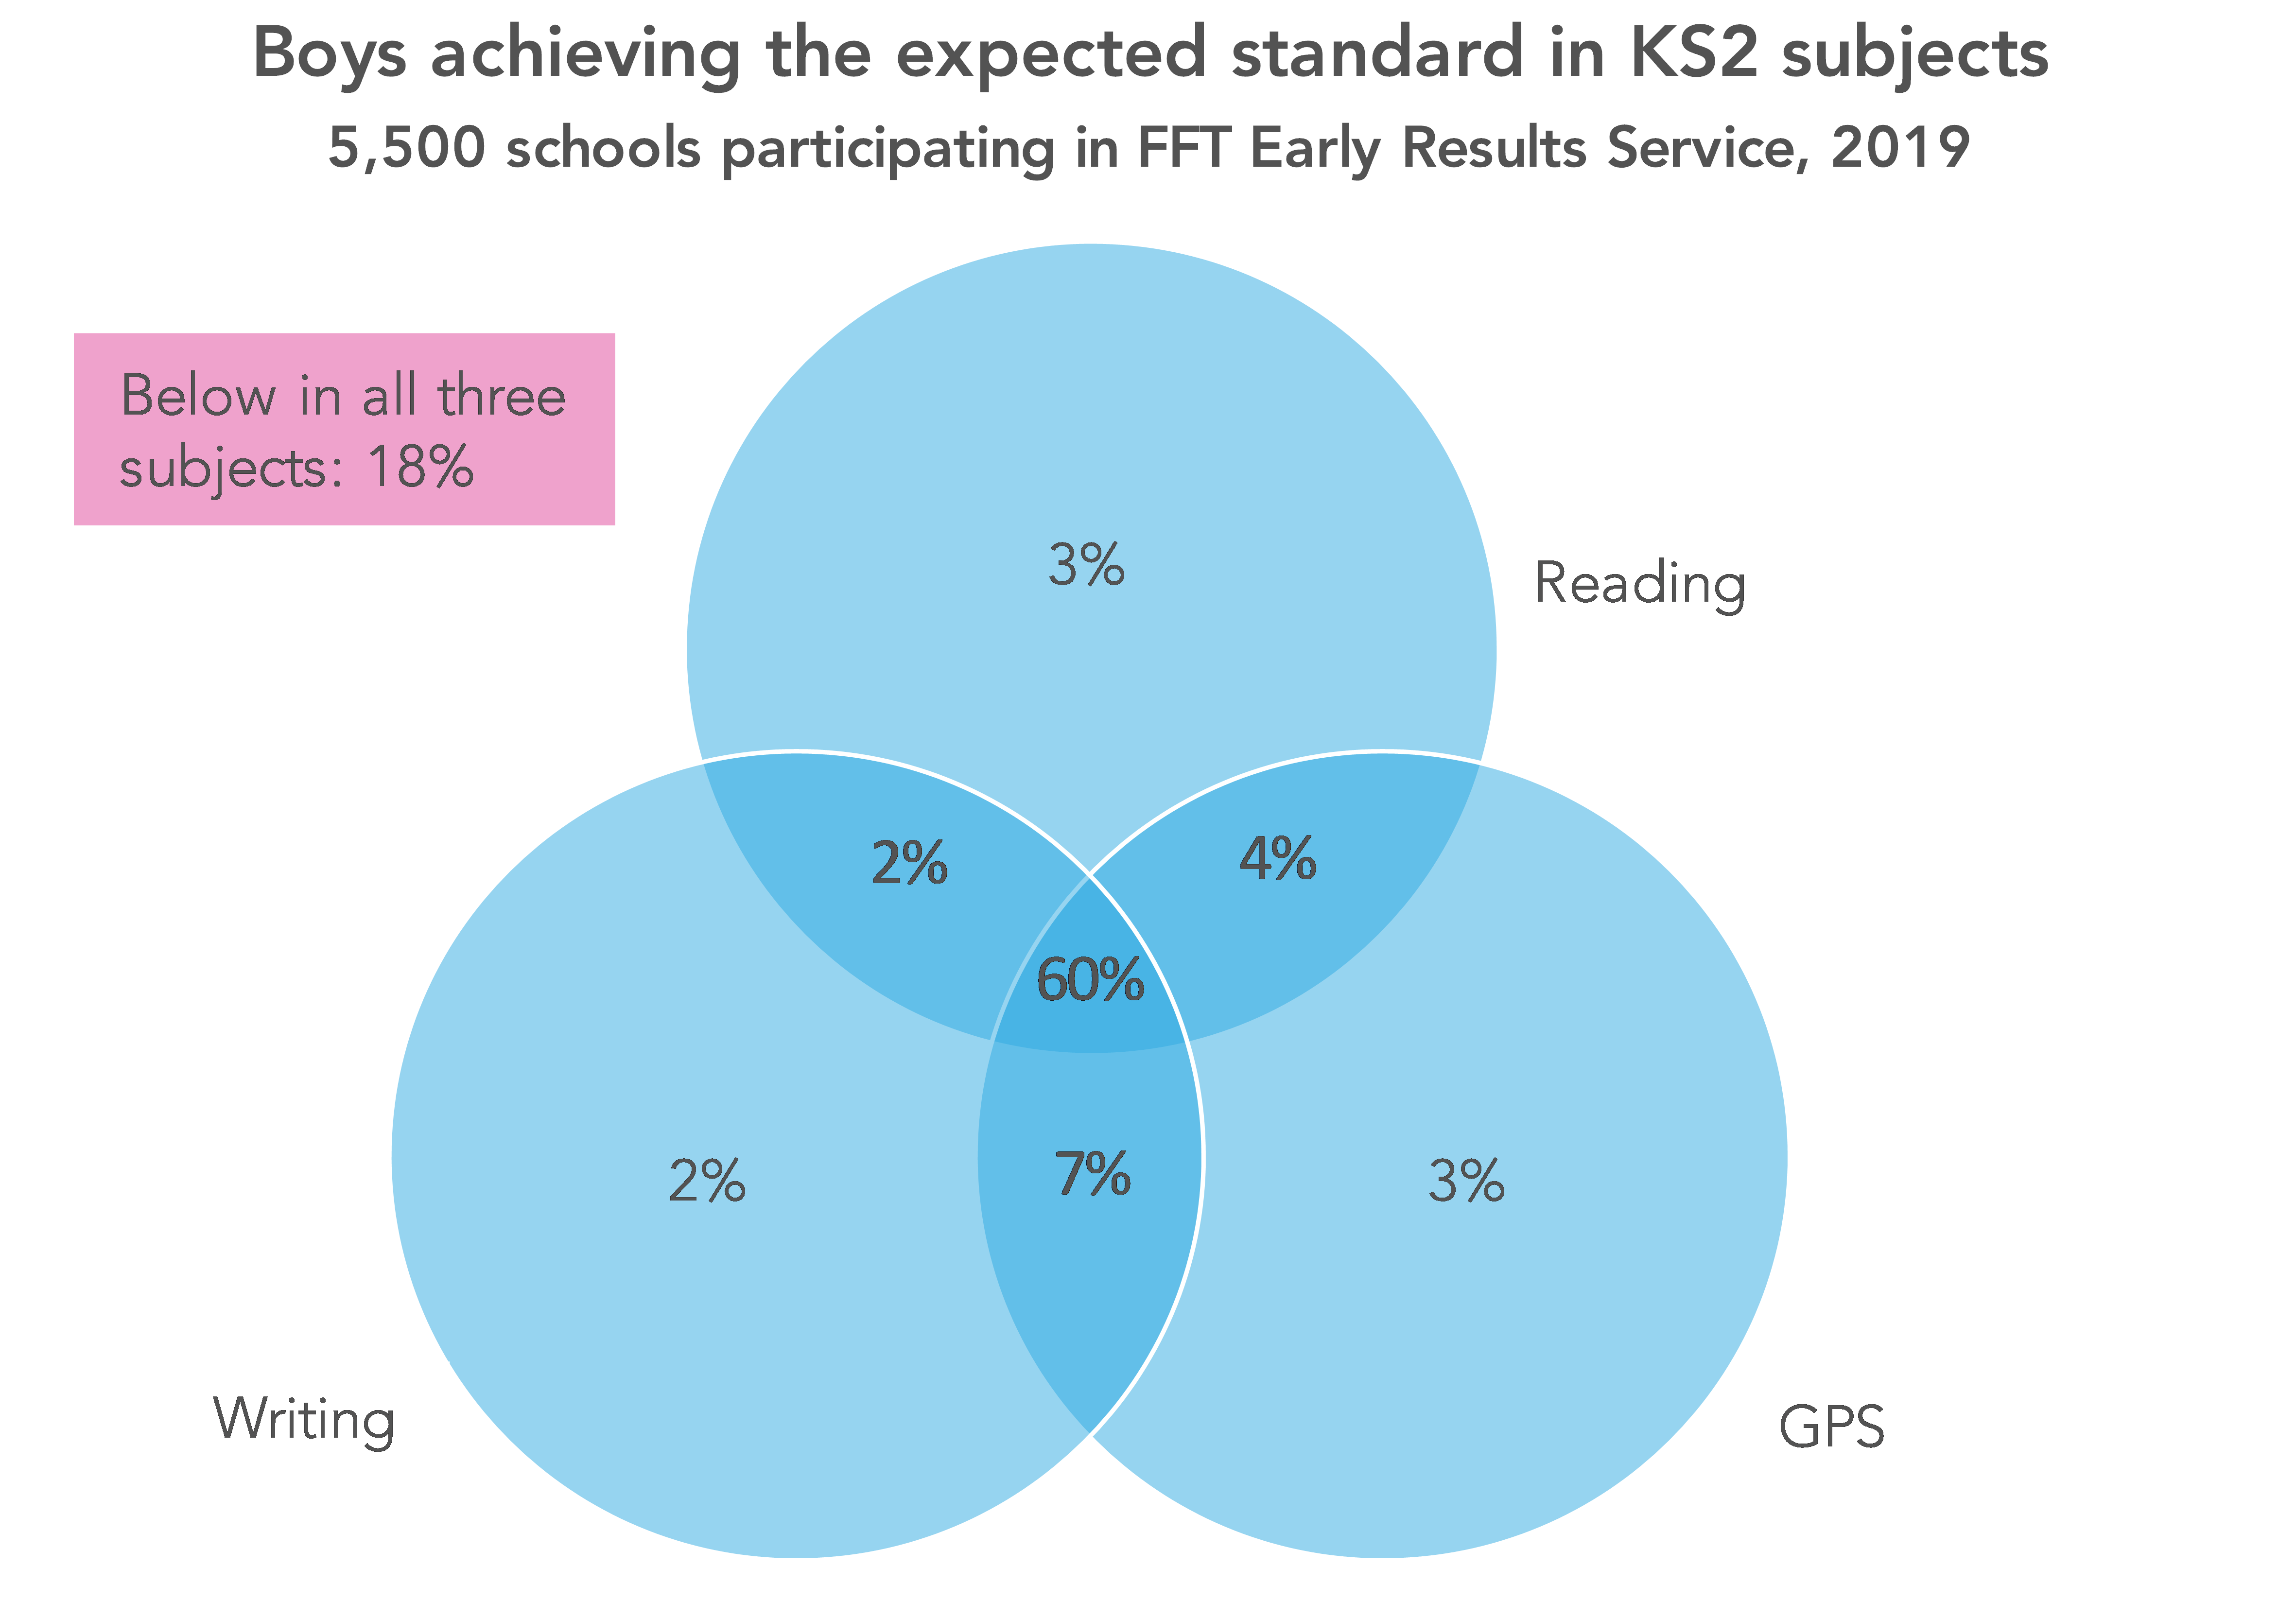
Reading is just one dimension of literacy assessed at Key Stage 2, the others being writing and grammar, punctuation and spelling (GPS).
As the chart below shows, 60% of boys achieved the expected standard in all three dimensions, compared to 71% of girls. 18% were below the expected standard in all three (compared to 10% of girls). 7% achieved the expected standard in writing and GPS but not in reading. Around half fell short of the standard threshold in reading by at most three marks[3].
It is possible that the expected standard threshold in reading was set a shade too high this year but, even so, the attainment gap between boys and girls appears to have increased. Closing the gap (based on our 2019 data) would mean (almost) all boys having to improve by 2-3 scaled score points.
Differences in attainment between boys and girls have existed for a long time, of course. As we showed in our blogpost on early 2019 Key Stage 1 outcomes, there is still quite a gap between boys and girls at the end of Key Stage 1. This is likely to widen further during Key Stage 2. Can any more be done?
Download your KS2 report now to see to how your school differs from national patterns.
Want to stay up-to-date with the latest research from FFT Education Datalab? Sign up to Datalab’s mailing list to get notifications about new blogposts, or to receive the team’s half-termly newsletter.
1. The 2019 Key Stage 2 cohort was the first to be assessed under the revised Early Years Foundation Stage Profile in 2012/13. Figures are not comparable with previous years.
2. Based on data submitted to FFT Aspire for 5,500 schools.
3. The standard error of measurement (SEM) of the 2018 reading test was 3 marks according to tab 18 of the 2018 National Curriculum Test Handbook.


Leave A Comment