How do the long-term outcomes for pupils who achieved grade D in one of English or maths, but grade C in the other, compare to those of pupils who achieved grade C in both?
Of the 593,000 pupils who turned 16 in 2007/08 and took exams in state-funded mainstream schools, 49% achieved grade C or above in both English and maths. By way of comparison, 66% of pupils achieved the equivalent standard (grades 9-4) in 2018.
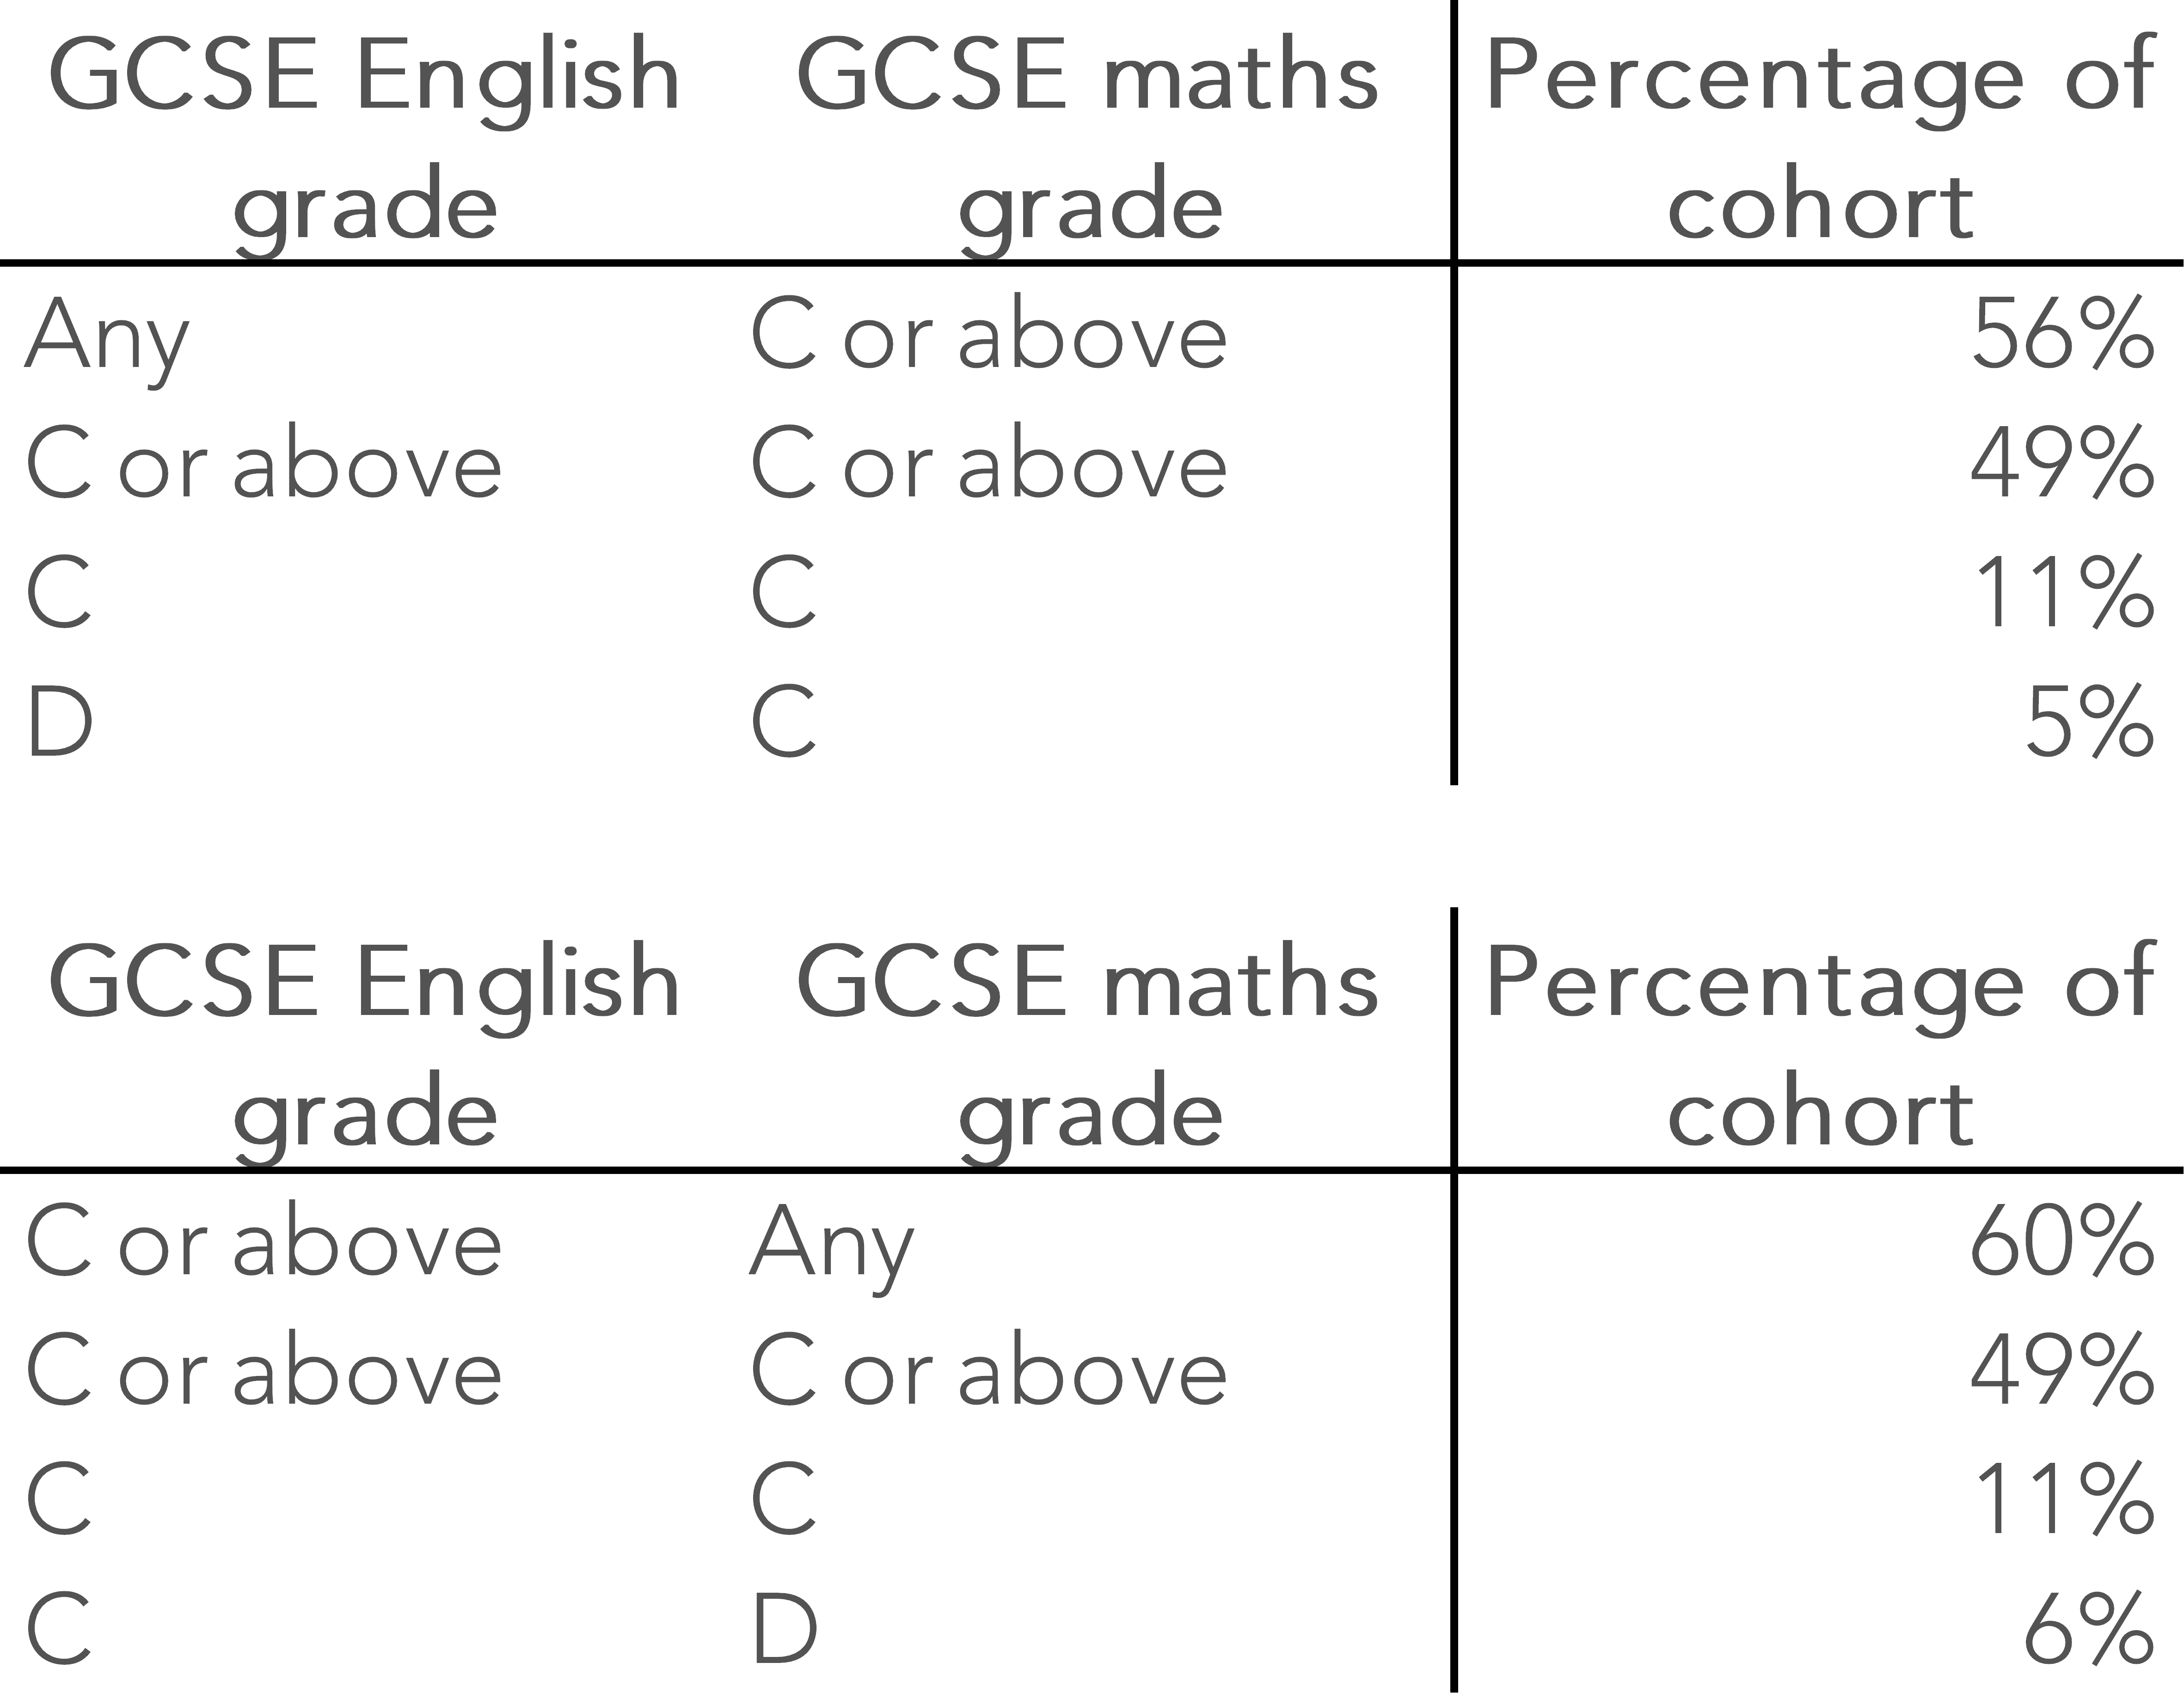
For this analysis, I’m going to look at the 11% of pupils who achieved (exactly) grade C in both English and maths.
This group are used as the comparator against which the results of the following two groups are measured:
- the 5% of pupils who achieved grade D in English and grade C in maths, and
- the 6% of pupils who achieved grade C in English and grade D in maths.
To try and compare like with like as much as possible, differences in pupil characteristics and school characteristics between the groups of interest and the comparator groups are controlled for.[1] One of the factors controlled for is pupils’ broad level of GCSE attainment.
Doing this gives a group of 27,146 pupils matched to those who missed out a grade C in English, and a separate group of 33,843 pupils matched to those who missed out on a Grade C in maths.
Comparing outcomes
What does this show us?
Overall, pupils who miss out on a grade C achieve slightly poorer long-term outcomes by age 24 than pupils who achieve grade C in both English and maths.
The tables below shows how these groups compare.

Missing out on a grade C in English is associated with weaker educational outcomes. Pupils who achieved grade C were more likely to have achieved two or more A-Levels or equivalents and, correspondingly, to have achieved a first degree by 24.[2] While there were differences in employment rates and earnings at age 24, these were not particularly large.
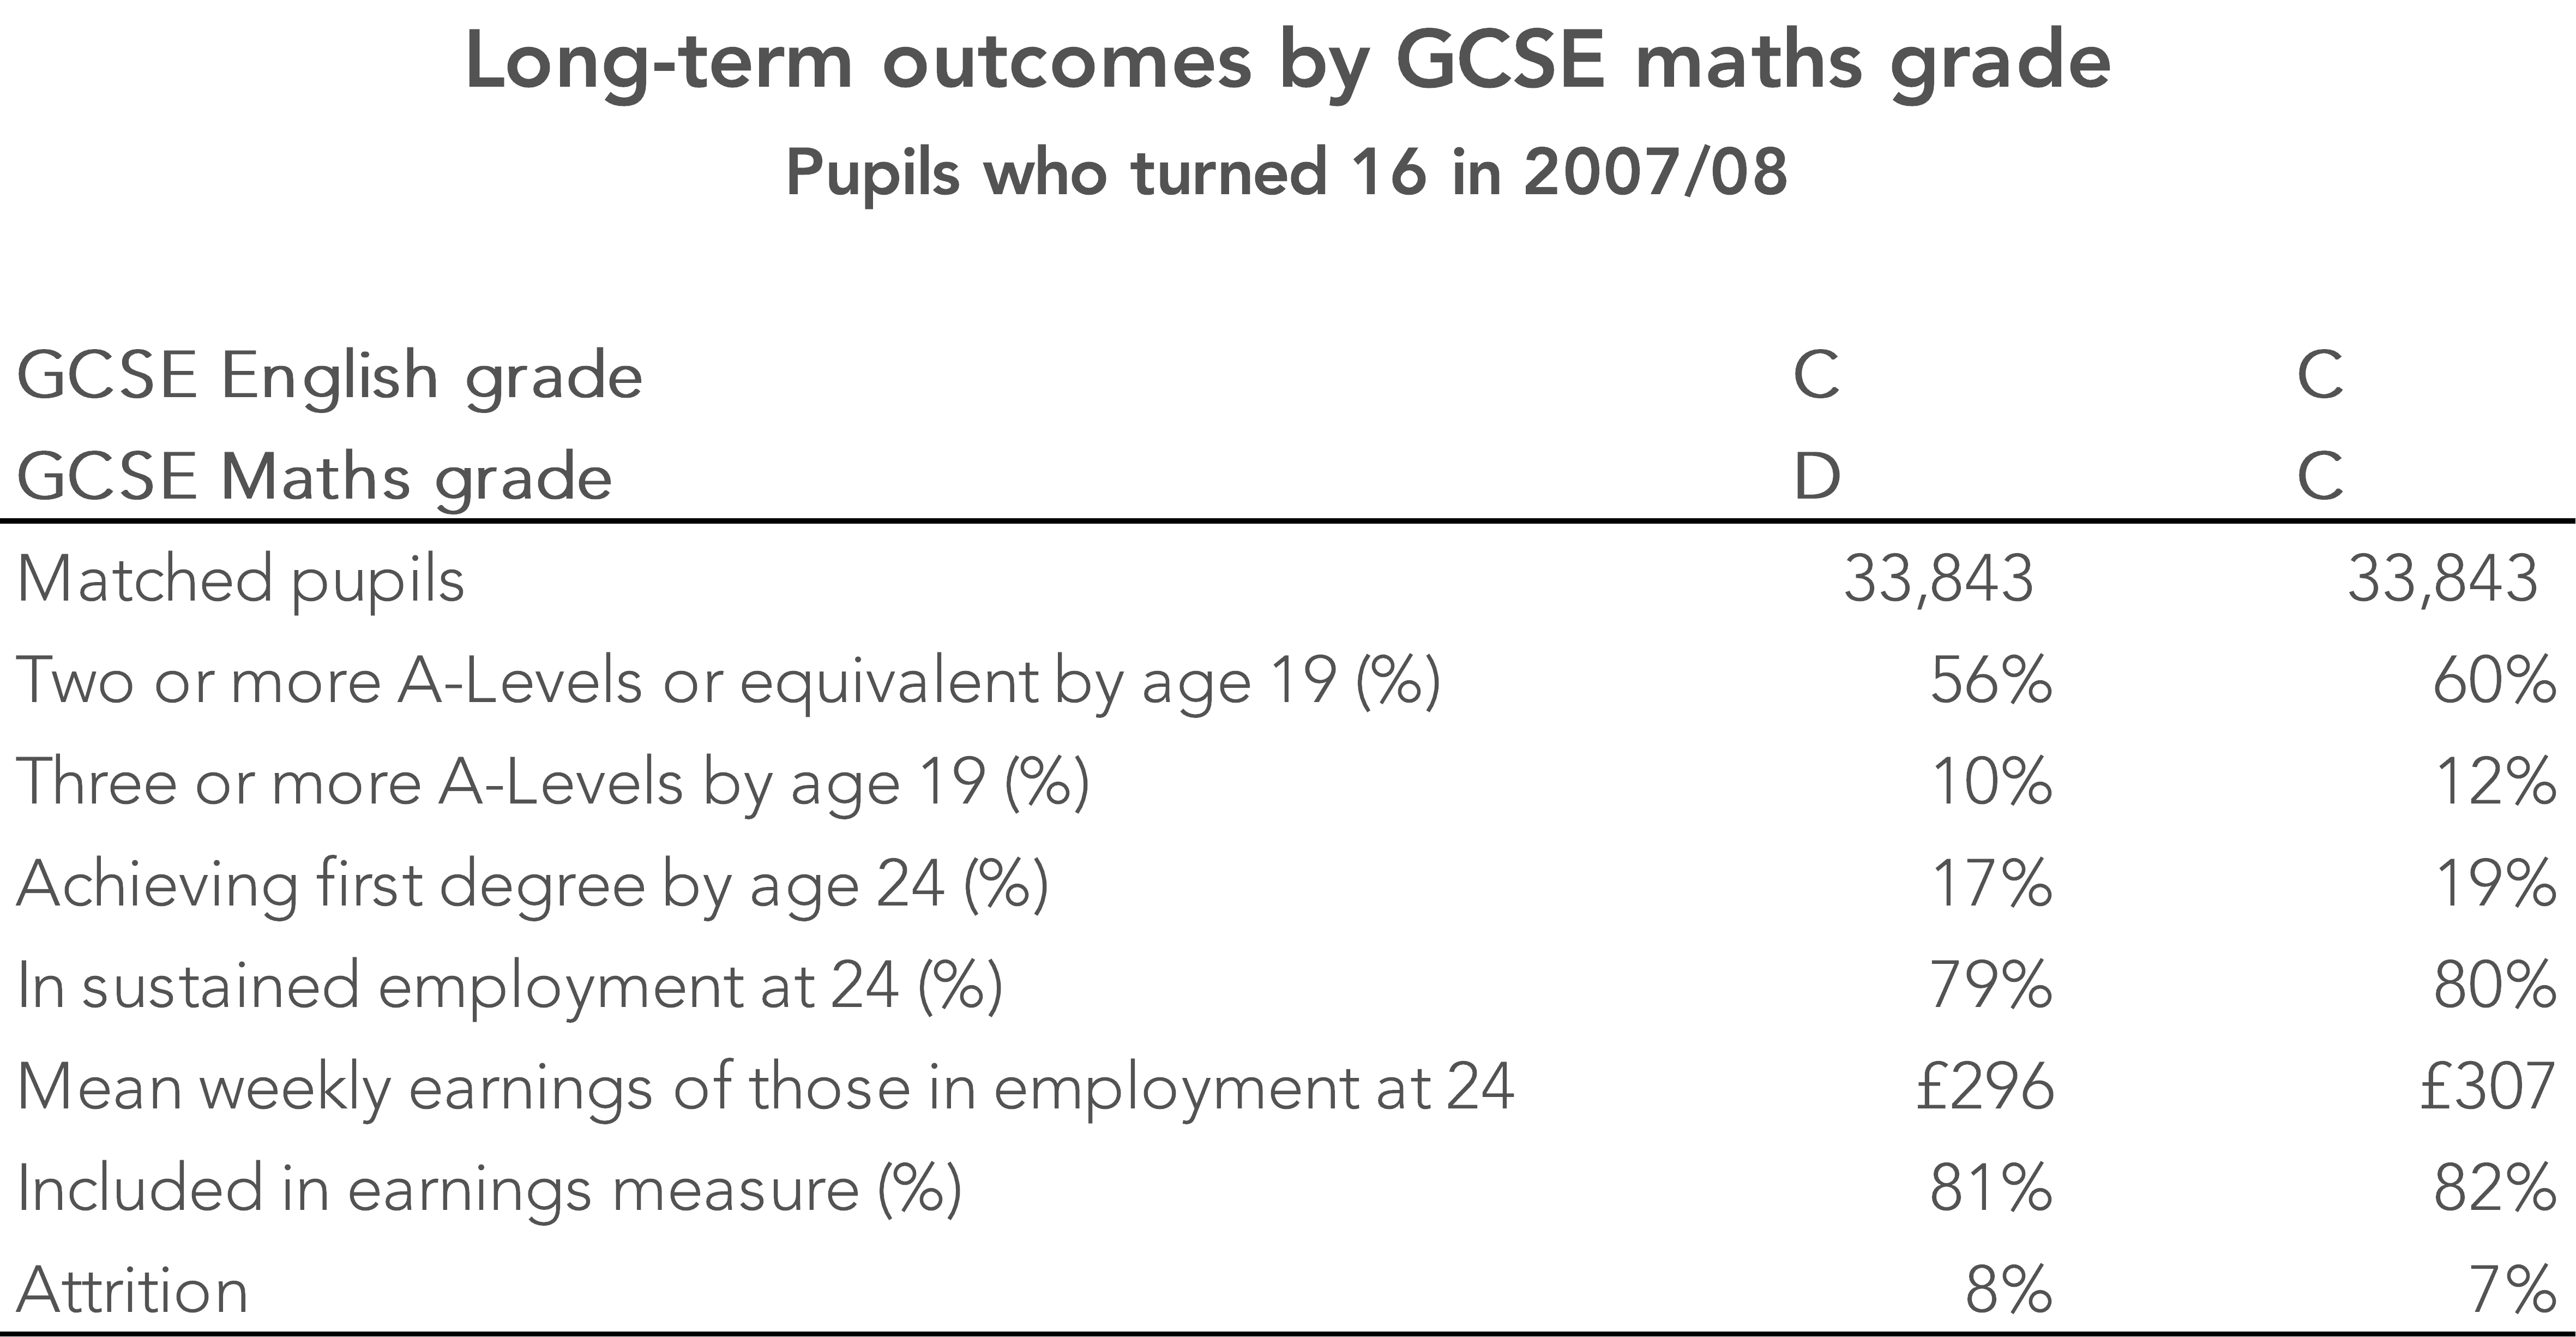
Compared to the position in English, differences in educational outcomes are narrower among pupils who miss out on a grade C in maths. However, the differential in earnings was slightly greater at £11 per week.
In summary
Compared to pupils who had achieved grade C in both English and maths by age 16, the long-term outcomes of those who achieve grade D in one subject and grade C in the other are slightly weaker. This is even when compared to pupils who are otherwise very similar in terms of personal characteristics and overall attainment.
Of course, some of those who achieved grade D in either English or maths at age 16 go on to achieve it later. In our sample, 17% of those who achieved grade D in English and 15% of those who achieved grade D in maths had achieved grade C by age 17. This may well reduce slightly the differences reported here.
So it does appear that missing out on a grade C makes a difference to long-term outcomes. But perhaps the cliff between C and D isn’t that high after all?
The support of the Economic and Social Research Council is gratefully acknowledged.
![]()
Want to stay up-to-date with the latest research from FFT Education Datalab? Sign up to Datalab’s mailing list to get notifications about new blogposts, or to receive the team’s half-termly newsletter.
1. I statistically match pupils based on pupil characteristics (ethnicity, gender, first language, IDACI score, free school meals eligibility), prior attainment (standardised KS2 and KS3 scores) and school characteristics (percentage of pupils eligible for free school meals, mean KS2 score). I also match pupils on a measure of Key Stage 4 attainment, their mean grade in GCSEs. In other words, the “treatment” and “comparison” groups are broadly matched in terms of an overall measure of attainment, but they vary in English and maths grades achieved. As in other posts in this series, I use the covariate balancing propensity score method to balance the treatment and comparison groups in terms of observable characteristics.
2. The difference in achieving two or more A-Levels or equivalents is similar in magnitude to that reported by the Centre for Vocational Education Research in their analysis of a later (2012/13) cohort of pupils who just failed to achieve grade C.


Hi
Could you explain the difference in outcomes based on English and then maths when a learner achieved both at Grade C?
Hi Chris. Yes, the groups of pupils who achieve CC in English and maths are different in both tables. In essence, we reweight the full set of pupils who achieve CC so that they match (in terms of prior attainment, pupil characteristics, mean GCSE grade etc.) the group of pupils who achieve CD. Given that pupils who achieve CD in English and maths are different from each other, so too are the comparison sets of pupils who achieve CC. Hope that helps.
The assumption being made is that the grades as awarded are reliable. They are not.
Figure 12 on page 21 in a report published by Ofqual in November 2018 (https://assets.publishing.service.gov.uk/government/uploads/system/uploads/attachment_data/file/759207/Marking_consistency_metrics_-_an_update_-_FINAL64492.pdf) shows that, on average across GCSE, AS and A level, for every 100 maths scripts (that’s all varieties of maths), 96 would have the originally-awarded grades confirmed if the scripts were re-marked by a senior examiner. But for English Language, for every 100 scripts, 61 would have their grades confirmed, and 39 would be changed.
In simpler language, for maths, on average, 96% of the awarded grades are right, and 4% or wrong; for English Language, 61% are right and 39% are wrong (see also https://www.hepi.ac.uk/2019/01/15/1-school-exam-grade-in-4-is-wrong-does-this-matter/).
Those numbers are averages across the whole mark range; as explained on https://www.hepi.ac.uk/2019/02/25/1-school-exam-grade-in-4-is-wrong-thats-the-good-news/, the reliability of the grades corresponding to any specific mark depends on both the subject and the mark. And, in general, for any subject, and for any script marked close to a grade boundary, the probability of being awarded the right grade is about 50% at best. Tossing a coin would be more fair.
The upshot of all that is that the raw data is very unreliable. It may be the case that, in any year [this number] of candidates were awarded grade X. But [this number] comprises an unknown number of candidates for whom that is the right grade, plus an unknown number of candidates for whom that grade is too high, plus another unknown number for whom that grade is too low. Which makes further inferences very difficult to make. Especially when there is the possibility that a candidate who was awarded a D, but who merited a C, becomes disillusioned, and loses self-confidence. Or that a candidate awarded a C, but who should have received a D, can’t cope at the next level.
There are many reasons why exams might not be the best way of assessing the abilities of young people. But if exams are to be used, the least we should expect is that the resulting grades are reliable.
Unfortunately, they are not. In a big way.
Hi Dennis. Thanks for taking time to comment. I certainly agree that there is measurement error in the awarding of grades and this can be quite substantial in some subjects. I’m not sure that the blogpost rests on an assumption that they are reliable, however. It looks at what happens to those awarded a grade D compared to those awarded a grade C. Whether the grades are reliable or not, they still act as a signal to colleges, universities and the labour market.