This is the third post in a series looking at within-school variation. Other blogposts in the series can be found here.
This blogpost supports a new report available to schools in FFT Aspire, but may be of interest to a wider audience. Download the report for your school now.
Firstly, a quick recap. Part one of this series looked at within-school variation in Progress 8 scores, and estimated that reducing within-school variation in value added between subjects would have 10 times more impact on overall attainment when compared to moving schools below the floor standard to just above it.
Part two used value added data for individual subjects to take account of variation in the prior attainment of pupils taking each subject and also allow for national variations in subject grading. Despite taking these factors into account we still found wide variations within schools in subject performance.
We know that, nationally, value added scores can vary widely between pupils with different characteristics.
Do differences in pupil characteristics explain within-school variation?
As shown here and also here, the answer is ‘probably not’. If we use value added contextualised for pupil characteristics then we find that the differences between schools reduce, but within-school variation remains.
So what might explain this remaining variation? One factor might be the motivation of individual pupils. Contextual value added doesn’t really capture this because it looks at the impact of pupil characteristics nationally. What if a subject had a high value added score but also had a high proportion of pupils who had high value added in other subjects?
Variation between subjects
We can look at this though. What are the outcomes for the two schools we looked at in previous posts in this series? The tables below show, for each school:
- The name of the subject
- The number of pupils with contextual value added scores for that subject (data is aggregated over three years)
- CVA: The contextual value added score for that subject
- CVA: other subjects: The average of contextual value added scores for pupils taking that subject in all of their other subjects
- CVA: adjusted: Contextual value added adjusted for pupils’ contextual value added score in other subjects (i.e. CVA – CVA: other subjects)
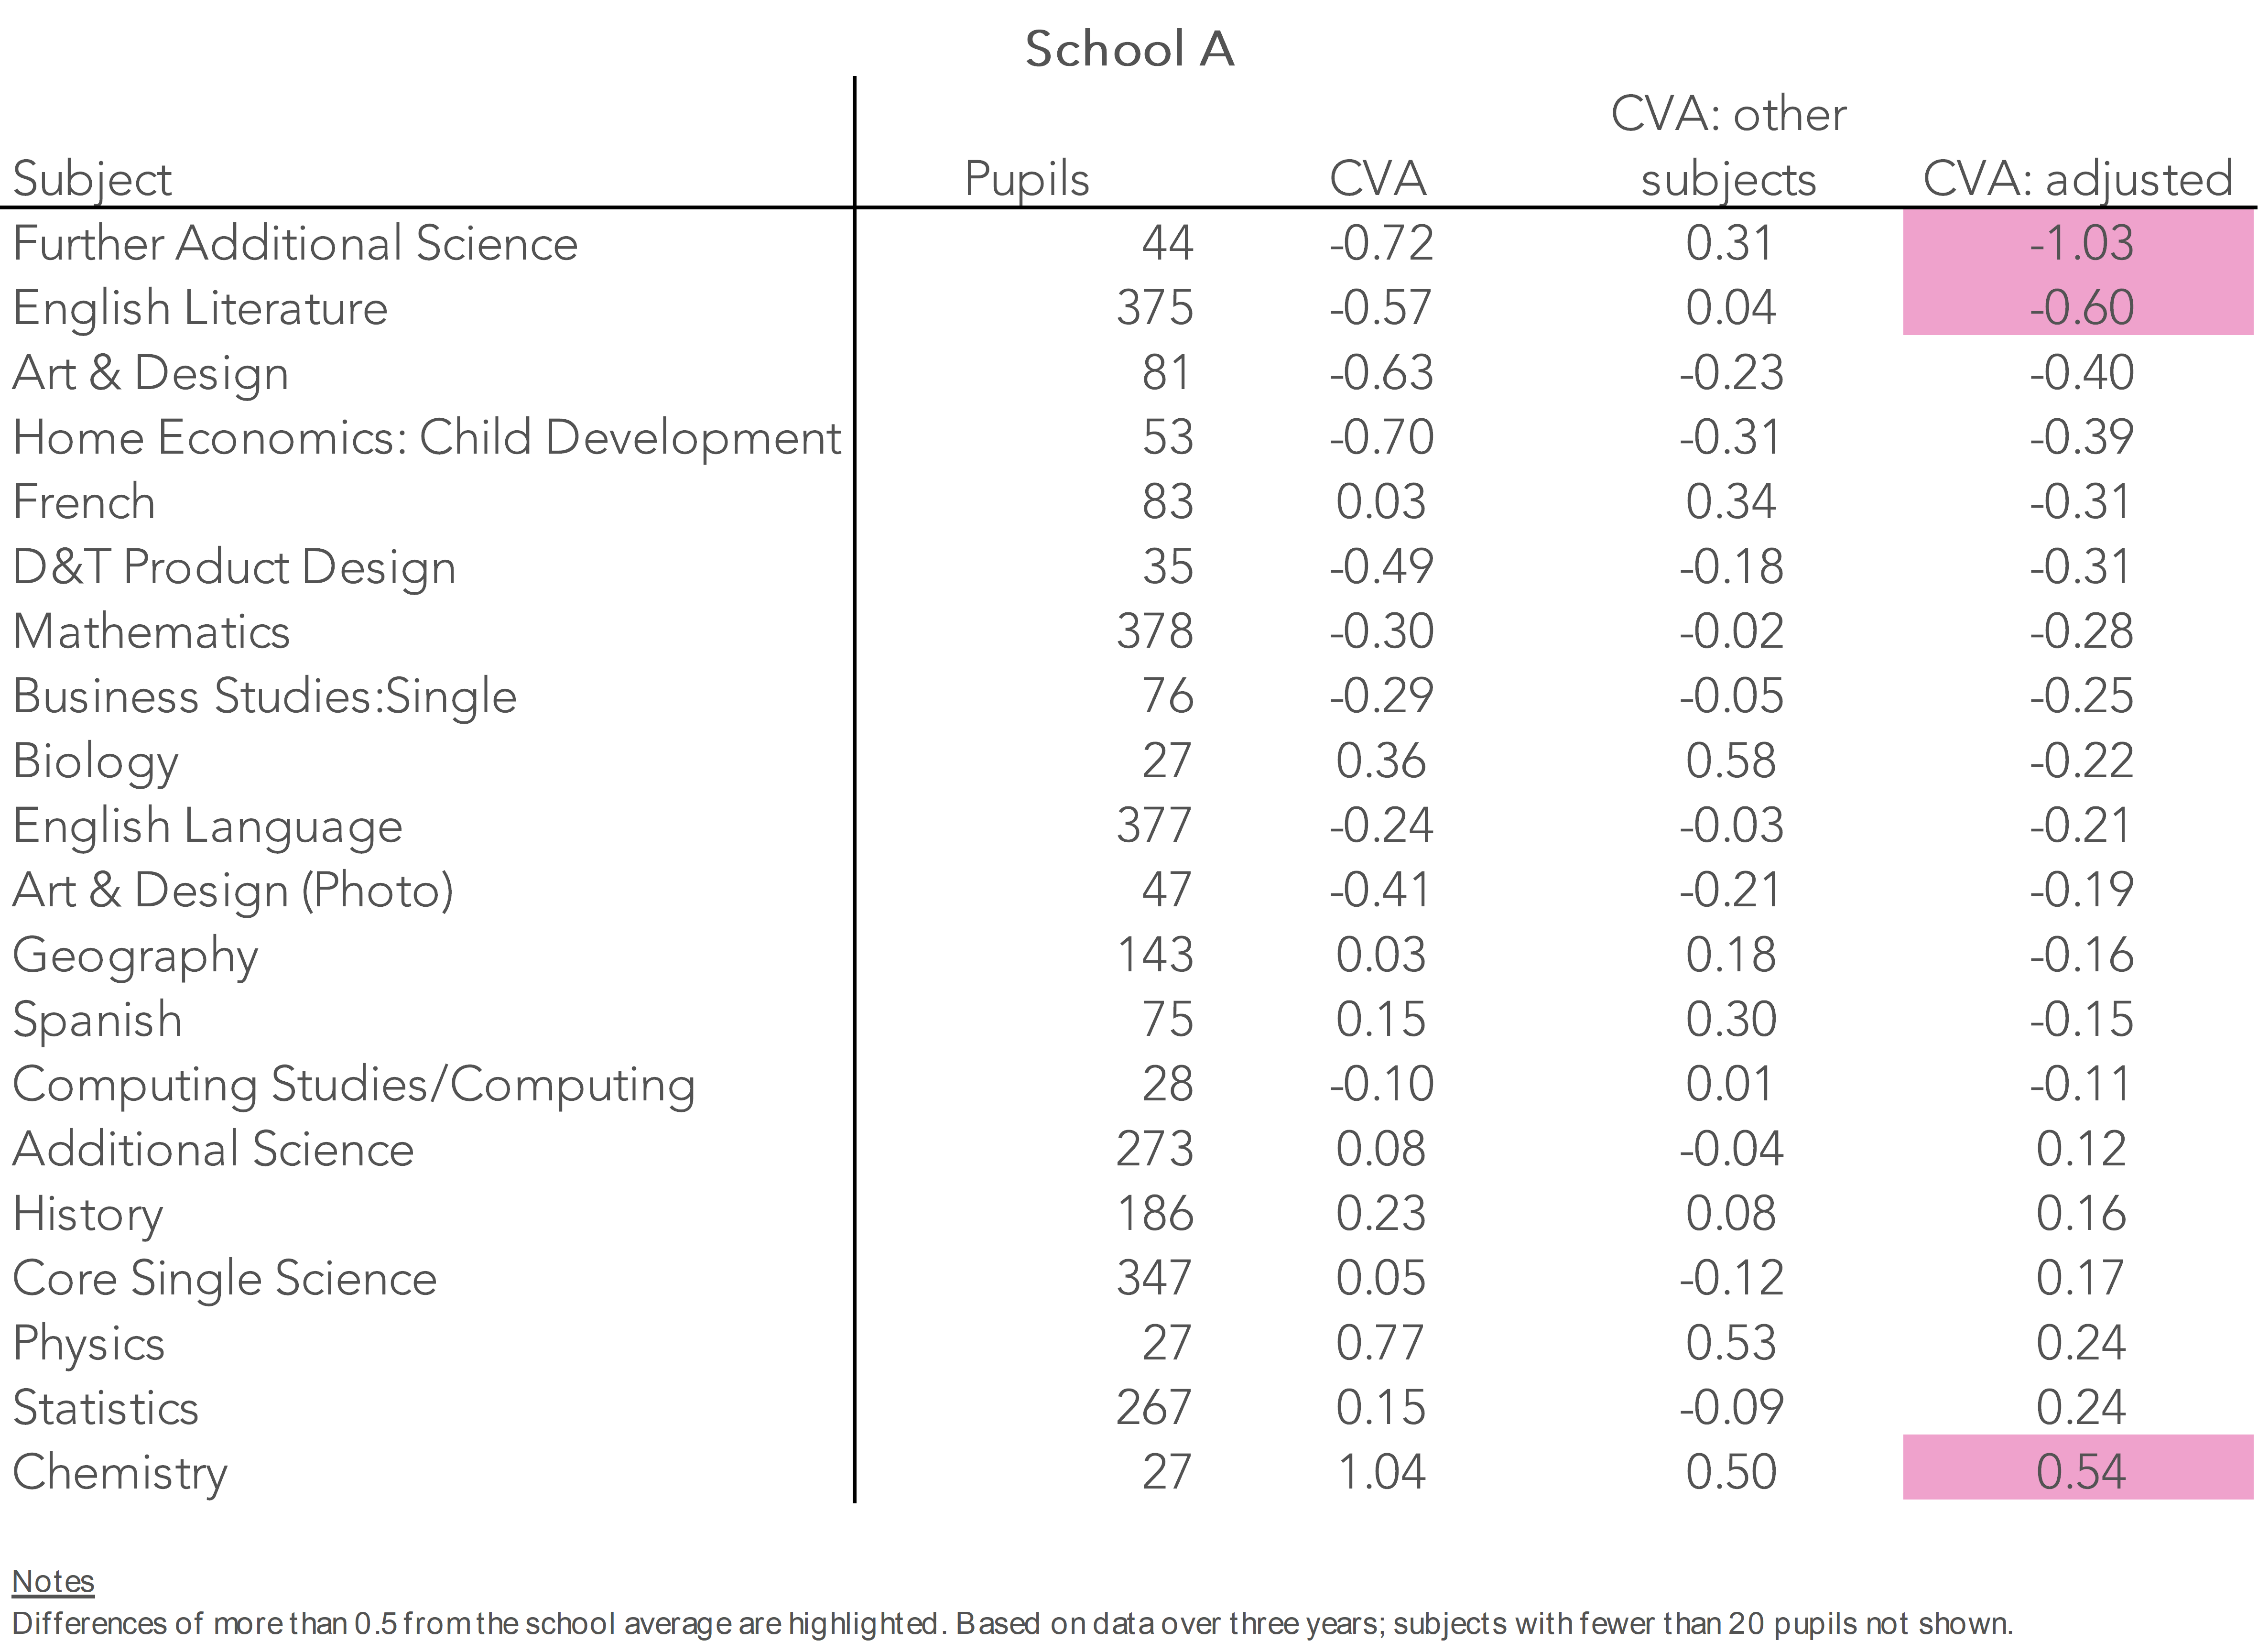

It’s interesting to see the difference that allowing for pupils’ contextual value added in other subjects can make.
For example, in School A home economics has a relatively low contextual value added score (-0.70), but pupils who take this subject have an average contextual value added score in the other subjects they take of -0.31. This means that the adjusted contextual value added score for this subject is only -0.39.
FFT Aspire users
If you are a school using FFT Aspire, download your report now.
Not an FFT Aspire user?
School A has far less variation between subjects than School B. Only three subjects (15%) have adjusted contextual value added scores which are half a grade higher or lower pupils’ grades in their other subjects. School B has 10 such subjects.
We have produced a report for FFT Aspire users to enable them to see the impact of adjusting their value added and contextual value added results in this way (see the sidebar for details of how to access this).
If we look at all secondary schools we find that the percentage of subjects where adjusted contextual value added scores differs by half a grade or more from pupils’ grades in their other subjects can vary widely – from nearly 80% of subjects to none! The chart below shows the distribution.
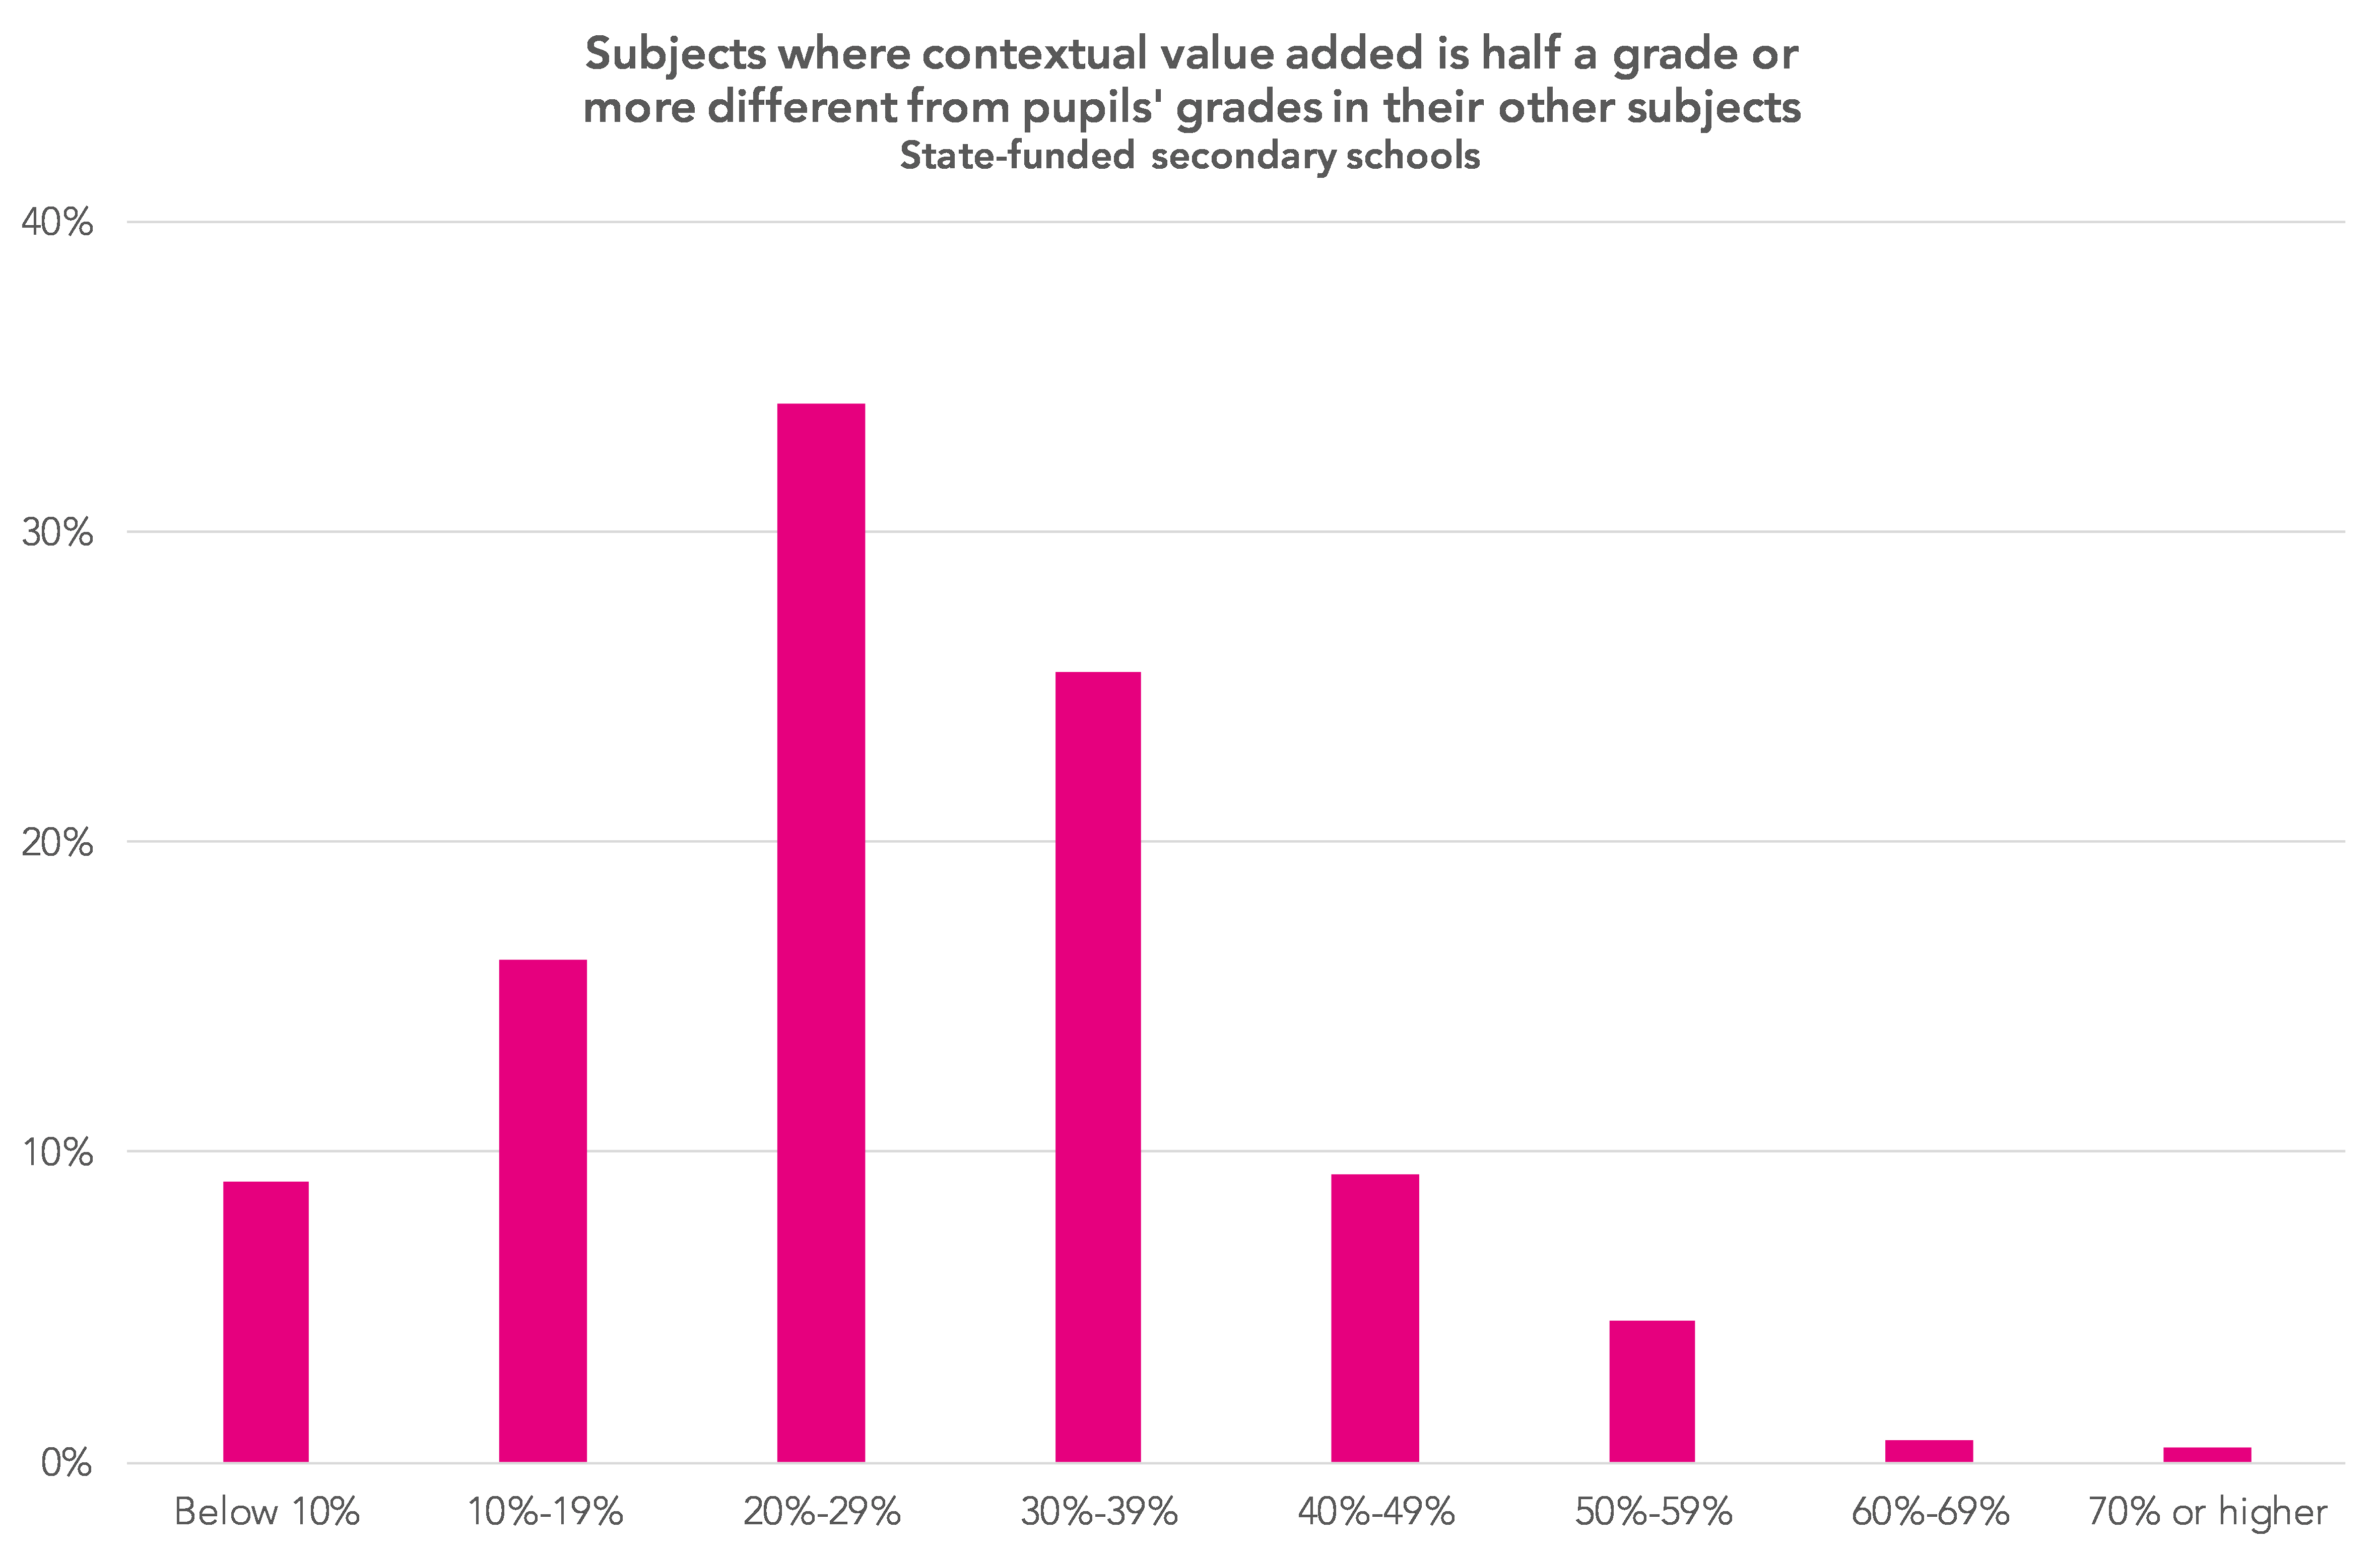
It’s important to note that some variation is the norm – with 59% of schools having between 20% and 40% of subjects where value added is half a grade above or below pupils’ grades in their other subjects.
Variation within subjects
Another area of variation is that of pupils within subjects. If we look at data across all subjects we find that around 30% of pupils have adjusted contextual value added scores which differ by one grade or more from these pupils’ grades in their other subjects. The chart below shows how this varies for different groups of subjects.
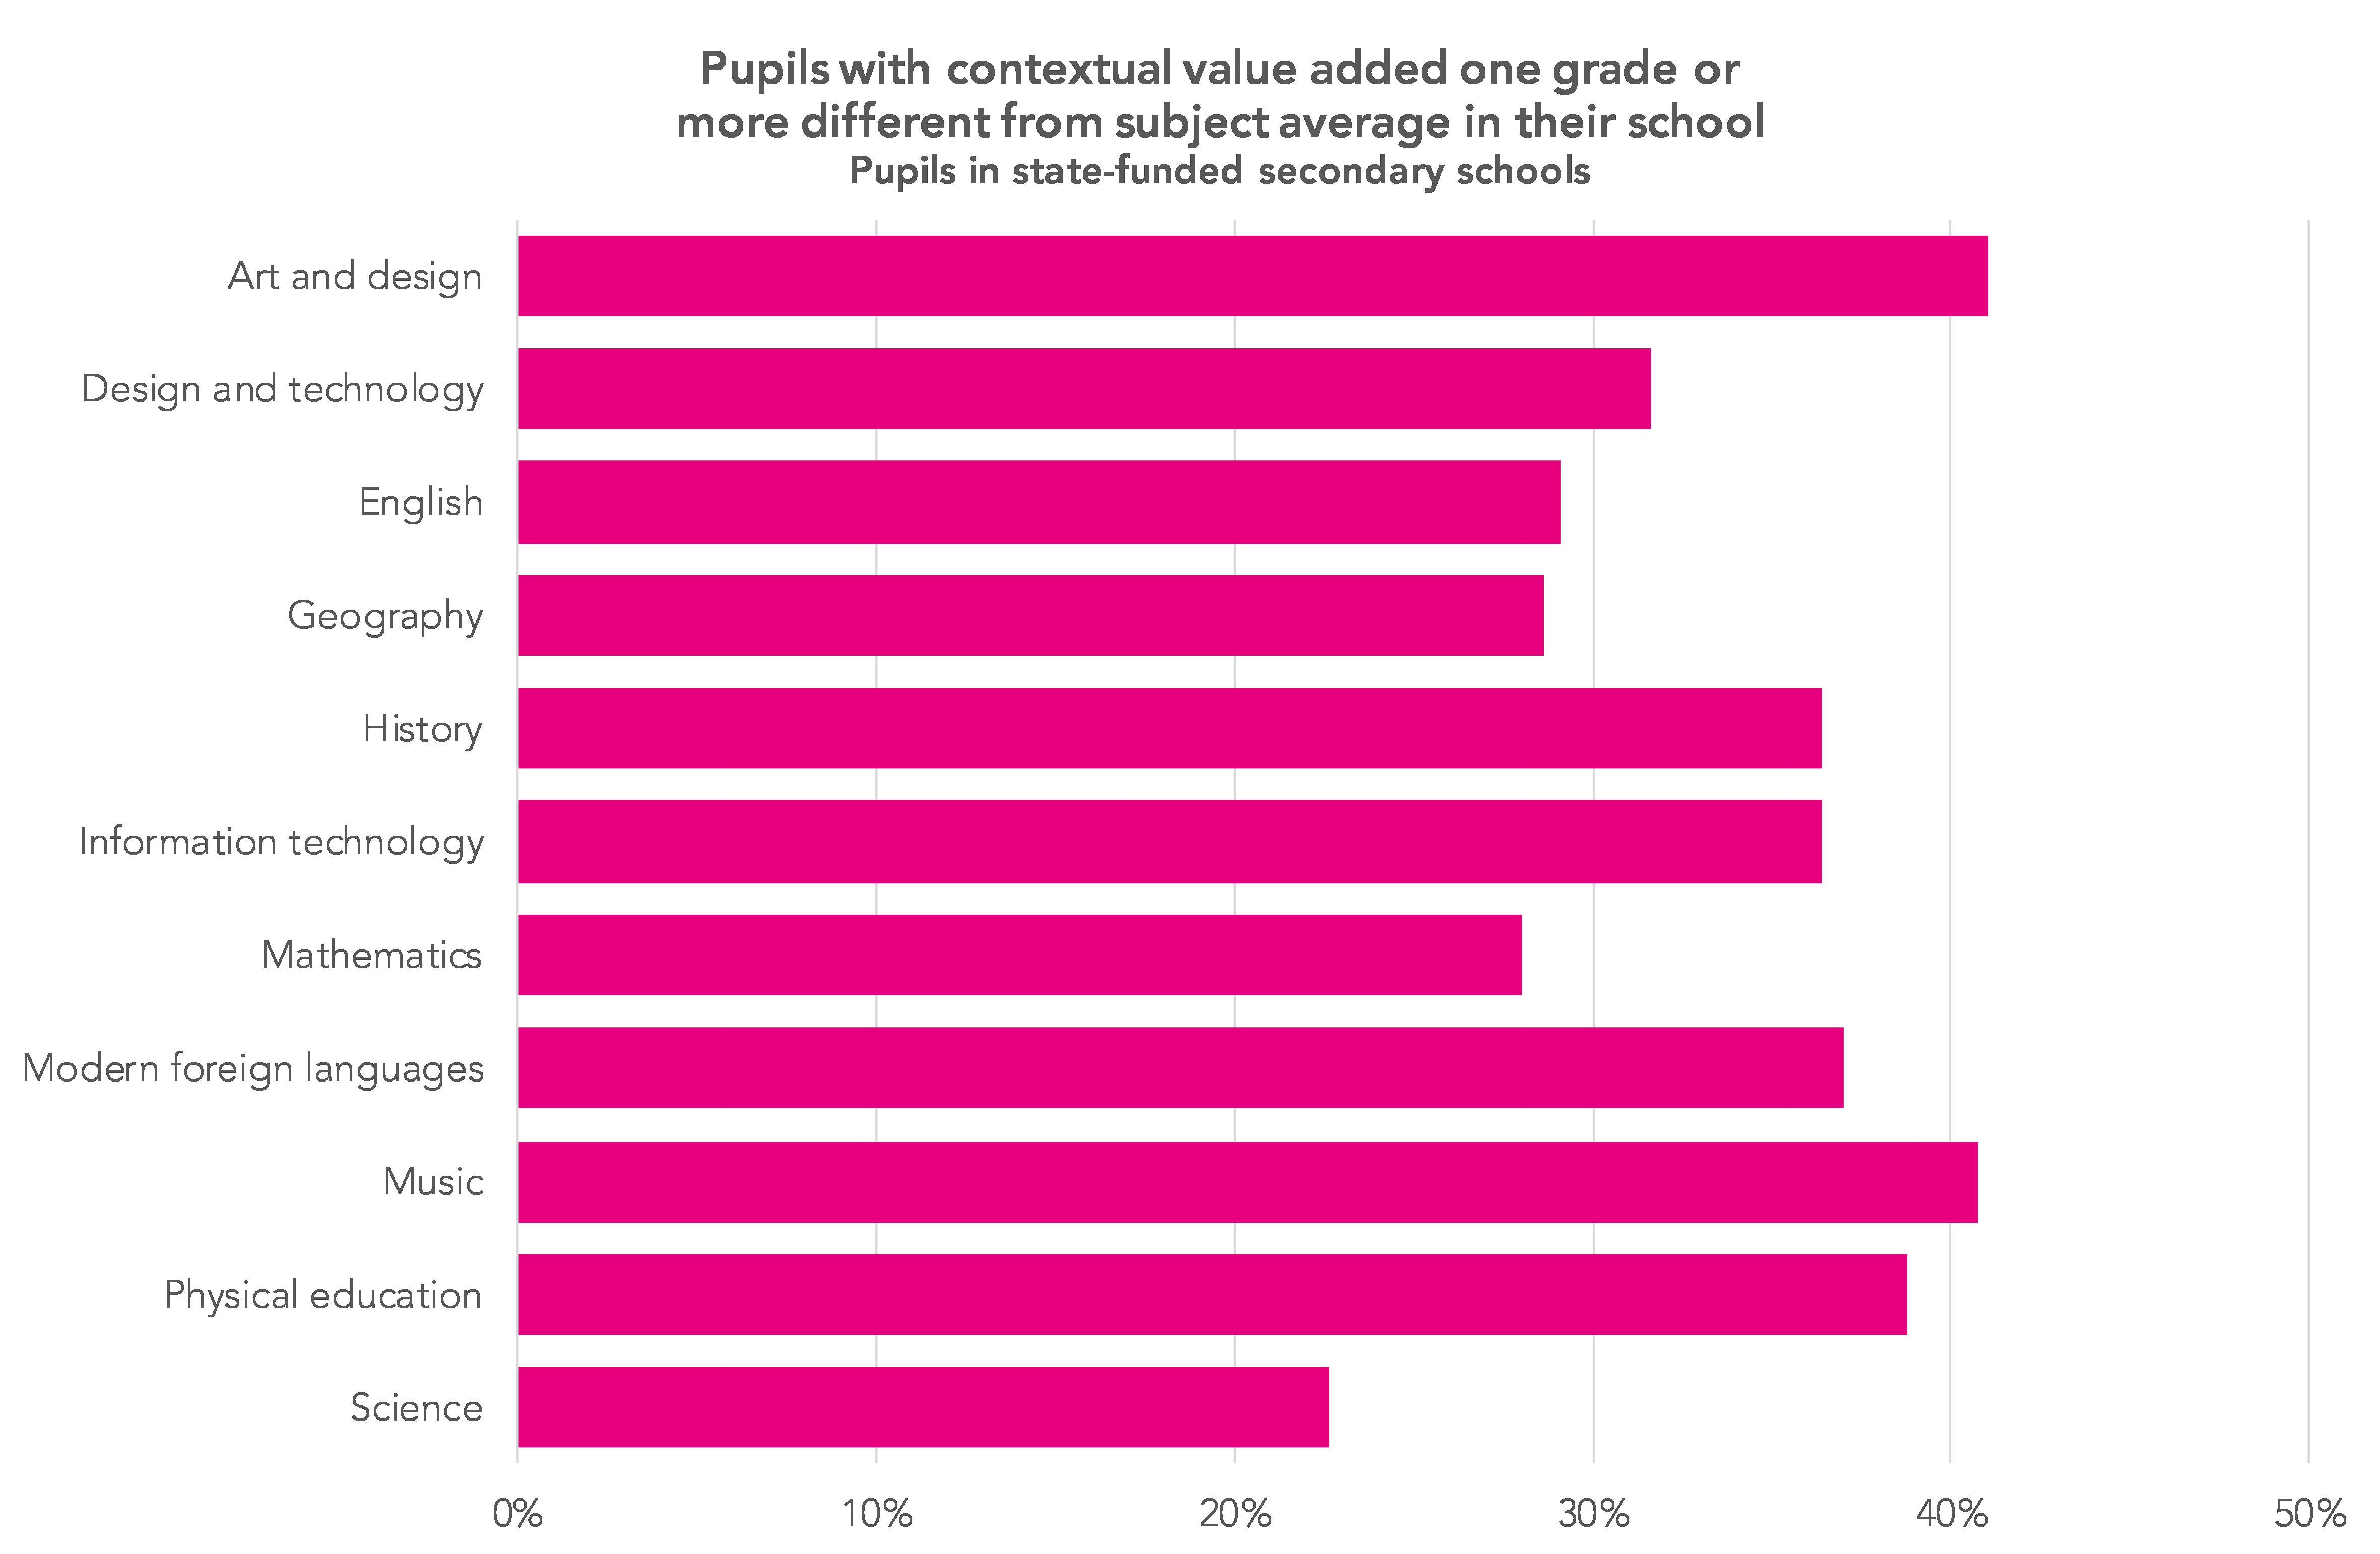
As we might expect, variation in pupil contextual value added within subjects tends to be lowest in core subjects and highest in art and design, music and drama.
Conclusions
For the sake of simplicity the analyses here have focused on contextual value added.
While contextual value added can make a substantial difference when looking at variation between schools, it makes much less difference (when compared to value added) when looking within schools. This is probably because, when looking within schools, differences in pupil factors other than prior attainment are, for most subjects, relatively small.
Overall, we can conclude that:
- Using contextual value added to take account of pupil characteristics reduces variation between schools but has only a small impact on variation between subjects within
- If we allow for pupils’ scores in other subjects this can make some important differences. While not reducing overall within-school variation much, this approach can make substantial changes to some individual subjects.
- Most schools have some variation between subject value added scores. A reasonable starting point for looking at within-school variation might be to look at subjects where overall contextual value added (or value added) scores are half a grade above or below the contextual value added (or value added) scores of the same pupils in their other subjects.
- Looking at variation within subjects can also be important. A reasonable starting point might be to look at the proportion of pupils in a subject where contextual value added (or value added) scores are one grade above or below the contextual value added (or value added) scores of the same pupils in their other subjects. When doing this it is important to take account of national variation between subjects.
Now see how things look for your school in the new report available in FFT Aspire. Download the report for your school now.
Want to stay up-to-date with the latest research from FFT Education Datalab? Sign up to Datalab’s mailing list to get notifications about new blogposts, or to receive the team’s half-termly newsletter.


Excellent, thanks for this: a CVA Relative Performance Indicator!
“Between subject variation” might be down to pupil motivation, or other selection effect, but it might be down to teaching time. That seems to be hinted at by the within subject variation?
Anyway, is there any value in knowing the national “between subject variation” for each subject? I wonder if some subjects might be regarded as more engaging for less academic pupils …. similarly if almost every pupil takes English and maths do these subjects necessarily have a lower adjusted CVA at least nationally? On the principle that academically minded pupils get similar grades in all their subjects but less academically minded pupils might get lower grades in E &/or m?