Students taking GCSEs this summer have received their results this morning, and national figures have just been published. What do they show?
Grades are up
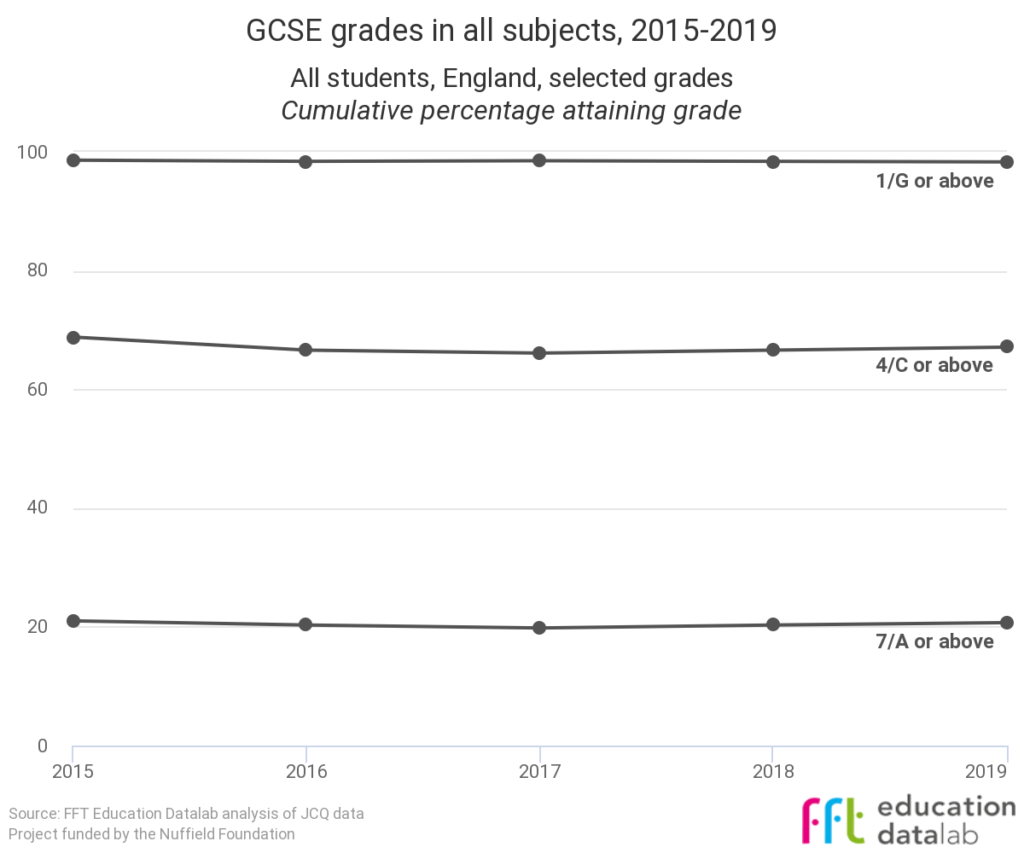
Overall grades have gone up this year.
Looking across all GCSE subjects, 20.7% of entries in England were graded 7/A or above this year, compared to 20.3% last year, while 67.1% of entries received a grade 4/C or above compared to 66.6% last year.[1]
A note on coverage
Unless otherwise stated, figures in this post relate to England only – though results for Wales and Northern Ireland are also available on our results microsite.
This continues a small increase seen last year. But we probably shouldn’t read too much into it. At the grade 7/A or above boundary the number has floated between 19.8% and 21.0% of entries since 2015. Likewise, looking at grade 4/C or above the proportions have been within the 66.1% and 68.8% range over the last five years.
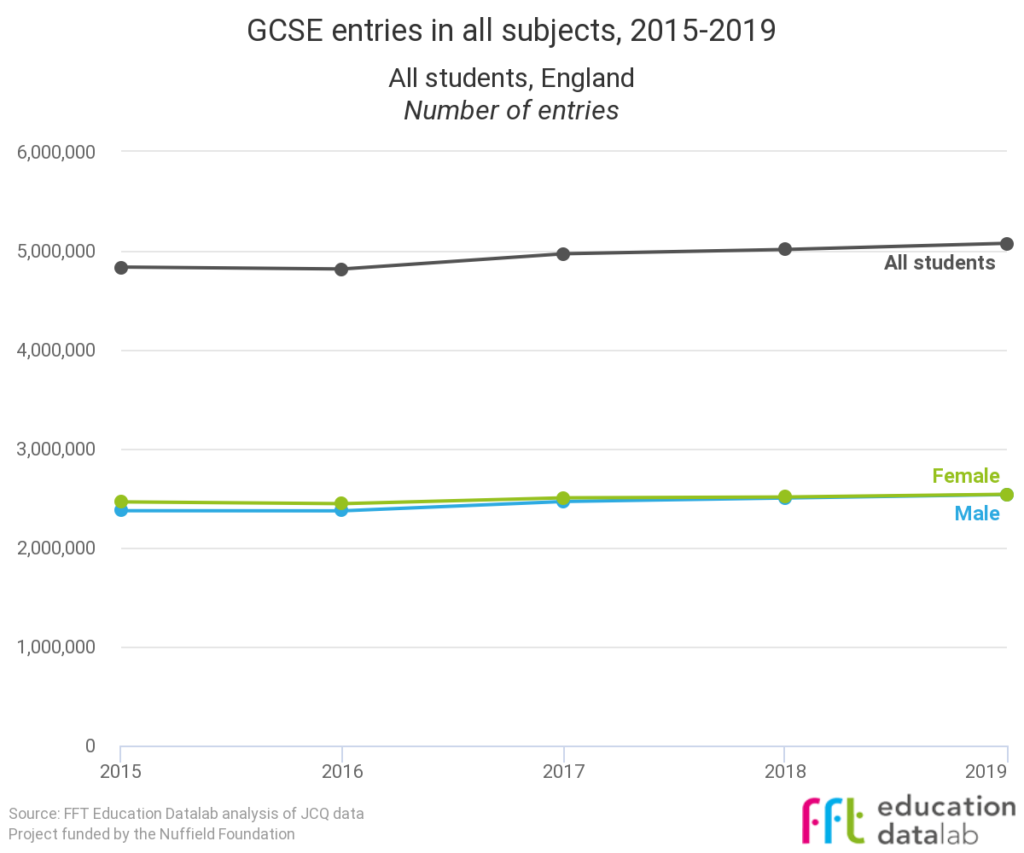
Overall, entry numbers were up 1.2%, from around 5,013,000 to 5,076,000. This is lower than the increase of somewhere between 1.5% and 2.0% in the 16-year-old population. However, as we show below, this overall figure hides interesting differences between subjects.
FFT Aspire
Schools that subscribe to FFT Aspire can use the free Key Stage 4 Early Results Service, which provides an early analysis of their results. Click here for more information.
Not an FFT Aspire user?
English and maths grades have changed a little
Looking at English language and maths – subjects that all but a very small proportion of pupils take – grades have dipped slightly at the 4/C or above threshold, but remained broadly the same at 7/A or above, as the charts below show. For interactive versions of the charts see here (English language) and here (maths).
We wrote on Monday that we didn’t think the first-time use of the national reference test would have had any discernible effect on English and maths grades, and it’s been confirmed that NRT results weren’t used to change grades awarded in either subject this year. In fact, the report of the NRT suggests some quite fundamental issues with its operation.


It’s worth breaking things out by age here, as, more than other subjects, there are large number of post-16 entries, as the charts below show.[2] (Unlike the other charts in this post, these charts show entries for the UK rather than just for England, as figures giving a breakdown by age and country are only available from 2018.)


Of those sixteen-year-olds in England taking English language, 70.5% achieved a grade 4 compared to 70.2% last summer. For those aged 17 or above, the pass rate this year was just 30.3%, versus 33.0% last year.
For maths, the equivalent figures are 71.5% for 16-year-olds (71.0% in 2018) and 21.6% for 17-year-olds (22.6%)
This is because those continuing in post-16 education who achieved a grade 3/D (specifically) in maths or English must resit the subject – multiple times, if necessary. And those retaking either subject are less likely to do well than the group of all 16-year-olds taking that subject.
So the increase in age 17 or above entries this year probably explains the overall dip in grade 4/C results that we see.
Entry numbers were up for both subjects even when we focus just on 16-year-olds – we think potentially because some independent schools are switching to GCSEs from international GCSEs, which don’t show up in these numbers.
In England, entries in English literature among 15-year-olds have also increased slightly. We wrote about the impact of early entry in this blogpost.
Explore changes in entry numbers and grades in your subject
You can explore trends in entries and grades in any subject using our results microsite – visit the site now to explore trends in your subject.
Entry rates for EBacc subjects are up
There has been an increase in entries for subjects that make up the English Baccalaureate (EBacc) this year, continuing the trend in recent years.
Overall, entries in EBacc subjects are up 3.8%, to 4,132,068, while entries in non-EBacc subjects are down 8.7%, to less than a million – 943,607. Subjects such as history, geography and computing have all recorded increases in entries. Entries into computing have increased more for girls than for boys.
There’s now a roughly 80:20 split between EBacc subjects and non-EBacc subjects, compared to a split of about 70:30 five years ago.
As we wrote on Monday, though, it’s worth digging into the numbers a bit more.
Firstly, lots of non-EBacc subjects – such as ICT, and health and social care – have newly been discontinued. Looking only at subjects that haven’t been discontinued, non-EBacc entries are only down by 1.3%.
And while some non-EBacc subjects have seen large falls drops in entries this year – design and technology down by 23.0% and PE down by 7.3% – entries into other non-EBacc subjects are up by healthy amounts, as the chart below shows. Art and design subjects are up by 9.5%, business studies by 6.1% and citizenship studies by 10.1%.
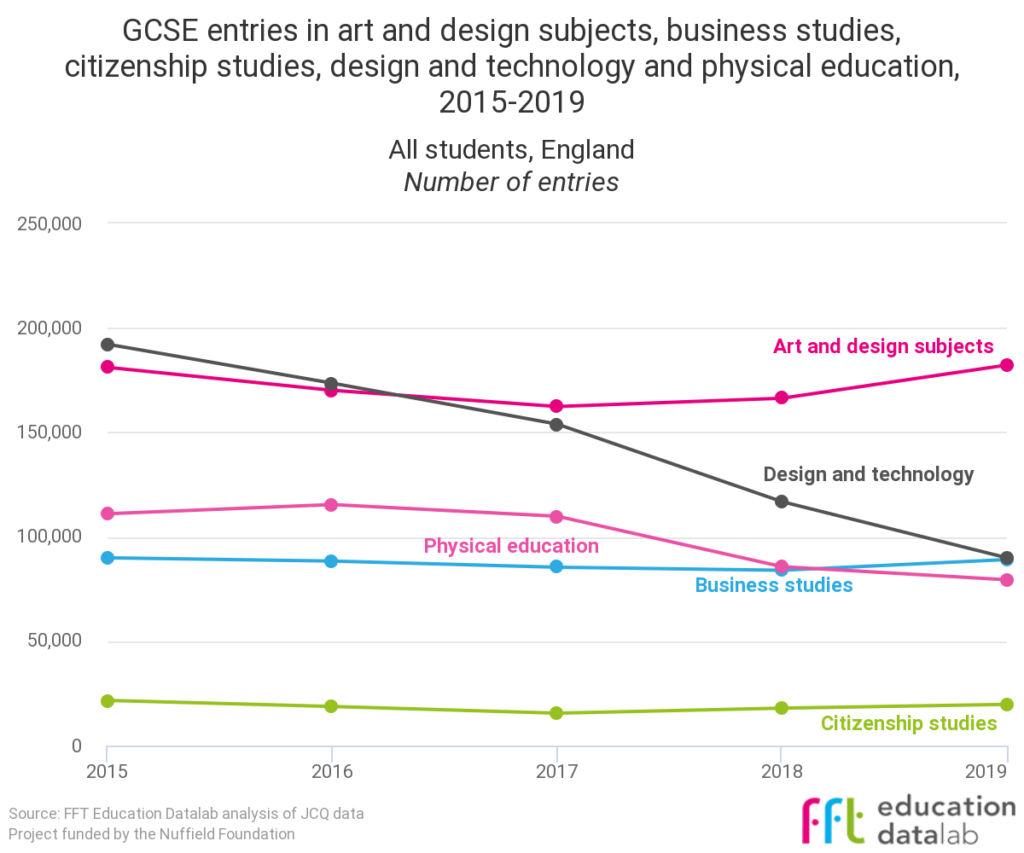
Of course, these figures do not show entries in non-GCSE qualifications. The decrease in PE may be because schools have switched to BTEC sport. We will only know this once the full set of Key Stage 4 data has been collated.
Overall, modern foreign language GCSE entries – which count in the EBacc – have also increased this year, though we think some of that is explained by independent school pupils switching to MFL GCSEs from international GCSEs, and there might not have been any real increase in the state sector once that and the increase in the pupil population are factored in. But, in pure number terms, there were a combined total of 281,448 MFL GCSE entries last year, and that went up to 291,833 this year, or 3.7%.
Entries were up by 4.1% in French and 8.1% in Spanish, down by 3.0% in German and with a 1.4% decrease in other MFL subjects, as the chart below shows.

We’ll be back with more detailed analysis of this year’s results shortly, but do take a look now at this year’s results data on our microsite, which allows you to explore trends in GCSE entries and attainment in every subject.
And sign up to our mailing list to be notified about the rest of the analysis that we’ll be publishing today.
1. These are grades at which comparison can be made between the new 9-1 grades and the old A*-G grades.
2. The jump in entries between 2016 and 2017 came as a result of a large-scale return to GCSEs when international GCSEs ceased to count in school performance measures.

Leave A Comment