
Every time PISA results are released, concerns are raised about the methodology that underpins the work.
One area that has come in for repeated criticism is how the test scores of students are actually produced, as in this article, which asked whether PISA was “fundamentally flawed”.
Such concerns were exacerbated by a seminal paper by Svend Kreiner and Karl Bang Christensen who claimed that their results indicated that using PISA to compare countries was “meaningless”.
Similar criticisms have been made by other academics to similar effect [PDF], and I too have been critical of the OECD about the complexity and opaqueness of the methodology they use to create the PISA scores.
In a paper I published late last year I looked into this issue in some detail. Specifically, does changing the PISA scaling model lead to important changes to the results?
Is the PISA methodology replicable?
The PISA scaling model uses pupils’ responses to the test questions to derive estimates of their achievement in reading, science and mathematics. It is hence the key mechanism by which countries PISA scores are created.
The first step to looking into this issue was to try and replicate the PISA scaling methodology for myself. I won’t bore you with all the nerdy gory details, but needless to say this was quite a challenge in itself.
But the results I ended up with were pretty good – the correlation between the ‘official’ mean PISA 2015 scores of a country and my replicated values was around 0.99.
This was then a good basis to address my main question of interest – what happens to these PISA results when changes to the scaling methodology are made?
Are the results stable?
In the paper, I investigate what happens to country-level comparisons of OECD countries if:
- some questions are given more weight in measuring pupils’ reading/maths/science skills than other questions (as opposed to all questions carrying equal weight);
- test questions that were not reached by pupils are excluded from the calculation of PISA scores (as opposed to being marked as incorrect);
- the difficulty of test questions is altered.
Interestingly, almost all of these technical changes very little difference to the PISA results.
The table below illustrates this point by presenting the cross-country correlations in PISA science scores with and without each of these changes being made.
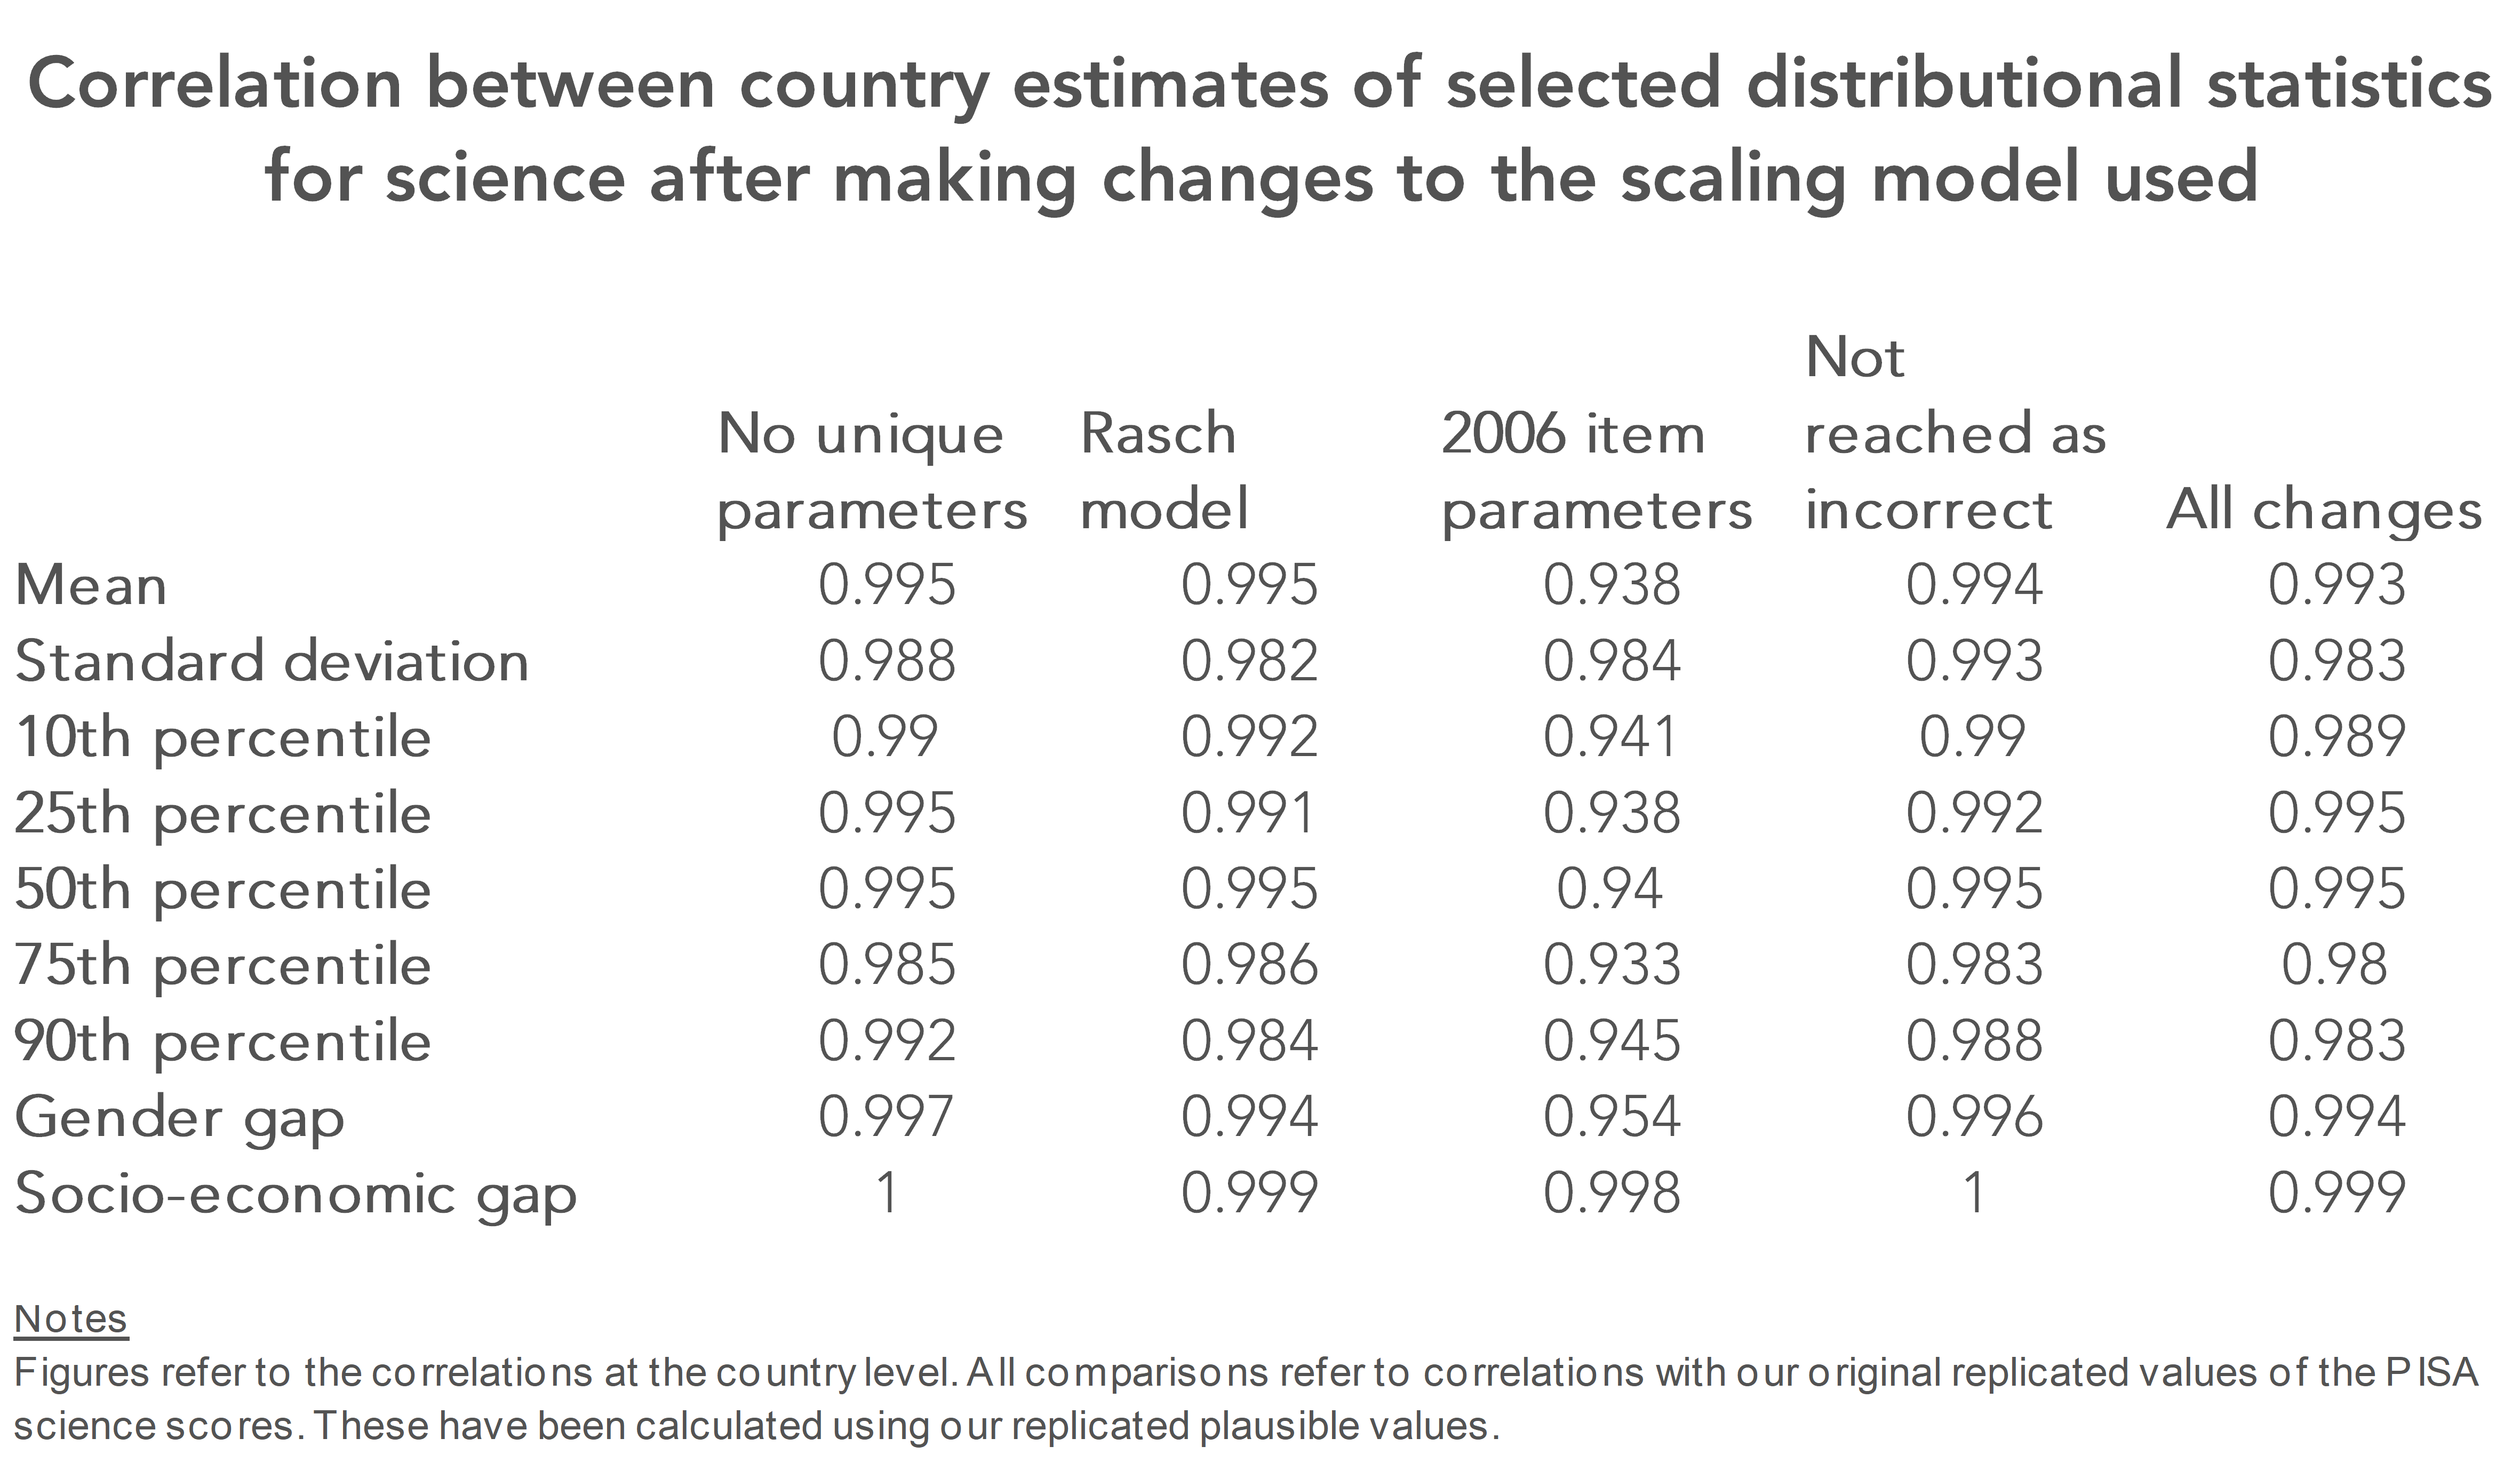
Most of these correlations are around 0.99 (not only for the mean, but for other important statistics such as estimates of gender and socio-economic gaps), suggesting that altering technical aspects of the PISA scaling model led to almost no change in country comparisons.
Take-home message
Now, none of this means that PISA is perfect. Like any study, it has both strengths and limitations. Yet it has led me to the conclusion that concerns about the PISA scaling methodology have been somewhat overblown.
Yes, the technical details could be more transparent. And I do still have some reservations about the comparability of PISA 2015 (and soon the 2018 scores) with those from PISA 2012 and before. But, the overall approach to producing the test scores seems okay, and fairly robust to some of the technical decisions made.
Hence, to those who wish to critique the PISA methodology, I would suggest that there are probably bigger fish to fry than the scaling model.
Want to stay up-to-date with the latest research from FFT Education Datalab? Sign up to Datalab’s mailing list to get notifications about new blogposts, or to receive the team’s half-termly newsletter.

“Hence, to those who wish to critique the PISA methodology, I would suggest that there are probably bigger fish to fry than the scaling model.”
There are indeed as I pointed out in my comments to a former post.
If the countries were schools that took Cognitive Ability Tests (CATs) then you would expect the schools with higher intake CATs scores to do better in PISA than those with lower scores.
CATs are a form of IQ test and we know that the children of parents that are educated to higher levels get higher CATs scores and better GCSE results so you would expect them also to do better in PISA.
The ideal would be to have CATs scores for all the international PISA cohorts, but what happens if you use national IQ data instead? The results follow a similar pattern that we see with schools, CATs and GCSE results.
If you do calculate the expected PISA scores for countries then compare them with the PISA raw scores then you do get a completely different pattern for the effectiveness of national education systems, which is the whole point of PISA
I explain this in two articles. This is the link to the second one, which llnks to the first.
https://rogertitcombelearningmatters.wordpress.com/2016/12/18/national-iqs-and-pisa-update/