There are many things that make working in a school judged as requires improvement (RI) or inadequate tough.
One is that you’ll be expected to spend more of your time with data compared to teachers at other schools. We know this because earlier this year we asked thousands of teachers detailed questions about how data is currently being used in schools on the teacher survey app, Teacher Tapp. The survey forms the basis of a report we are publishing: How is data used in schools today?.
How is data used in schools today?
To read more insights from our review of schools’ current practice around data use visit our dedicated site, where you can download a free copy of the report, ‘How is data used in schools today?’.
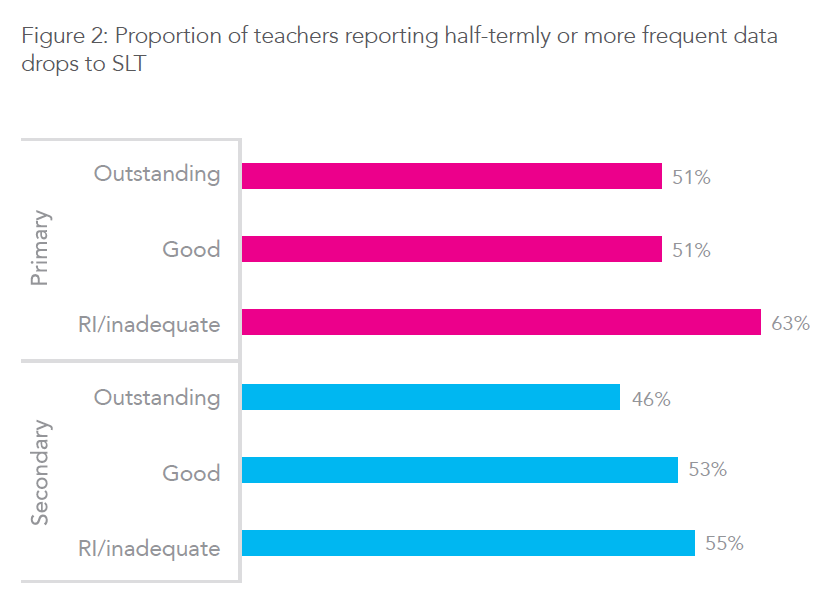
In primaries, 63% of teachers in RI/inadequate schools are required to deposit attainment data at least six times a year, versus 51% in outstanding or good primaries. There are similar, though less stark, differences across secondaries, as the chart below shows.
The type of attainment information collected by these schools also differs. For example, 70% of RI/inadequate schools make use of commercial standardised assessments during Key Stage 2, compared to just 56% of those judged as outstanding.
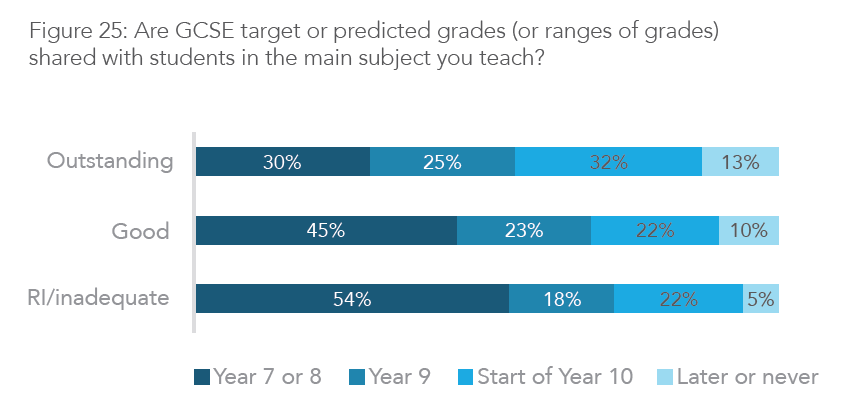
And schools judged as RI or inadequate are far more likely to be giving students target or predicted GCSE grades in Year 7 or 8 compared to good and outstanding schools, as shown in the chart below.
Which came first, the judgment or the data?
Of course, with this one-shot survey we cannot know why these schools are making greater use of data. Are they doing it because external agencies – including Ofsted, local authorities, multi-academy trusts and Regional Schools Commissioners – require it? Or alternatively, do their own senior management feel that the data policies they use are good strategies to help the school improve?
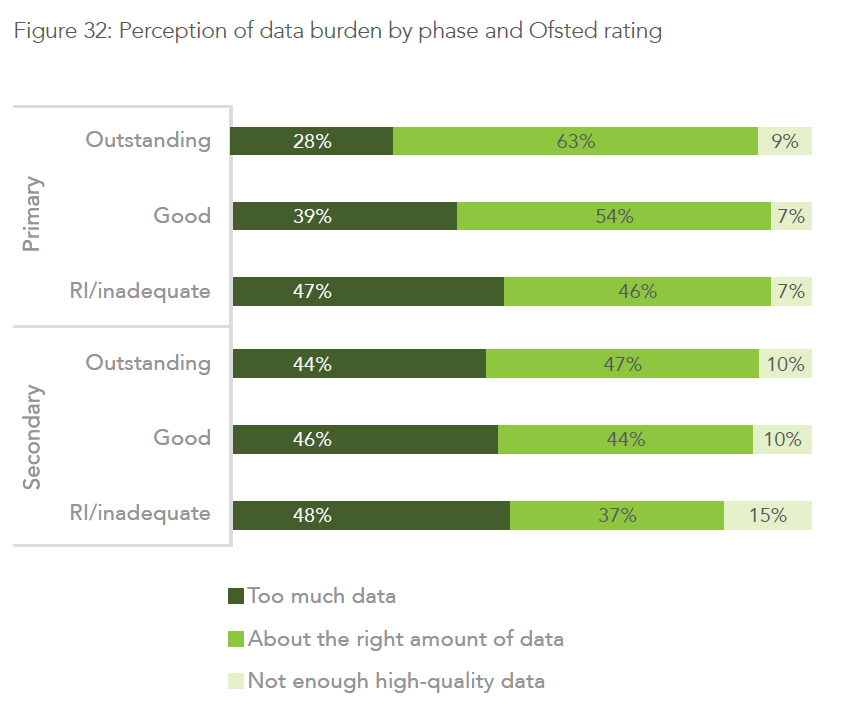
What we do know is that the teachers in these schools feel that the data collection cycle is a burden, and particularly in primaries, where 47% in RI/inadequate schools feel they have too much data, versus just 28% in outstanding schools.
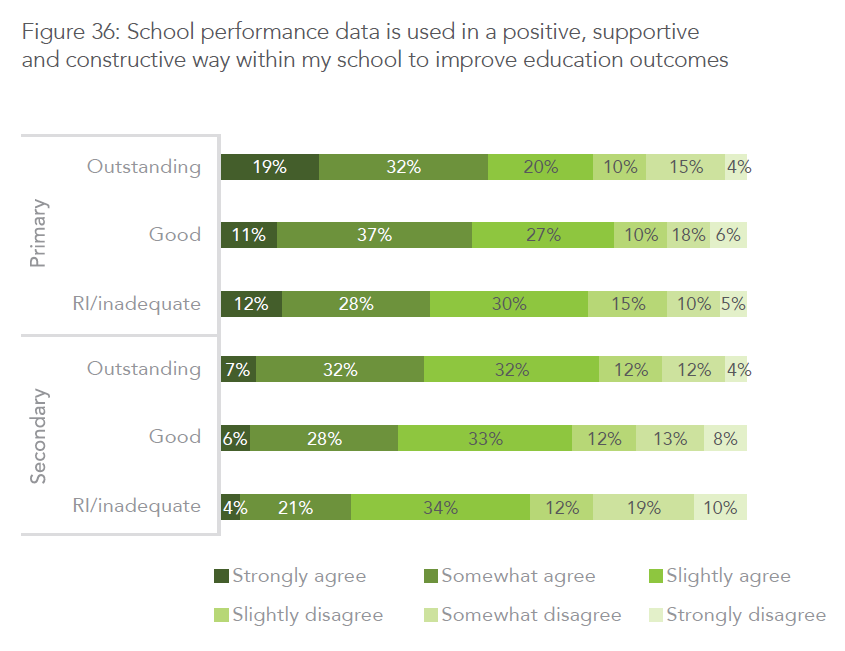
Those with poorer inspection ratings are also far less likely to say that they feel data is used in a positive, supportive and constructive way within their school, as the chart below shows.
There are many more interesting findings from this research about schools’ use of data , so visit our dedicated site to learn more and to download a copy of the report.
Want to stay up-to-date with the latest research from FFT Education Datalab? Sign up to Datalab’s mailing list to get notifications about new blogposts, or to receive the team’s half-termly newsletter.

Still, there’s some reassurance that even in the worst case group of schools (Secondary RI/inadequate), 59% of teachers agree that school performance data is used positively, even if most of them are pretty lukewarm about it.