Last week’s statistics on Key Stage 4 outcomes showed that pupils with a first language other than English – usually referred to as EAL pupils – continued to achieve higher Progress 8 scores than pupils whose first language is English.
The P8 score of EAL pupils was +0.48 compared to -0.11 for other pupils, a difference of 0.59. This is equivalent to more than half a grade per subject across the subjects counted in Progress 8.
But what is driving this difference?
To look at this, we’re going to take a look at the 2018 data.
Recent arrivals
Nationally, some 69,000 EAL pupils were counted in the P8 measure in 2018.
Some of those pupils would have been recently arrived in the country when they took their Key Stage 2 tests and so their results may not have been a fair reflection of their attainment.
Just under 10,000 of the EAL pupils first entered the system in Year 3 or later, and sure enough the average Progress 8 score of this group was very high: +1.03.
Differences between ethnic groups
Let’s leave the recent arrivals to one side and look at the EAL pupils who were first seen in a state school in Year 2 or earlier.
The average P8 score for this group was still high, at 0.39. Non-EAL pupils first enrolled in the state system in Year 2 or earlier had an average P8 score of was -0.11, meaning a difference of 0.51.
This figure compares P8 scores for EAL pupils to the average non-EAL pupil, the vast majority (85%) of whom are white British.
But what if we compared EAL pupils and other pupils from the same ethnic background? For example, comparing Pakistani pupils whose first language is English with Pakistani pupils who have a different first language.
This comparison for all major ethnic groups is shown in the chart below. The bubbles are sized according to the number of EAL pupils. The closer a bubble is to the diagonal line, the less difference there is between the P8 scores of EAL and non-EAL pupils.
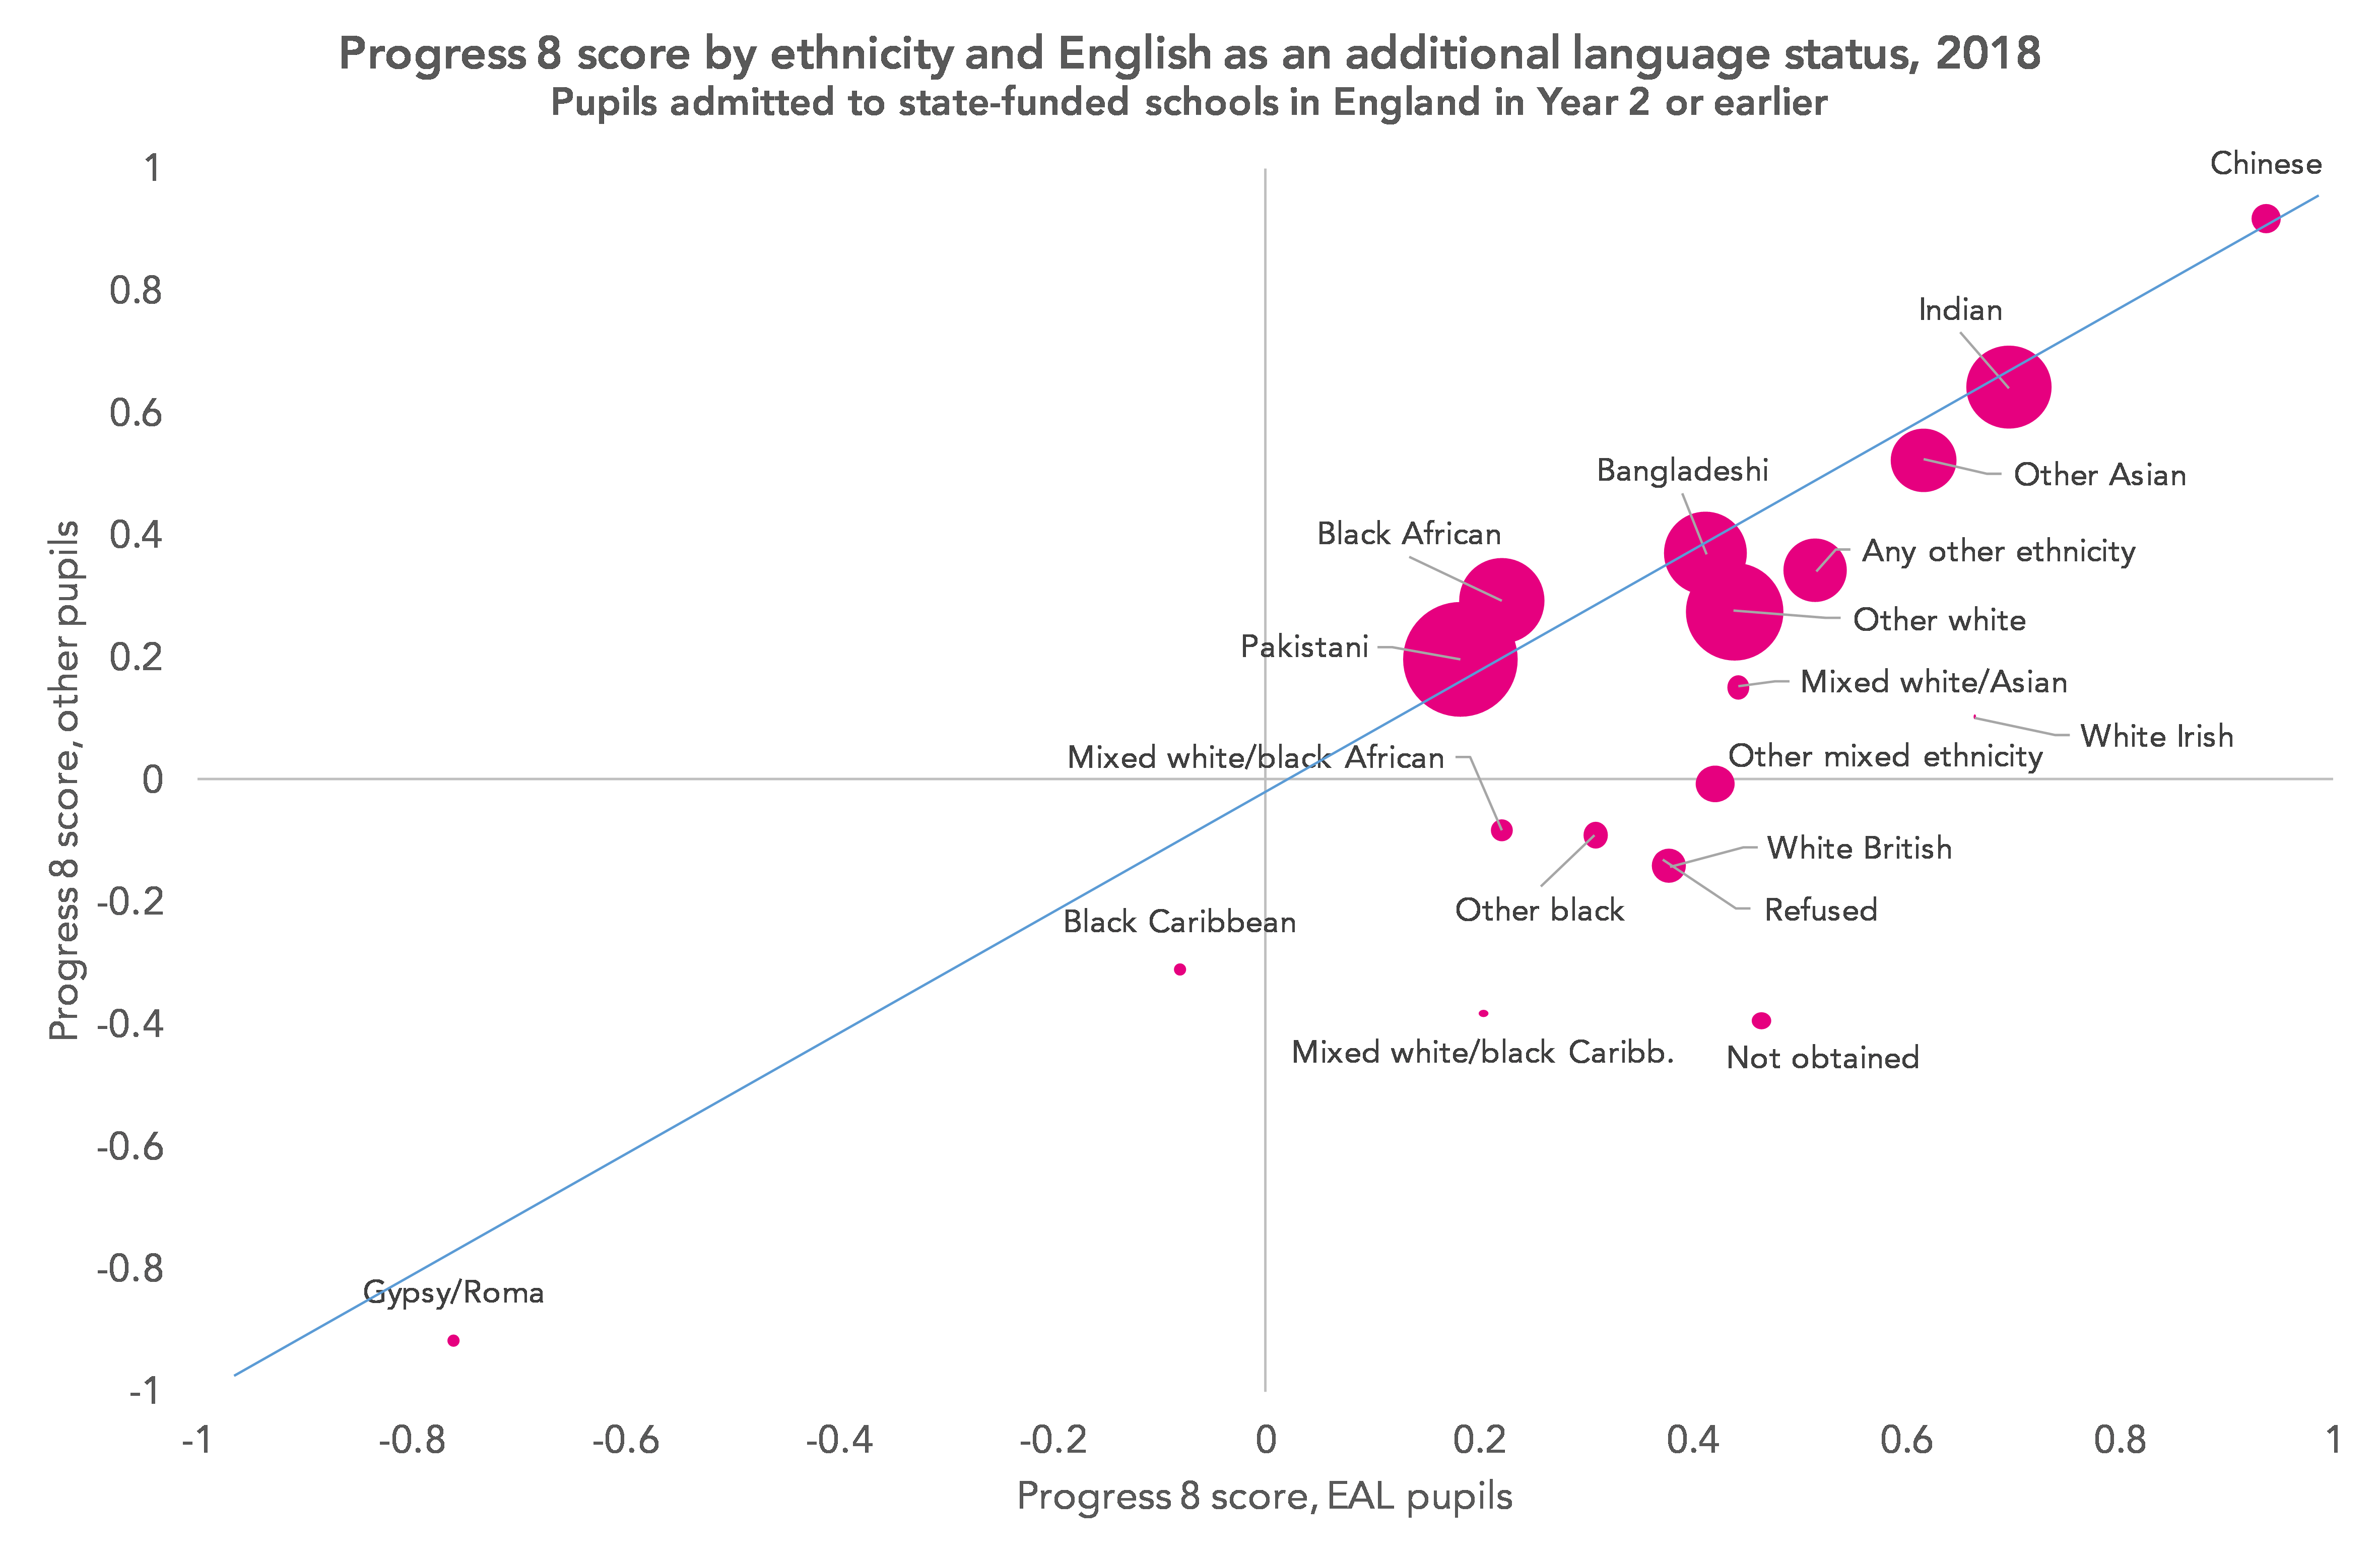
Among the groups with larger numbers of EAL pupils, the P8 scores of EAL pupils and other pupils are more similar.
We can recalculate the P8 gap by calculating the difference between EAL pupils and other pupils for each ethnic group (rather than comparing EAL pupils as a single group to non-EAL pupils as a single group). By calculating the average of these differences weighted by the number of EAL pupils in each group the P8 gap reduces from 0.51 to 0.09.
In other words, most of the EAL gap can be explained by ethnic background.
A final word about EAL pupils not included in Progress 8
Some 17,000 Year 11 EAL pupils (20%) were not counted in the Progress 8 measure due to not being assessed at Key Stage 2.
The vast majority of these appear to have arrived into the country in Year 7 or later.
There is a danger that these pupils are overlooked as they do not contribute to P8. But on the whole, albeit at a superficial level, there does not seem to be evidence of this yet.
The chart below shows average Attainment 8 scores for EAL pupils who were first admitted to a state school in England between Year 3 and Year 11. Those admitted between Year 3 and Year 6 contribute to Progress 8. Those admitted in Year 7 and later do not. The Attainment 8 scores of pupils first admitted in Year 7 are not manifestly different to those of pupils first admitted in Year 6.

Summing up
We’ve become used to the simple binary of EAL and non-EAL when looking at attainment statistics. In truth, it doesn’t really mean much. Once you remove the effect of pupils who were recently arrived when they took Key Stage 2 tests, most of the remainder is the effect of ethnicity.
The Department for Education collects data on pupils’ first languages, and reporting attainment statistics by this variable may be more illuminating. For instance, previous research has found large differences in attainment among the black African group, with Somali, Lingala and Portuguese speakers being particularly low attaining.
Many pupils classified as EAL will be fluent in English. A more useful measure may well be proficiency in English. Based on a small sample of data, other research has also found that over half of Year 11 EAL pupils were fluent.
The DfE began to collect data on proficiency in English in 2017 via the school census, though had abandoned it by the following year. Not only that, external researchers can’t request it from the DfE. Perhaps it’s time to reconsider these decisions.
Want to stay up-to-date with the latest research from FFT Education Datalab? Sign up to Datalab’s mailing list to get notifications about new blogposts, or to receive the team’s half-termly newsletter.


All good sound stuff as usual from Dave Thomson. It is more evidence of the total unfitness for purpose of Attainment 8 and Progress 8 of which there is more here that includes Tom Sherrington’s important points about statistical validity
https://rogertitcombelearningmatters.wordpress.com/2016/10/27/more-problems-with-progress-8/
Thanks Roger. Yes, I agree that P8 isn’t a valid measure of school effectiveness. I still think it is a helpful performance indicator nonetheless, or would be if the stakes surrounding it were dialled down a few notches.
You’re right that EAL and not EAL is probably not a very helpful binary distinction and I think it would be very helpful if the DfE published outcomes by first language. However, I am not sure I buy the idea of large numbers of Pakistani pupils whose first language is English. The census guides says, “A first language other than English should be recorded where a child was exposed to the language during early development and continues to be exposed to this language in the home or in the community. If a child was exposed to more than one language (which may include English) during early development the language other than English should be recorded, irrespective of the child’s proficiency in English.” That does capture the complexity of many Pakistani households., where it is normal to encounter Urdu, Punjabi, Hindi (for films), Arabic (for religion) and English. First language is a concept that does not work always very well for children brought up in multilingual households. We can argue about what P8 scores mean, but they do seem consistent with large scale research (Collier/Thomas, for instance).
Thanks Graham- good contribution. Around a third of the Pakistani pupils included in the analysis were classified as having English as a first language. There’s bound to be some incorrect recording- question is how much. I wonder if some families are reluctant to have a first language other than English recorded?
Another way of looking at EAL pupils is through the prism of bilingualism, into which a great deal of research has been carried out, much of which is inconclusive on a macro scale – few truths emerge from large aggregated data sets. However, Erika Hoff has done good longitudinal research into bilingualism that identifies the quality of language (measured by years of education, in particular HE) spoken by the mother as an important driver of minority language proficiency. This is not PC – but allows other hypotheses as to why children go on to develop high levels of language proficiency. It’s all about quality of exposure, given there is the minimum necessary quantity.