Two economists, Rich Murphy and Felix Weinhardt, have just published some very interesting research on how the rank position of pupils within their class at primary school has a persistent effect on later outcomes.
Put another way, take two pupils who achieved the exact same scores in Key Stage 2 tests. Pupil A was the top performer in her class, but Pupil B was middle-ranked in hers. Even though their measured attainment is the same, Pupil A is more likely to achieve better outcomes at Key Stage 4.
The report is very thorough. In fact, it looks as if it took the authors 11 years from inception to completion. They try to find other explanations for their finding but it seems to hold up to scrutiny.
In this blogpost, I’m going to show a more up-to-date example of this effect in practice albeit in a more slapdash fashion.
This analysis is based on the cohort of pupils who were assessed at Key Stage 2 in 2013. We rank pupils at each primary school according to their average test result in reading and maths. We do this for schools with at least 10 pupils. We work out the percentile rank of each pupil at their school.
We then link this Key Stage 2 data to Key Stage 4 outcomes from 2018. As we’ll be looking at Progress 8, we only include pupils at state-funded mainstream secondary schools.
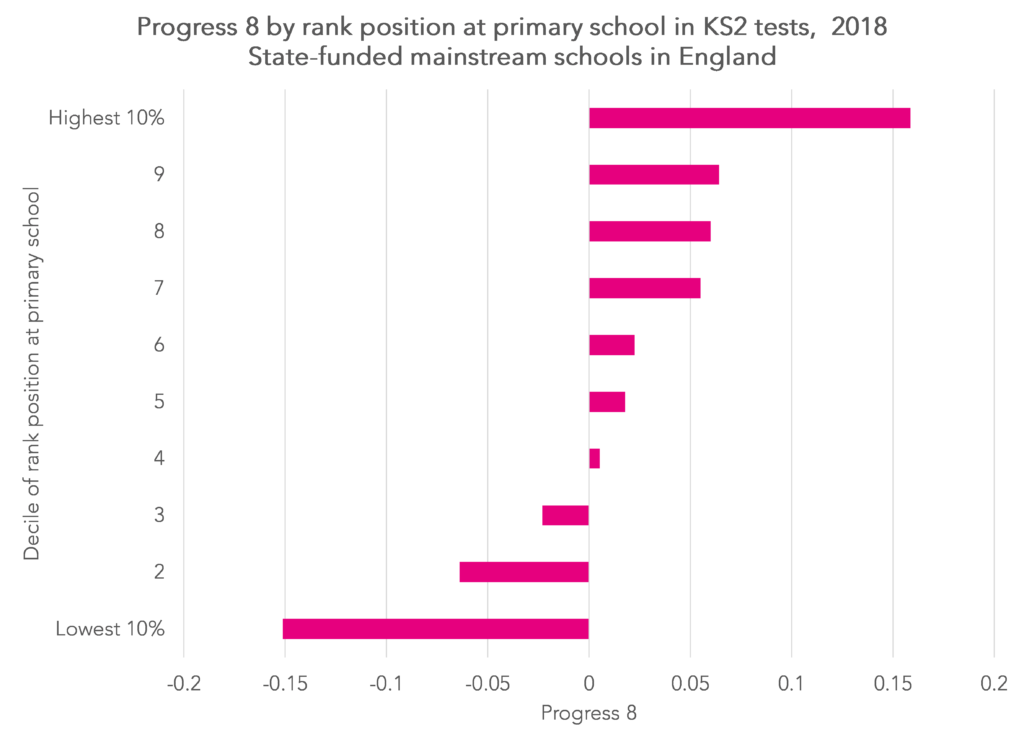
The chart below shows that pupils in the top 10% of pupils for end of Key Stage 2 attainment at their primary school achieve P8 score points 0.16 higher (16% of a grade per subject) than other pupils with equivalent prior attainment.
By contrast, pupils in the lowest 10% of attainers at their primary school tend to achieve lower P8 scores by a similar margin.
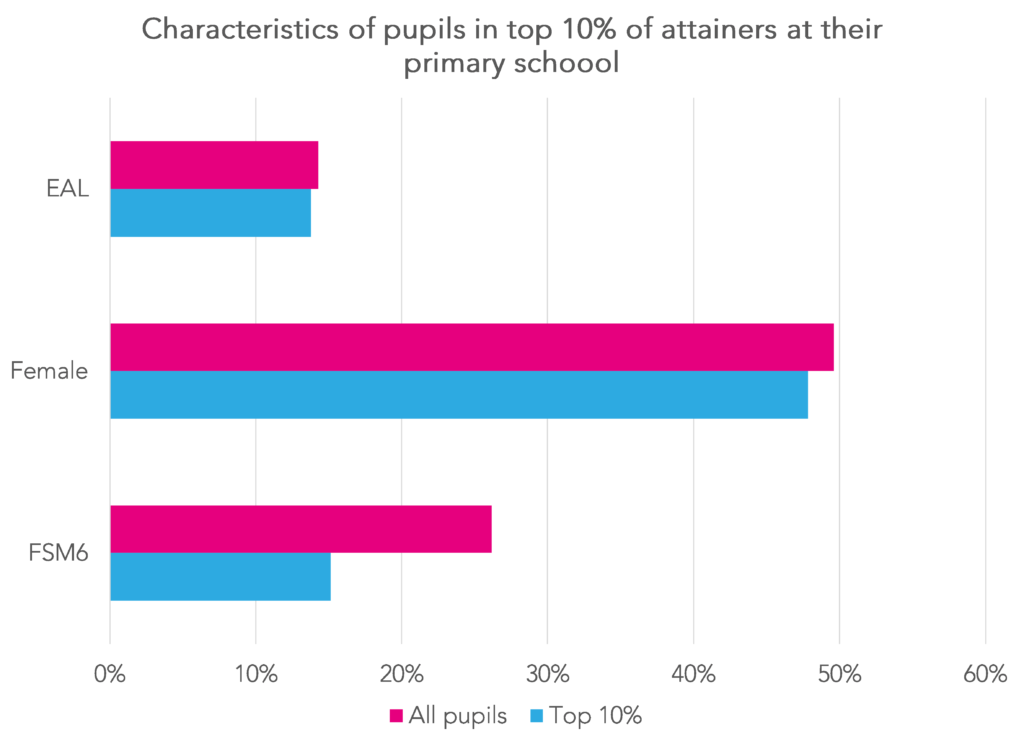
As you might expect, disadvantaged pupils are less likely than other pupils to be amongst the top 10% of attainers at their primary school. However, the percentage of girls/boys and EAL/not EAL pupils in the top 10% is broadly in line with the population.
In fact, the effect of being among the highest attainers at primary school may be even larger than the first chart suggests.
To incorporate the effects of pupil background characteristics, I ran a statistical matching exercise. I started with the pupils who were in the top 10% of attainers at their primary school. I then looked for statistical matches amongst pupils who were in the middle 20% of attainers at their primary school. I ran a propensity score match with exact matching on Key Stage 2 fine grade, gender, region and EAL and non-exact matching on ethnic background, disadvantage (percentage of school career in receipt of free school meals and IDACI score) and SEN at primary school.
I found unique matches for 7,000 out of the 43,000 top 10% attainers using nearest neighbour matching without replacement. More matches could be found using less restrictive matching criteria but I’ve deliberately chosen to use only very close matches here.
The top 10% group was very high attaining at the end of primary school and at the end of secondary school. Their average Key Stage 2 fine grade was 5.38 and their average Attainment 8 score was 62.9.
By contrast, the pupils in the matched group had the same average Key Stage 2 fine grade by design, but their average Attainment 8 score was lower at 56.9. This is a difference of 6 points; more than half a grade per subject.
In fact, it is bigger than the disadvantage gap in Progress 8 scores. Remember that the two groups are statistically similar, at least in terms of observed characteristics.
However, some of the gap could be due to differences in attainment not captured by the prior attainment measure used in Progress 8, which is what I’ve used in the analysis up to this point. This doesn’t include results from optional Level 6 tests nor data from the GPS test or teacher assessments. And, of course, it doesn’t include any information on attainment in subjects other than English and maths.
To test this, I’ve repeated the analysis including Level 6 test results and mean teacher assessment level in the matching routine. As I’ve used more restrictive matching criteria, the size of the matched sample falls accordingly from 7,000 to 4,000. However, the difference between the two groups also narrows to 2 points: 60.6 for the top 10% compared to 58.7 for the middle 20% based. But there still appears to be an effect of 0.2 points per subject in favour of pupils who were ranked higher at primary school.
This raises all sorts of questions firstly about why this happens. Murphy and Weinhardt consider a number of potential mechanisms and seem to suggest it’s most likely to do with confidence or non-cognitive skills more generally.
There could be implications also for the ways schools work arising from this. For example, in setting. Could teaching improve if schools knew about pupils’ rank positions at primary school as well as their level of attainment?
Want to stay up-to-date with the latest research from FFT Education Datalab? Sign up to Datalab’s mailing list to get notifications about new blogposts, or to receive the team’s half-termly newsletter.




Does this imply that selective schools benefit those who do NOT attend them? The bright kids in the middle range of a selective independent school/grammar v. those equally bright kids who missed out but are the most able of those who remain in comprehensive schools.
I’d have to look at it really. In general, you find that selective schools lead to slightly better outcomes for those who get in offset by slightly worse outcomes for those who don’t. Can’t quite get my head round what the effect of rank would be on the net contribution to those differences.
On the selective schools questions – I’d imagine that any negative impact of being lower in the class rank compared to an equal attainer ranked higher in their non-selective school class is at least partly offset by the positive reinforcement both of passing the exams to get into the selective school in the first place (meaning that the pupil is more aware of their overall rank nationally), and also by the messages given to pupils in that selective school “you’re in the top 1% of the country just coming here” “pupils at this school are the top attainers in the country” and so on. How you’d measure that quantitatively I don’t know!
Is there any scope for looking at the outcomes for the top 10% at primary, but narrowing the cohort to those who attend non-selective secondary schools (in areas where there is no option for selection, rather than in areas where grammar schools are an option)?
I’m wondering whether, as a previous poster has said, the positive reinforcement given to students attending selective schools and the expectations of teachers in those schools make more of a difference, or if the effect is seen as strongly in comprehensive schools.