Last week, Ofqual published the response to its consultation on awarding and standardising centre-assessed grades this summer.
One of the regulator’s decisions was that it has “decided to adopt [its] proposal that the trajectory of centres’ results should not be included in the statistical standardisation process.”
This is because trajectories are hard to identify using the data that would be available to Ofqual. This is especially so if Ofqual is limiting itself to the years for which reformed GCSEs and A-Levels were available. In some subjects, there is just a single year of data.
In this blogpost, I’m going to try and look at trajectories in recent GCSE maths attainment to demonstrate the issue. This should probably be the easiest subject in which to assess year-on-year variability – there’s three years of data, large numbers of pupils take it, and there’s less measurement error in the grades awarded.
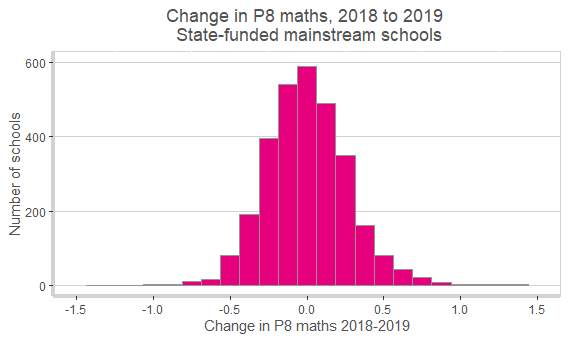
Normally, when Ofqual looks at centre variability, it looks at percentages of pupils achieving a certain grade or higher (e.g. 4+). However, here I’m going to look at average point score – so a point corresponds to a grade. The chart below shows the change in this measure between 2018 and 2019 for state-funded mainstream schools.

Over 700 schools (23%) improved by more than 0.25 points, equivalent to one grade in every four being higher in 2019 compared to 2018. The average point score fell by the same margin at 600 schools (20% of the total).
Previous Ofqual research suggests that some of this change is due to changes in ability, and some due to chance. When Ofqual looks at ability, it tends to do it in two ways, firstly based on prior attainment and secondly based on concurrent ability (i.e. mean GCSE grade). The latter comes with some problems because it doesn’t detect general school improvement affecting results in maths.
The chart below shows differences in Progress 8 maths scores between 2018 and 2019 for the same schools as before. This strips out the effect of changes in prior attainment from the first chart.
The bars are now less spread out, but there are still some schools which improve or deteriorate by a large amount. The percentage whose scores change by more than 0.25 (either up or down) is broadly similar (16% in each direction).
But are there any clues as to which might have gone up or gone down this year if there were still exams?
Well, for starters, those with high P8 maths scores last year will tend to fall and those with low scores last year will tend to improve. The chart below shows P8 maths scores for 2018 on the horizontal axis and the 2018-2019 change on the vertical axis.
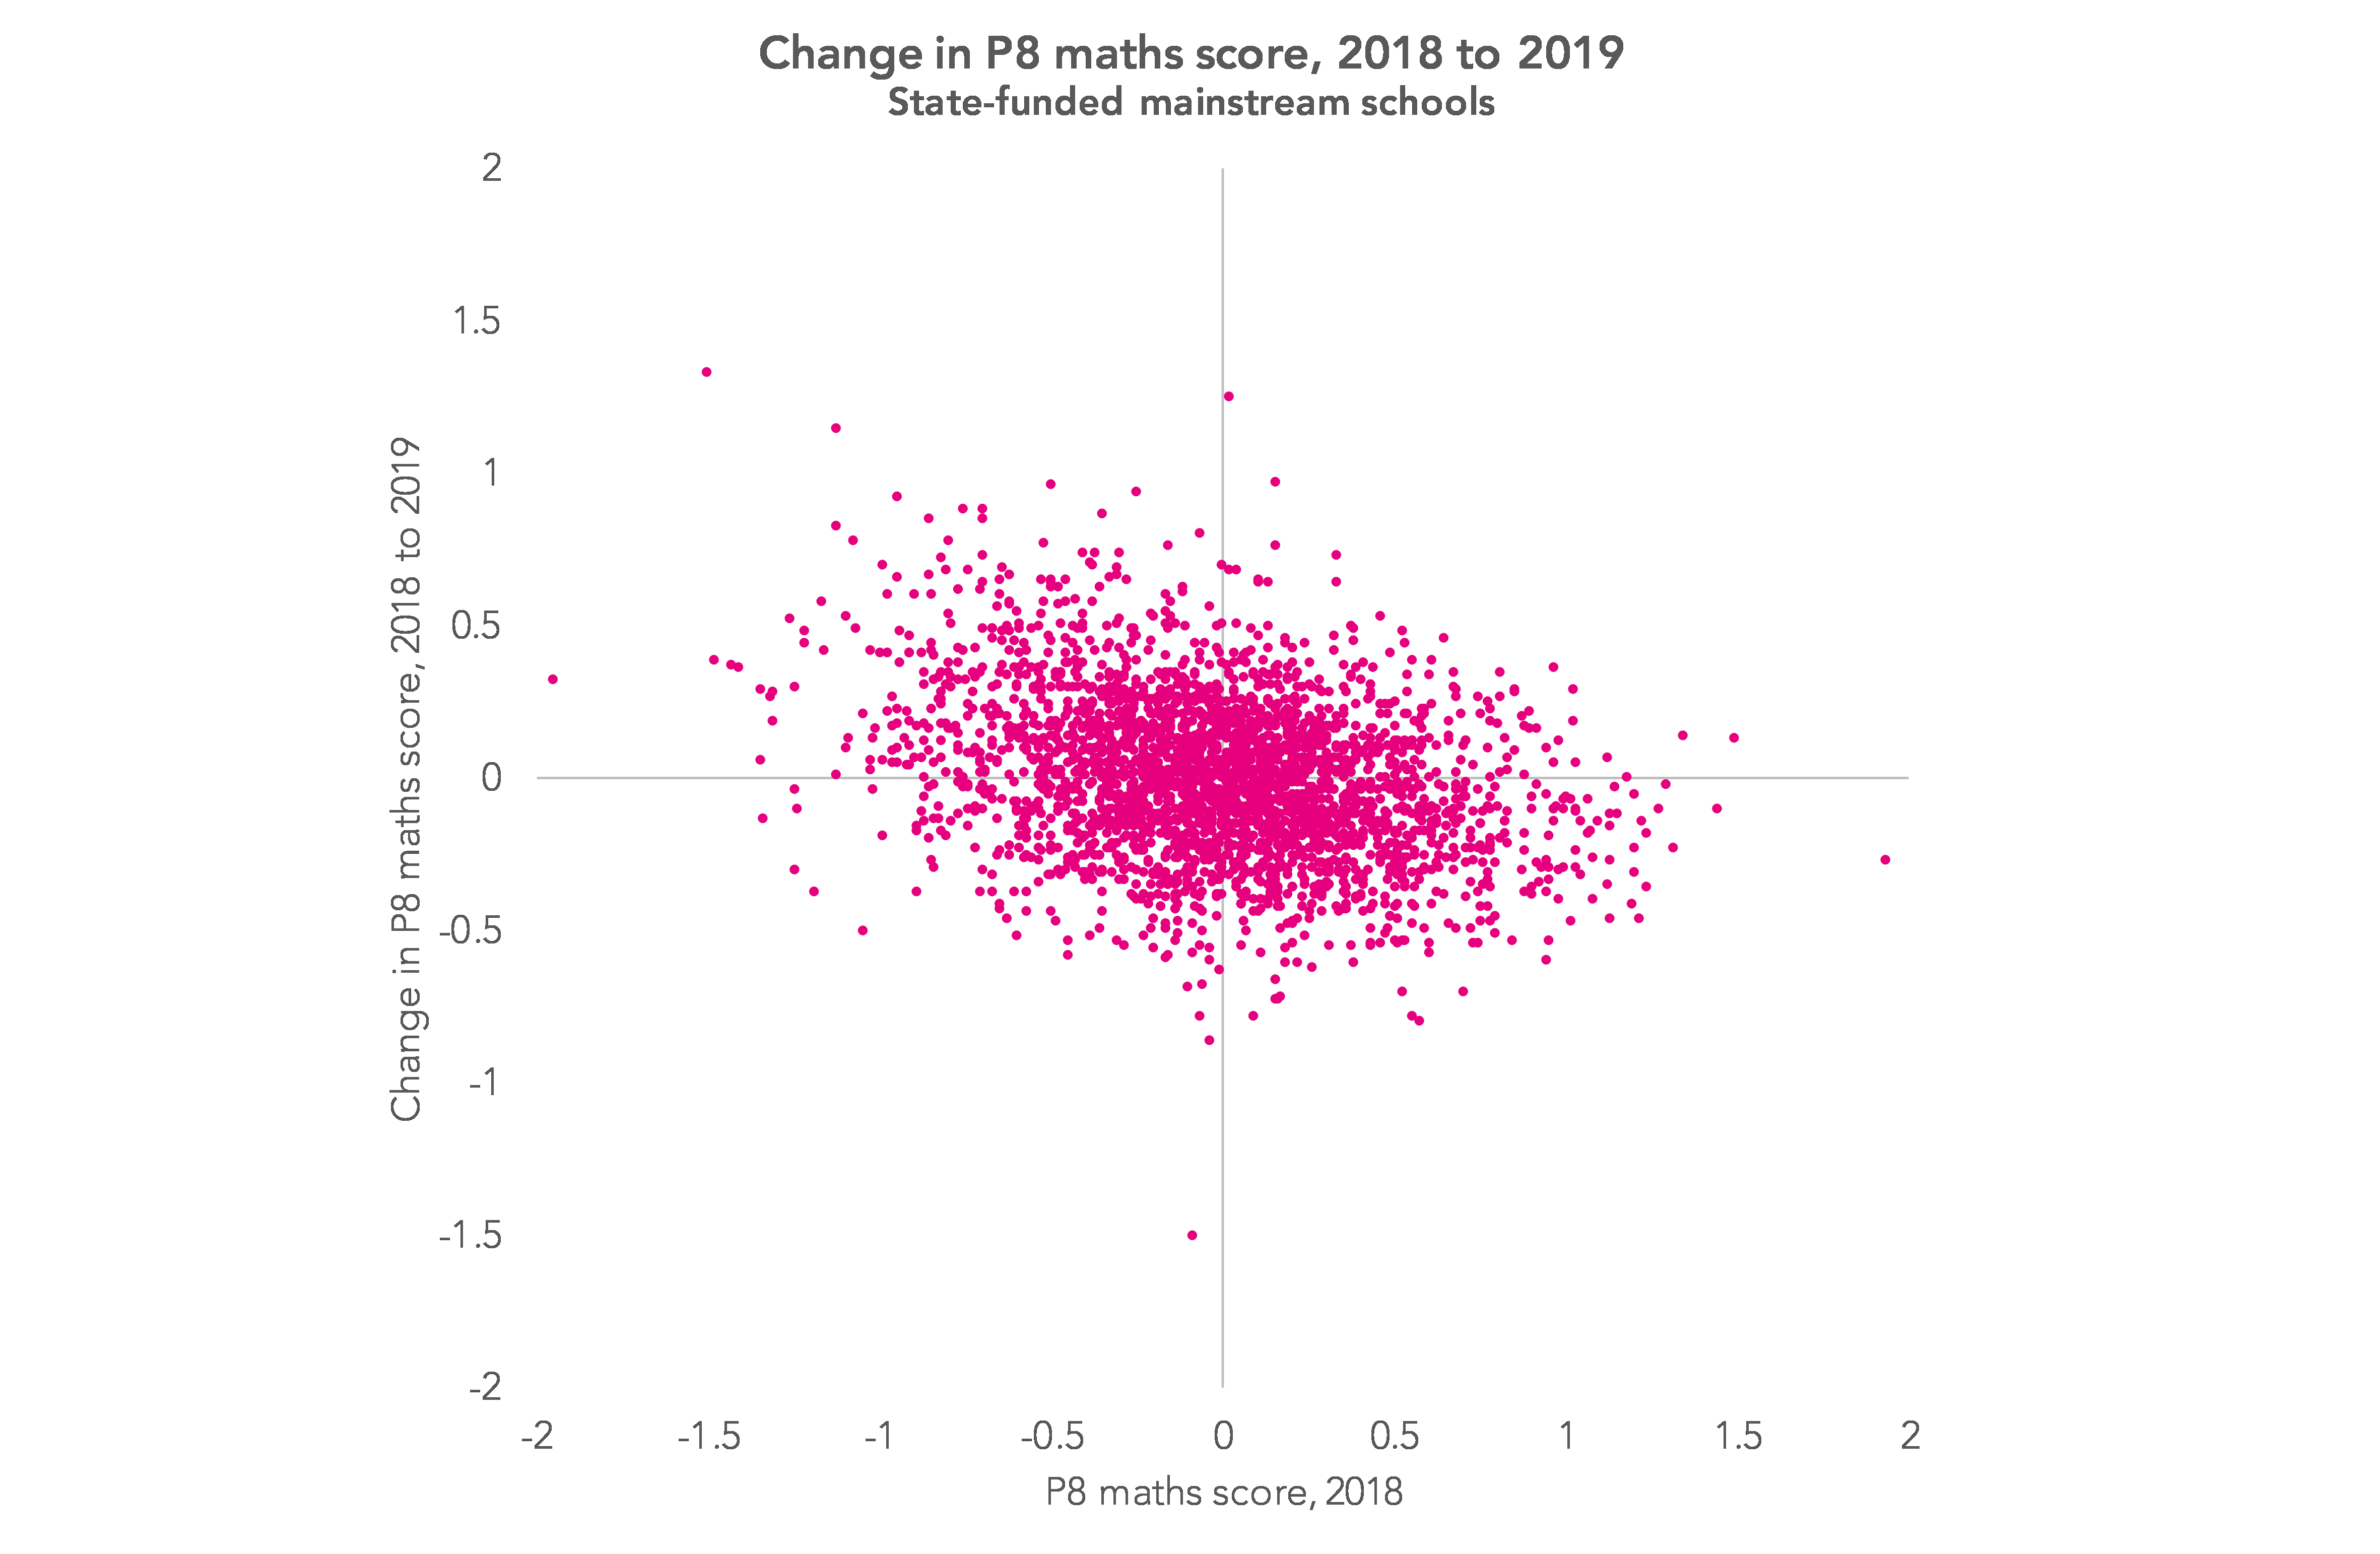
The correlation isn’t particularly strong (r=0.33) so it doesn’t necessarily follow that a school with a high P8 score last year won’t improve its score but it is less likely to.
Secondly, some of those which improved by a large margin last year wouldn’t have been so fortunate this year if exams were taken.
To show this I’m going to go back to the 2018 P8 maths data and identify 450 schools which had improved by at least 0.25 points compared to 2017. The chart below shows, for this group of schools, their improvement between 2017 and 2018, and the change in their P8 maths score from 2018 to 2019.
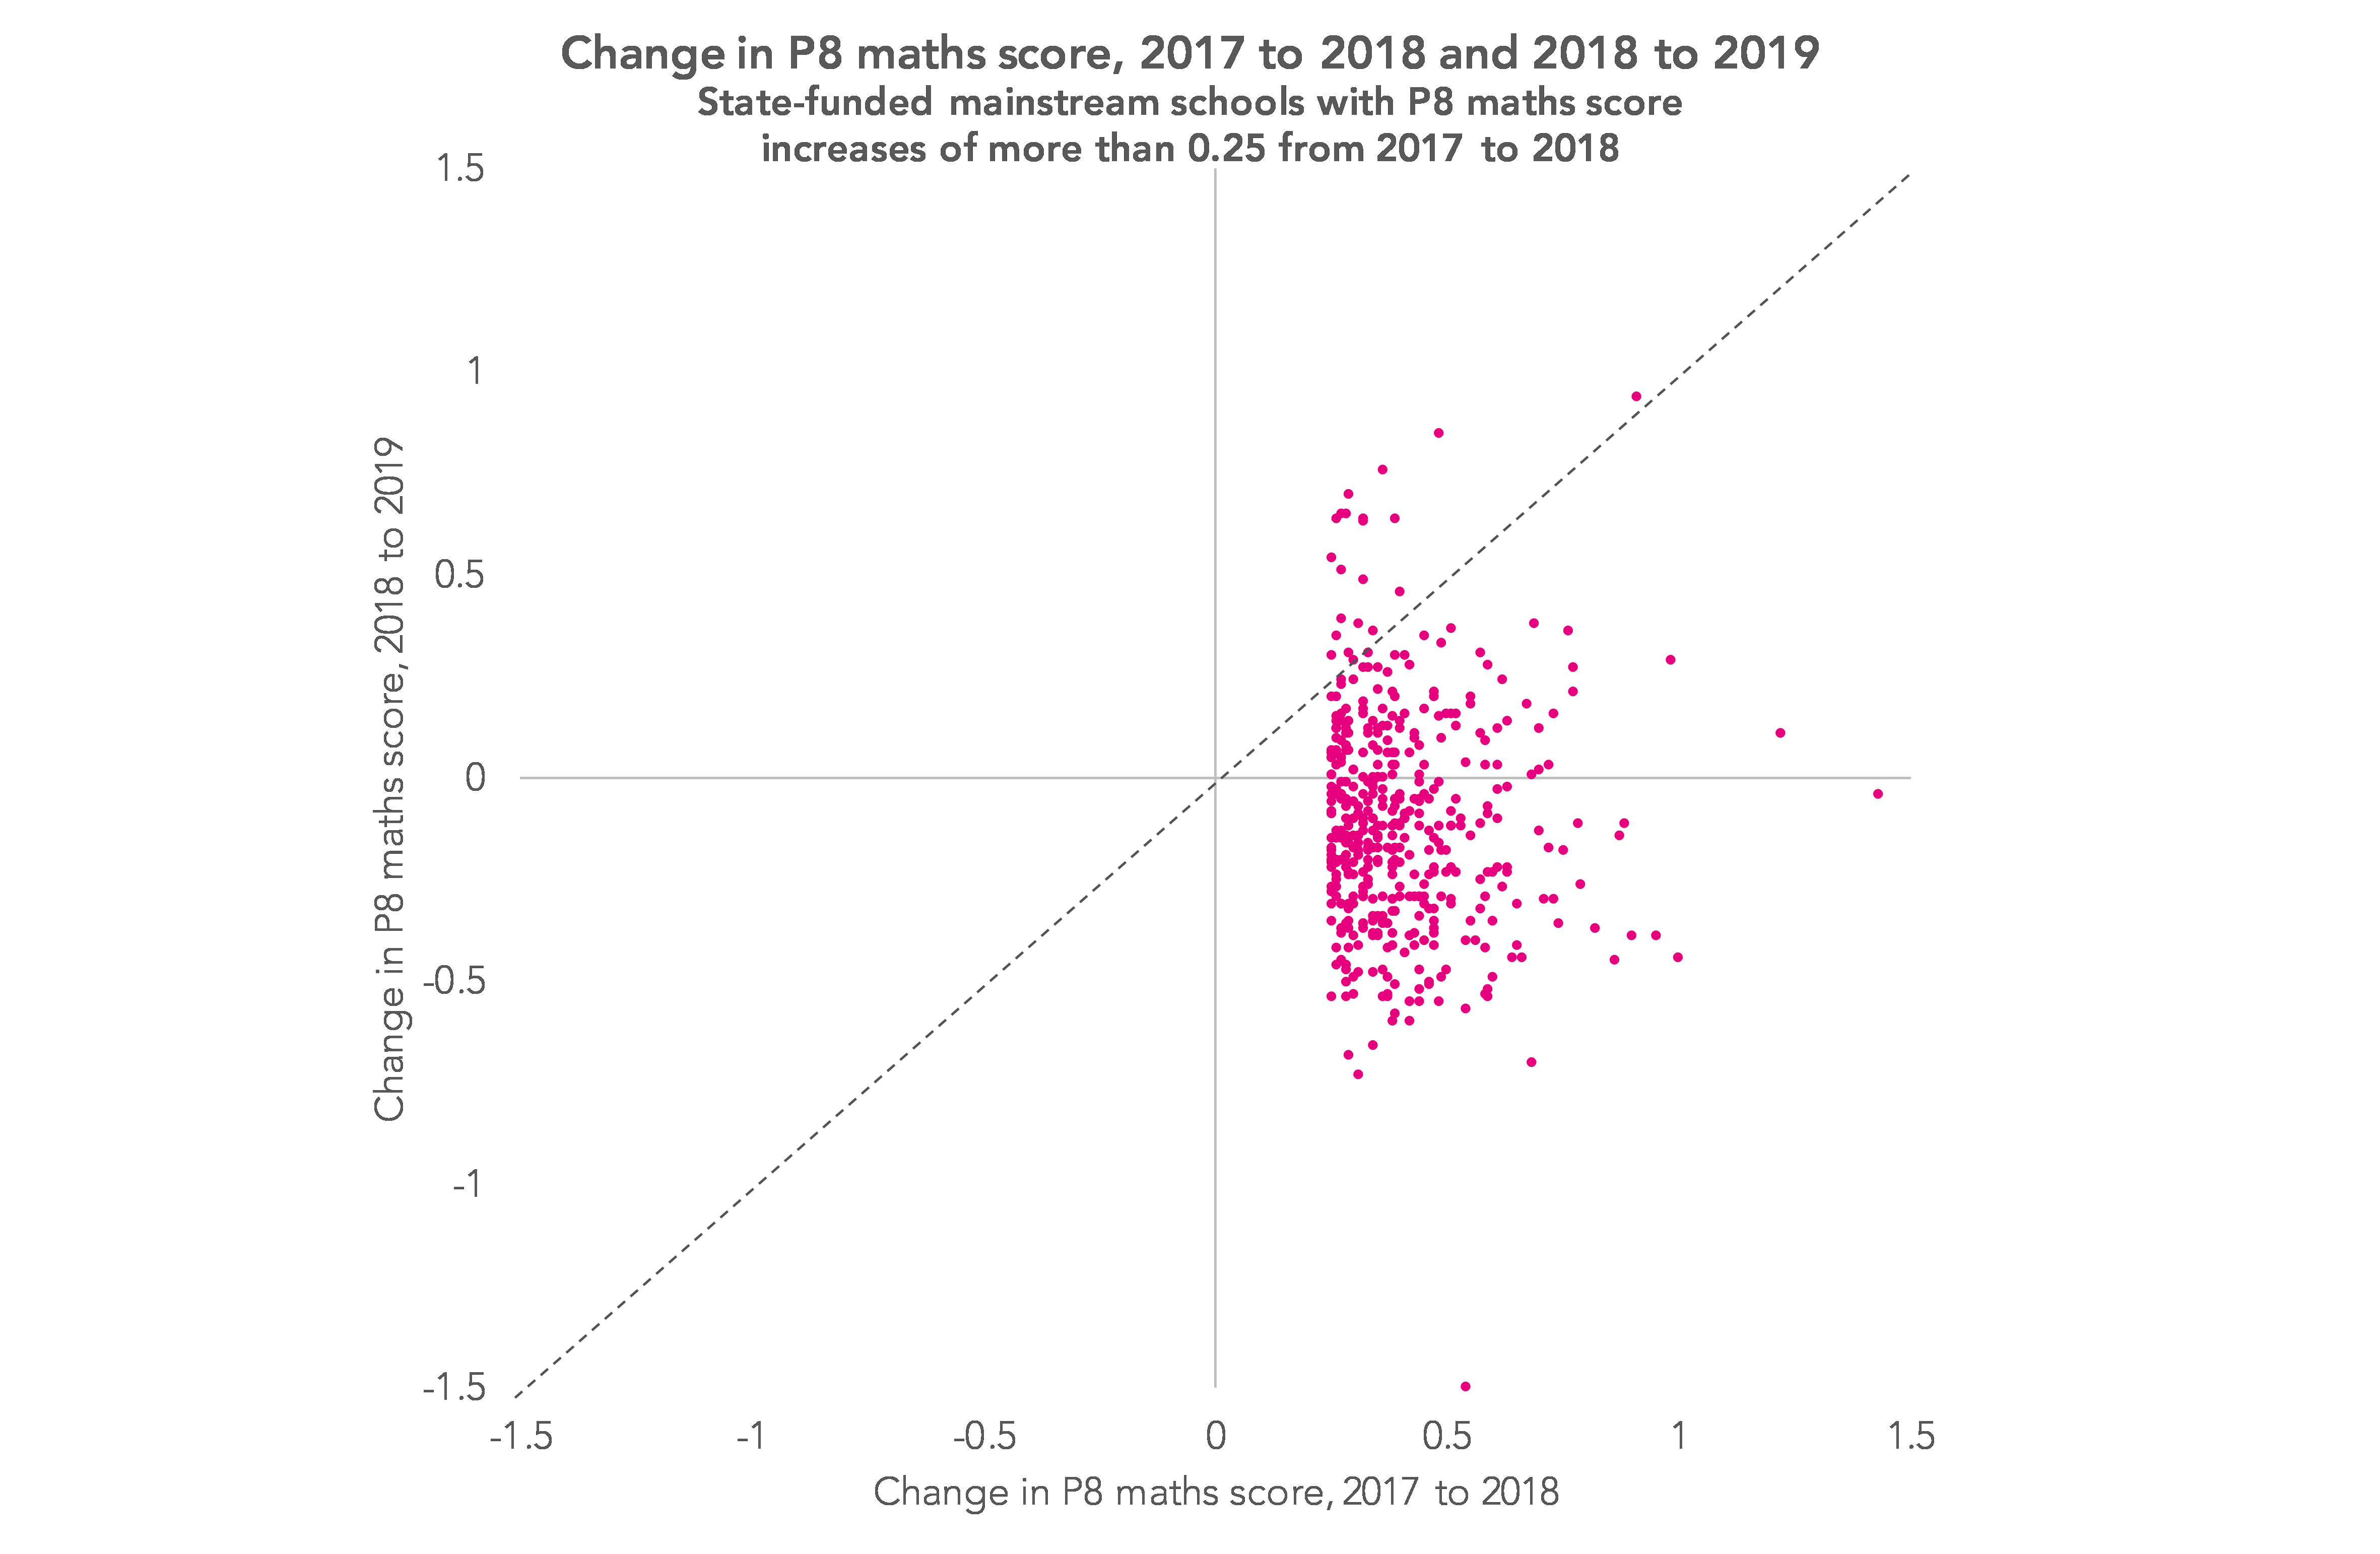
A handful of schools (those plotted above the diagonal line) improved by a greater margin in 2019 than in 2018, but overall improvements in 2019 tend to be smaller. The scores of many schools stabilized in 2019 (i.e. didn’t change by much), but they fell by more than 0.25 points at 140 schools (31%).[1]
Both of these features are, at least in part, a form of a statistical phenomenon known as regression to the mean. If chance goes in your favour one year, it is less likely to do so next year with a different set of exams and a different set of candidates.
It’s fairly clear that some pupils will lose out as a result of Ofqual’s decision. Despite this, you can see why the regulator would not want to try and correct for these fluctuations. Any adjustment risks failing the “Daily Mail test”. You could easily see this reported as “you did too well last year, so we’re going to mark you down this year.” Though perhaps a bit of extra latitude around the 4/3 borderline in English and maths would spare some pupils unnecessary resits.
Want to stay up-to-date with the latest research from FFT Education Datalab? Sign up to Datalab’s mailing list to get notifications about new blogposts, or to receive the team’s half-termly newsletter.
1. The inverse is also true: those schools whose scores falls by a large margin one year tend to improve the following year.


Leave A Comment