In England we’re accustomed to analysis of the gap in attainment between pupils classified as disadvantaged and their peers. The Department for Education publishes these statistics each year for pupils at the end of Key Stage 2 and Key Stage 4.
This tells us about the gap at the end of a Key Stage. But did the gap increase or widen from the start of school?
To try and address this, let’s follow two cohorts through their primary education from the end of the Foundation Stage to the end of Key Stage 2. These are the cohorts which reached the end of Key Stage 2 in 2018 and 2019. The DfE Statistics suggest a tiny increase in the attainment gap at the end of Key Stage 2 for the 2019 cohort.
An obvious but important caveat is that we are looking at the situation pre-pandemic.
Measuring the gap in the primary phase
In an ideal world (at least for this analysis), we would have a measure of attainment at the start of primary education. Instead, we use the total score in the Early Years Foundation Stage Profile (at the end of Reception). Our working assumption is that the disadvantage gap would have been present at the start of Reception.
The vast majority of the 2018 Key Stage 2 cohort would have been assessed under the previous Foundation Stage Profile whereas the 2019 cohort would have been assessed under the current version.
We restrict our analysis to pupils with all of the following results:
- Early Years Foundation Stage Profile (EYFSP) total score
- Key Stage 1 (KS1) average point score
- Key Stage 2 (KS2) mean test result in reading and maths
This means we do not include pupils who enter state-funded education in England from other countries during Key Stage 2. However, these pupils are included in DfE gap statistics.
The scores in the three assessments are all on different scales. To get around this, we calculate a percentile ranking for each pupil in each cohort on each measure. Percentile ranks are then converted to standardized scores using the inverse of the normal cumulative distribution function.
Which pupils are disadvantaged?
The attainment gap is typically calculated for pupils who are known to have been eligible for free school meals in the previous six years.
At the end of Key Stage 2, this will include pupils who were eligible for the whole of their primary education, as well as those who were only eligible for a short time.
By contrast, anyone eligible during their Reception year but never since would not be included.
For this analysis, we use the disadvantage flag from the end of Key Stage 2. But we also identify those who were eligible for free school meals in their Reception year.
How the gap changes
We first look at the gap for pupils who were classified as disadvantaged at the end of Key Stage 2, roughly 30% of the cohort.

For the 2018 cohort, we see a slight closing of the gap between Foundation Stage and Key Stage 2. But for the 2019 cohort, we see the opposite.
This may be due to the introduction of the new EYFSP. The gap was narrower to begin with for the 2019 cohort compared to the 2018 cohort. However, there was also a small increase in the gap (0.02 SD units) between Key Stage 1 and Key Stage 2 for the 2019 cohort.
We can produce the same chart for pupils known to be eligible for free school meals at the end of Reception and compare them to pupils never eligible for free school meals.
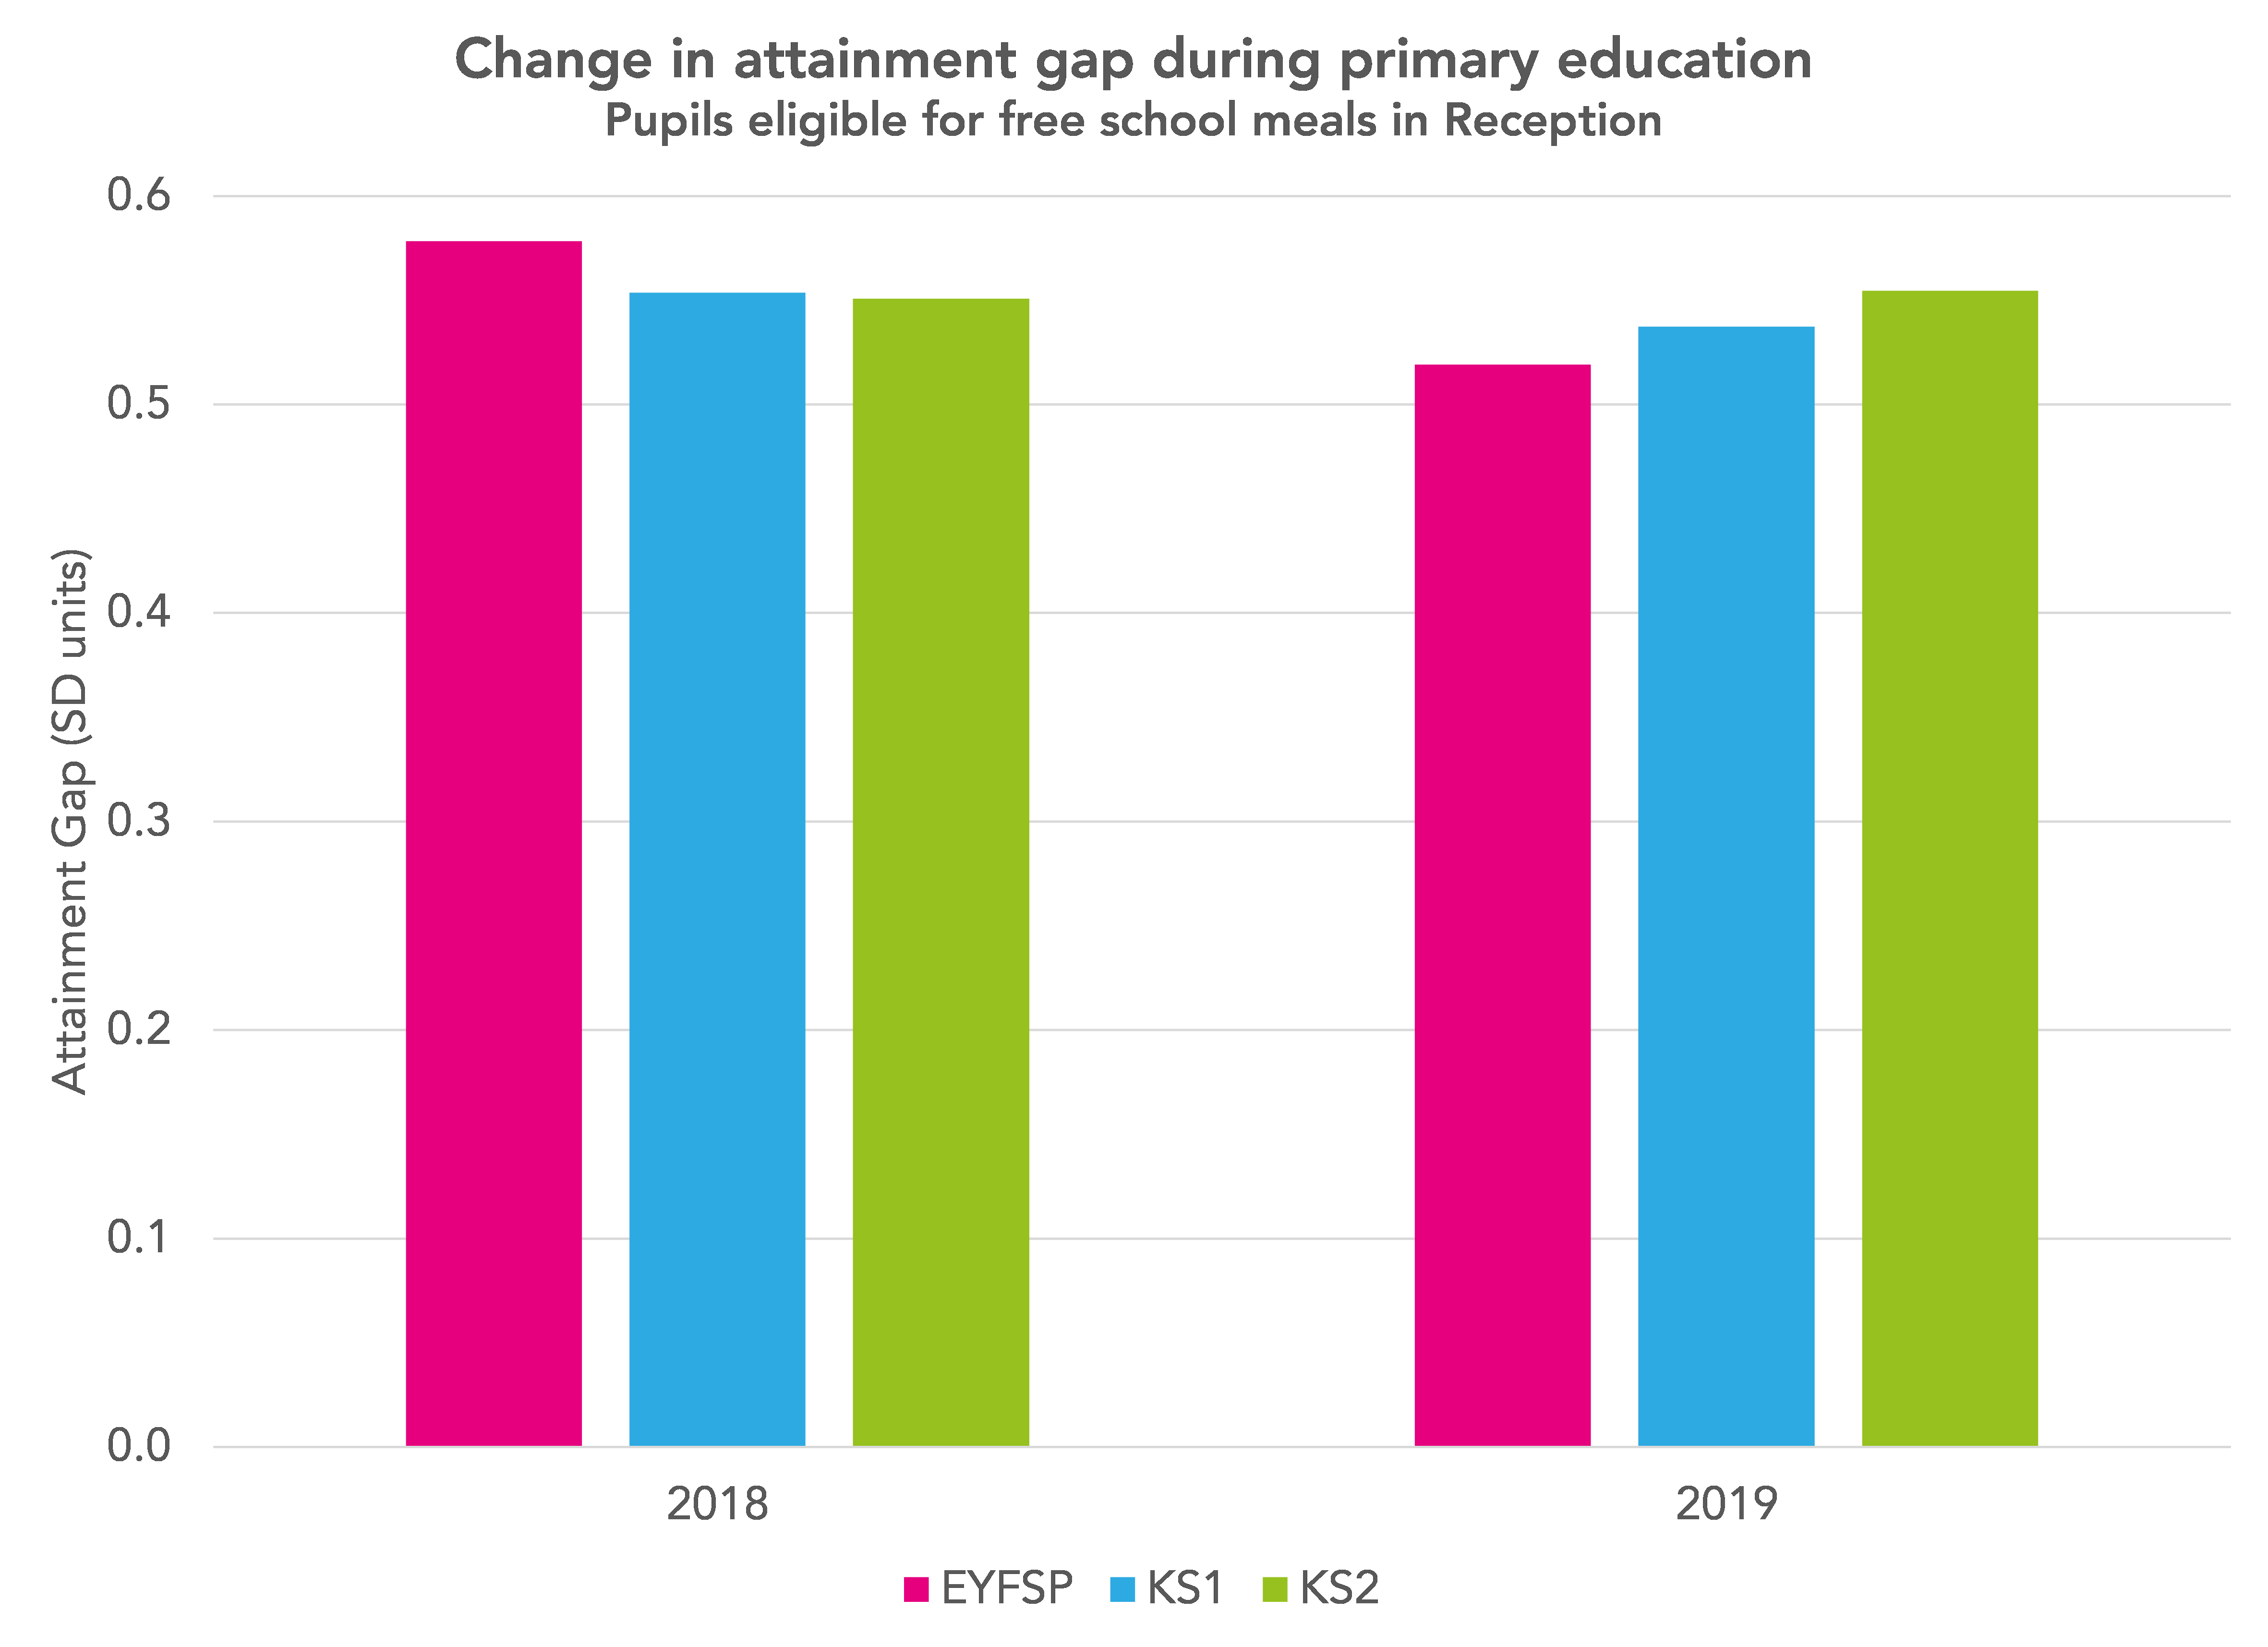
This shows a similar pattern, albeit the gaps are larger.
So do primary schools close gaps?
It looks as if the attainment gap remains fairly stable as pupils get older. But depending on which of the two cohorts you look at, it either closes slightly or widens slightly between Foundation Stage and Key Stage 2.
Part of the problem may be due to measurement. The new EYFSP may not be a particularly suitable measure for this type of analysis. Pupils are assessed on a three-point scale (emerging, expected, exceeding) across 17 learning goals (ELGs). These scales are scored 1, 2 and 3 respectively and summed across the 17 ELGs. Around 30% of pupils score exactly 34 on this measure (see Figure F here). The total correlates less well with Key Stage 1 average point score (correlation of 0.66) than the previous EYFSP total score (correlation of 0.73).
It is probably also worth considering the effect of regression to the mean. Pupils with lower scores at one Key Stage will tend to improve by the end of the next one. By contrast, pupils with higher scores will tend to see them fall.
Disadvantaged pupils will be disproportionately found in the lower end of the attainment range. So we might expect gaps to close as a result of regression to the mean. However, when we look at value added, we tend to find that disadvantaged pupils achieve less well in the following Key Stage compared to other pupils with similar prior attainment.
And finally we might find different patterns were we to look at the interaction between persistence of free school meals and other characteristics as we did here.

Want to stay up-to-date with the latest research from FFT Education Datalab? Sign up to Datalab’s mailing list to get notifications about new blogposts, or to receive the team’s half-termly newsletter.


Leave A Comment