The Department for Education has been collecting daily absence data from schools and other educational settings since the start of term. Summary data is published on a weekly basis.
However, at Education Select Committee in December 2020, the Minister for Schools admitted that the Department did not know how much school pupils in Year 11 had missed.
Using data collected from schools, we can now provide an answer.
Absence in the Autumn Term 2020 compared to 2019
Around 1,300 schools are currently using FFT Aspire Attendance Tracker to monitor and benchmark pupil attendance.
We firstly compare absence in the Autumn term 2020 in those schools to absence in all state-funded secondary schools in Autumn 2019.

Overall, pupils in Years 10 and 11 missed around 16% of sessions. Pupils in Year 7 missed around 10% of sessions. These figures are just under 2.5 times higher than in Autumn 2019.
These are just averages, of course. There were almost 40 schools with Year 11 absence rates over 32%, double the average rate.
And at the other end of the scale, around 150 schools had Year 11 absence rates of 8% or lower, half the average rate.
The impact of disadvantage
Perhaps unsurprisingly, disadvantaged pupils missed more school than other pupils. This was the case pre-pandemic as well.

Aspire Attendance Tracker
Schools can track, analyse and compare their attendance data against 1,000s of other FFT schools using Aspire Attendance Tracker.
Available now for Secondary schools – log in here.
Coming April for Primary schools – Make sure you’re set up by logging in here.
Not an FFT Aspire user? Learn more here.
In general, disadvantaged pupils missed 50% more sessions than other pupils. Among Year 11 pupils, disadvantaged pupils missed 21% of sessions compared to 14% among other pupils, a gap (allowing for rounding) of 6.9 percentage points.
This raises the question of whether disadvantaged pupils disproportionately attend schools with higher rates of absence.
To look at this, we calculate the absence rate for disadvantaged Year 11 pupils and other Year 11 pupils at each school.
If absence levels for the two groups were the same at every school then the absence rate for disadvantaged Year 11 pupils in the Autumn term 2020 would have been 14.9%.
This represents about 13% of the attendance gap. In other words, 13% of the gap is between schools, the rest within schools.
Variation by region
Based on published DfE data, we had previously noted how schools in the north initially had higher absence rates but this changed dramatically towards the end of term as the “Kent Variant” of COVID took hold.
But we can now see how Year 11 absence varied by region over the course of the Autumn term.
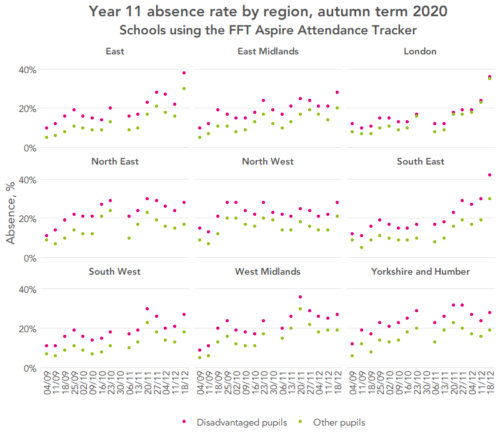
We see a pronounced rise in absence in London, the east and south-east at the very end of term. Absence for disadvantaged pupils in the south-east was 42% in the final week of term.
In all regions, with the exception in London (towards the end of term especially), absence rates for disadvantaged pupils clearly exceed those of other pupils. In general, absence rates for disadvantaged pupils tended to be highest in Yorkshire and the Humber.
Lost learning
Assuming that the 1,300 schools we collected data from are representative of all 3,000 or so secondary schools then it does appear that disadvantaged pupils missed out on more school in the Autumn term.
Crucially, it seems that disadvantaged pupils had a higher rate of absence compared to other pupils in the same school. This does not mean that they weren’t learning while absent, of course.
But if pupils learn more effectively in class, then there is a risk that disadvantaged pupils could be further disadvantaged when it comes to GCSE grades in the summer.
Want to stay up-to-date with the latest research from FFT Education Datalab? Sign up to Datalab’s mailing list to get notifications about new blogposts, or to receive the team’s half-termly newsletter.


Leave A Comment