This is the final part of a series examining the effect of non-response on PISA 2018 results for the United Kingdom. The previous parts can be found here and here.
In the previous part of this series, I discussed how a non-response bias analysis had to be undertaken for England’s and Northern Ireland’s PISA 2018 data.
The interpretation of the aforementioned bias analyses (by the OECD and the Department for Education) was that the PISA samples for these countries were “representative” and “not biased”.
But is this really the case?
This post presents evidence for England (where a bias analysis was undertaken) and Wales (where a bias analysis was not undertaken) to illustrate how such statements are simply not true.
Clear evidence of bias
Let’s start with Wales.
Through a freedom of information request, I have obtained the GCSE mathematics grade distribution of the Welsh PISA 2018 cohort (who took their GCSEs in 2019). In the table below, I compare this to the GCSE mathematics grade distribution in Wales for all pupils, using official government records.
It becomes immediately clear that the Welsh PISA sample underrepresents pupils who achieve lower GCSE grades.
For instance, according to official government data, 41% of young people in Wales failed to achieve a GCSE C grade in mathematics in the 2018/19 academic year. Yet, the analogous figure based upon PISA 2018 sample was just 31%.
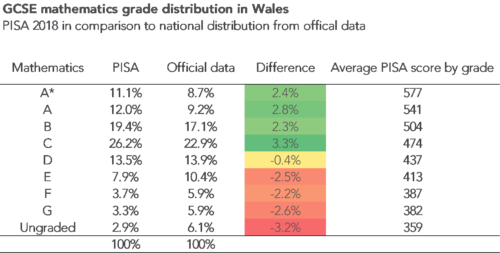
Notes: Figures for Wales refer to GCSE mathematics alone (not numeracy). For Wales, data on PISA grade distribution based on freedom of information request submitted by the author . Data on “official” grade distribution taken from the StatsWales website, using data for the 2018/19 academic year. Average PISA scores by grade based upon Table 3.3 of this – and refers to data on best GCSE grade out of numeracy and mathematics.
The next table – using information I also obtained through a freedom of information request – presents the same evidence for England.
The same pattern holds; lower-achieving pupils tends to be underrepresented in the English PISA sample.
In other words, despite the claims made by the OECD and the Department for Education, there is at least some evidence that bias may have crept into the UK’s PISA sample.
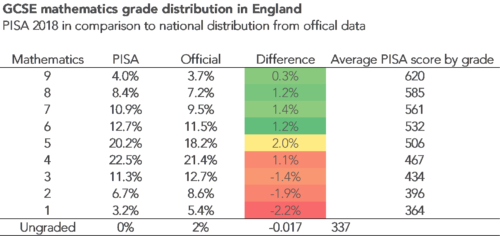
Notes: Green/red shading illustrates where the percentage achieving the grade is higher/lower in PISA than the national grade distribution. Figures for England based upon 2019 GCSE results in maths and a freedom of information request.
How might this affect PISA scores for England and Wales?
In my new paper, published here today and forthcoming in the Review of Education, I have tried to estimate the impact that the underrepresentation of low-achieving pupils may have had upon average PISA scores in England and Wales.
Full details about how I have tried to get a handle on this can be found within my paper. The headline finding, though, is that I estimate average PISA scores in England and Wales have been inflated by around 10 and 15 test points respectively, compared to if a truly representative sample had been drawn [1].
The third table, shown below, then illustrates what this would mean in terms of England’s and Wales’ position in the PISA 2018 “rankings”.
The reported average PISA mathematics score for England was 504 points – significantly above the average across industrialised (OECD) countries. But, had a truly representative sample been drawn, I estimate England’s PISA mathematics score would have been around 494 – roughly the same as the OECD average.
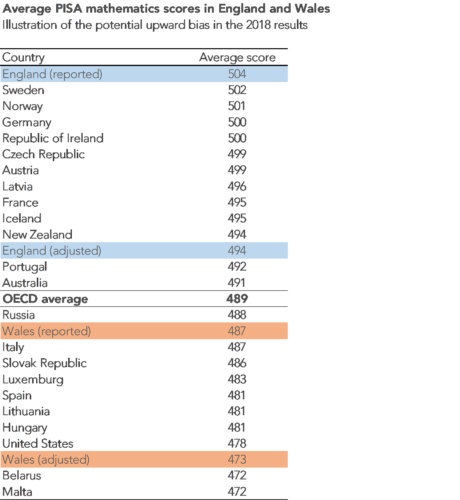
Notes: “Reported” figures refer to the official PISA scores as reported in Table D1.1 of the 2018 national report for England. “Adjusted” figures refer to my estimate of average PISA scores in England and Wales, after accounting for issues of non-participation.
A similar story holds for Wales. Their “official” PISA mathematics score of 487 puts Wales in-line with the OECD average (489). Yet, if a truly representative sample been drawn, I estimate their average score to be significantly lower (473 points).
This would put average mathematics scores of pupils in Wales in line with countries such as Malta and Belarus.
Now such thought experiments assume that there are not similar problems with the PISA data in other countries. This may not be true. Indeed, I have written previously about issues with the Canadian PISA data while there has also been recent controversy in Sweden due to the very high number of pupils it has excluded from PISA.
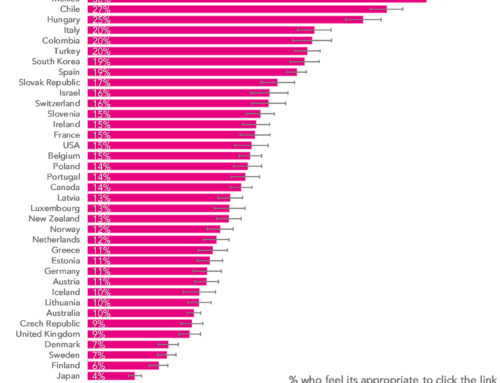
But two wrongs don’t make a right! And, as illustrated in the first blogpost of this series, there are clear reasons to suspect such problems may be more acute in some countries (e.g. the UK) than in others (e.g. Belarus, Finland and Singapore, where overall participation rates are over 90%).
- It has not been possible to produce equivalent figures for Scotland and Northern Ireland, due to a lack of information about the grades achieved in national exams (GCSEs in Northern Ireland or nationals in Scotland) for the PISA 2018 cohort.
Want to stay up-to-date with the latest research from FFT Education Datalab? Sign up to Datalab’s mailing list to get notifications about new blogposts, or to receive the team’s half-termly newsletter.

Clear, cogent and convincing. The next question is: why is this happening and who is doing it? Unless those questions are answered satisfactorily the suspicion must be that the UK is fiddling the figures to flatter its performance.
There is no suggestion in these blogs that such participation bias is intentional on the part of central authorities, only that the reporting should be more transparent. And lower-attaining students tend to have greater absence from school, so ensuring they take part is more difficult. Some participating jurisdictions, though, *require* nominated schools to take part in PISA. That of course increases participation rates. So there is a trade-off to be made between individual school choice (remembering that there is no direct benefit to schools in participating in such assessments) and the scale of participation.